

More on Personal Growth

Teronie Donalson
3 years ago
The best financial advice I've ever received and how you can use it.
Taking great financial advice is key to financial success.
A wealthy man told me to INVEST MY MONEY when I was young.
As I entered Starbucks, an older man was leaving. I noticed his watch and expensive-looking shirt, not like the guy in the photo, but one made of fine fabric like vicuna wool, which can only be shorn every two to three years. His Bentley confirmed my suspicions about his wealth.
This guy looked like James Bond, so I asked him how to get rich like him.
"Drug dealer?" he laughed.
Whether he was telling the truth, I'll never know, and I didn't want to be an accessory, but he quickly added, "Kid, invest your money; it will do wonders." He left.
When he told me to invest, he didn't say what. Later, I realized the investment game has so many levels that even if he drew me a blueprint, I wouldn't understand it.
The best advice I received was to invest my earnings. I must decide where to invest.
I'll preface by saying I'm not a financial advisor or Your financial advisor, but I'll share what I've learned from books, links, and sources. The rest is up to you.
Basically:
Invest your Money
Money is money, whether you call it cake, dough, moolah, benjamins, paper, bread, etc.
If you're lucky, you can buy one of the gold shirts in the photo.
Investing your money today means putting it towards anything that could be profitable.
According to the website Investopedia:
“Investing is allocating money to generate income or profit.”
You can invest in a business, real estate, or a skill that will pay off later.
Everyone has different goals and wants at different stages of life, so investing varies.
He was probably a sugar daddy with his Bentley, nice shirt, and Rolex.
In my twenties, I started making "good" money; now, in my forties, with a family and three kids, I'm building a legacy for my grandkids.
“It’s not how much money you make, but how much money you keep, how hard it works for you, and how many generations you keep it for.” — Robert Kiyosaki.
Money isn't evil, but lack of it is.
Financial stress is a major source of problems, according to studies.
Being broke hurts, especially if you want to provide for your family or do things.
“An investment in knowledge pays the best interest.” — Benjamin Franklin.
Investing in knowledge is invaluable. Before investing, do your homework.
You probably didn't learn about investing when you were young, like I didn't. My parents were in survival mode, making investing difficult.
In my 20s, I worked in banking to better understand money.
So, why invest?
Growth requires investment.
Investing puts money to work and can build wealth. Your money may outpace inflation with smart investing. Compounding and the risk-return tradeoff boost investment growth.
Investing your money means you won't have to work forever — unless you want to.
Two common ways to make money are;
-working hard,
and
-interest or capital gains from investments.
Capital gains can help you invest.
“How many millionaires do you know who have become wealthy by investing in savings accounts? I rest my case.” — Robert G. Allen
If you keep your money in a savings account, you'll earn less than 2% interest at best; the bank makes money by loaning it out.
Savings accounts are a safe bet, but the low-interest rates limit your gains.
Don't skip it. An emergency fund should be in a savings account, not the market.
Other reasons to invest:
Investing can generate regular income.
If you own rental properties, the tenant's rent will add to your cash flow.
Daily, weekly, or monthly rentals (think Airbnb) generate higher returns year-round.
Capital gains are taxed less than earned income if you own dividend-paying or appreciating stock.
Time is on your side
“Compound interest is the eighth wonder of the world. He who understands it, earns it; he who doesn’t — pays it.” — Albert Einstein
Historical data shows that young investors outperform older investors. So you can use compound interest over decades instead of investing at 45 and having less time to earn.
If I had taken that man's advice and invested in my twenties, I would have made a decent return by my thirties. (Depending on my investments)
So for those who live a YOLO (you only live once) life, investing can't hurt.
Investing increases your knowledge.
Lessons are clearer when you're invested. Each win boosts confidence and draws attention to losses. Losing money prompts you to investigate.
Before investing, I read many financial books, but I didn't understand them until I invested.
Now what?
What do you invest in? Equities, mutual funds, ETFs, retirement accounts, savings, business, real estate, cryptocurrencies, marijuana, insurance, etc.
The key is to start somewhere. Know you don't know everything. You must care.
“A journey of a thousand miles must begin with a single step.” — Lao Tzu.
Start simple because there's so much information. My first investment book was:
Robert Kiyosaki's "Rich Dad, Poor Dad"
This easy-to-read book made me hungry for more. This book is about the money lessons rich parents teach their children, which poor and middle-class parents neglect. The poor and middle-class work for money, while the rich let their assets work for them, says Kiyosaki.
There is so much to learn, but you gotta start somewhere.
More books:
***Wisdom
I hope I'm not suggesting that investing makes everything rosy. Remember three rules:
1. Losing money is possible.
2. Losing money is possible.
3. Losing money is possible.
You can lose money, so be careful.
Read, research, invest.
Golden rules for Investing your money
Never invest money you can't lose.
Financial freedom is possible regardless of income.
"Courage taught me that any sound investment will pay off, no matter how bad a crisis gets." Helu Carlos
"I'll tell you Wall Street's secret to wealth. When others are afraid, you're greedy. You're afraid when others are greedy. Buffett
Buy low, sell high, and have an exit strategy.
Ask experts or wealthy people for advice.
"With a good understanding of history, we can have a clear vision of the future." Helu Carlos
"It's not whether you're right or wrong, but how much money you make when you're right." Soros
"The individual investor should act as an investor, not a speculator." Graham
"It's different this time" is the most dangerous investment phrase. Templeton
Lastly,
Avoid quick-money schemes. Building wealth takes years, not months.
Start small and work your way up.
Thanks for reading!
This post is a summary. Read the full article here

Suzie Glassman
3 years ago
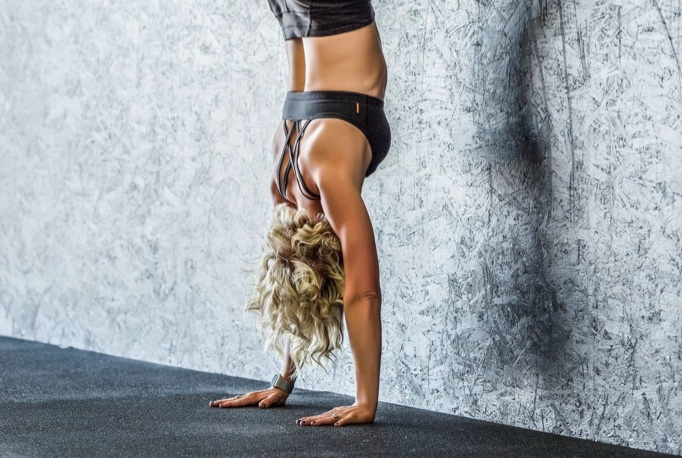
How I Stay Fit Despite Eating Fast Food and Drinking Alcohol
Here's me. Perfectionism is unnecessary.
This post isn't for people who gag at the prospect of eating french fries. I've been ridiculed for stating you can lose weight eating carbs and six-pack abs aren't good.
My family eats frozen processed meals and quick food most weeks (sometimes more). Clean eaters may think I'm unqualified to give fitness advice. I get it.
Hear me out, though. I’m a 44-year-old raising two busy kids with a weekly-traveling husband. Tutoring, dance, and guitar classes fill weeknights. I'm also juggling my job and freelancing.
I'm as worried and tired as my clients. I wish I ate only kale smoothies and salads. I can’t. Despite my mistakes, I'm fit. I won't promise you something just because it worked for me. But here’s a look at how I manage.
What I largely get right about eating
I have a flexible diet and track my daily intake. I count protein, fat, and carbs. Only on vacation or exceptional occasions do I not track.
My protein goal is 1 g per lb. I consume a lot of chicken breasts, eggs, turkey, and lean ground beef. I also occasionally drink protein shakes.
I eat 220–240 grams of carbs daily. My carb count depends on training volume and goals. I'm trying to lose weight slowly. If I want to lose weight faster, I cut carbs to 150-180.
My carbs include white rice, Daves Killer Bread, fruit, pasta, and veggies. I don't eat enough vegetables, so I take Athletic Greens. Also, V8.
Fat grams over 50 help me control my hormones. Recently, I've reached 70-80 grams. Cooking with olive oil. I eat daily dark chocolate. Eggs, butter, milk, and cheese contribute to the rest.
Those frozen meals? What can I say? Stouffer’s lasagna is sometimes needed. I order the healthiest fast food I can find (although I can never bring myself to order the salad). That's a chicken sandwich or a kid's hamburger. I rarely order fries. I eat slowly and savor each bite to feel full.
Potato chips and sugary cereals are in the pantry, but I'm not tempted. My kids eat them because I'd rather teach them moderation than total avoidance. If I eat them, I only eat one portion.
If you're not hungry and eating enough protein and fat, you won't want to eat everything in sight.
I drink once or twice a week. As a result, I rarely overdo it.
Food tracking is tedious and frustrating for many. Taking breaks and using estimates when eating out help. Not perfect, but realistic.
I practice a prolonged fast to enhance metabolic adaptability
Metabolic flexibility is the ability to switch between fuel sources (fat and carbs) based on activity intensity and time since eating. At rest or during low to moderate exertion, your body burns fat. Your body burns carbs after eating and during intense exercise.
Our metabolic flexibility can be hampered by lack of exercise, overeating, and stress. Our bodies become lousy fat burners, making weight loss difficult.
Once a week, I skip dinner (usually around 24 hours). Long-term fasting teaches my body to burn fat. It provides me one low-calorie day a week (I break the fast with a normal-sized dinner).
Fasting day helps me maintain my weight on weekends, when I typically overeat and drink.
Try an extended fast slowly. Delay breakfast by two hours. Next week, add two hours, etc. It takes practice to go that long without biting off your arm. I also suggest consulting your doctor.
I stay active.
I've always been active. As a child, I danced many nights a week, was on the high school dance team, and ran marathons in my 20s.
Often, I feel driven by an internal engine. Working from home makes it easy to exercise. If that’s not you, I get it. Everyone can benefit from raising their baseline.
After taking the kids to school, I walk two miles around the neighborhood. When I need to think, I switch off podcasts. First thing in the morning, I go for a walk.
I lift weights Monday, Wednesday, and Friday. 45 minutes is typical. I run 45-90 minutes on Tuesday and Thursday. I'm slow but reliable. On Saturdays and Sundays, I walk and add a short spin class if I'm not too tired.
I almost never forgo sleep.
I rarely stay up past 10 p.m., much to my night-owl husband's dismay. My 7-8-hour nights help me recover from workouts and handle stress. Without it, I'm grumpy.
I suppose sleep duration matters more than bedtime. Some people just can't fall asleep early. Internal clock and genetics determine sleep and wake hours.
Prioritize sleep.
Last thoughts
Fitness and diet advice is often useless. Some of the advice is inaccurate, dangerous, or difficult to follow if you have a life. I want to throw a shoe at my screen when I see headlines promising to speed up my metabolism or help me lose fat.
I studied exercise physiology for years. No shortcuts exist. No medications or cleanses reset metabolism. I play the hand I'm dealt. I realize that just because something works for me, it won't for you.
If I wanted 15% body fat and ripped abs, I'd have to be stricter. I occasionally think I’d like to get there. But then I remember I’m happy with my life. I like fast food and beer. Pizza and margaritas are favorites (not every day).
You can get it mostly right and live a healthy life.

Theo Seeds
3 years ago
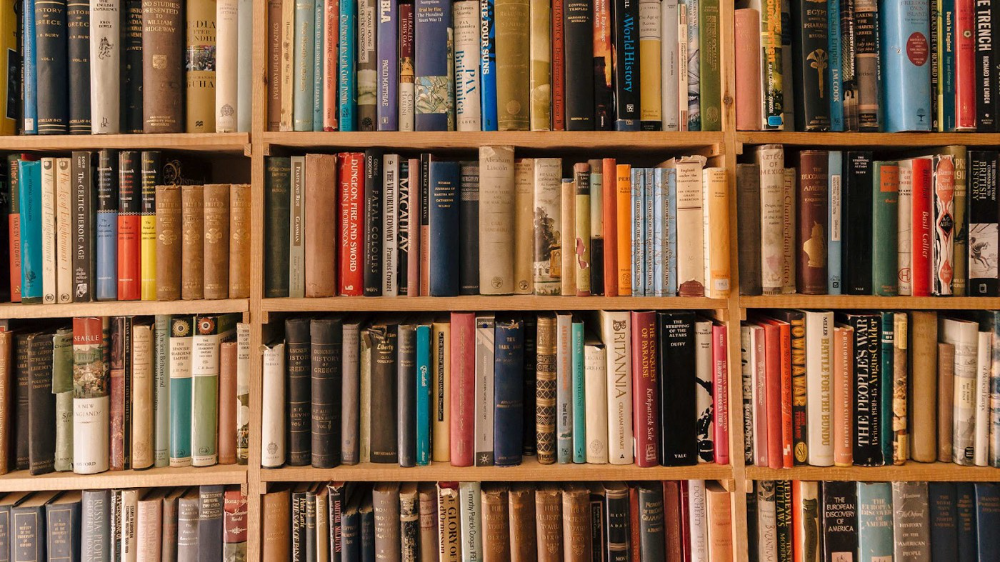
The nine novels that have fundamentally altered the way I view the world
I read 53 novels last year and hope to do so again.
Books are best if you love learning. You get a range of perspectives, unlike podcasts and YouTube channels where you get the same ones.
Book quality varies. I've read useless books. Most books teach me something.
These 9 novels have changed my outlook in recent years. They've made me rethink what I believed or introduced me to a fresh perspective that changed my worldview.
You can order these books yourself. Or, read my summaries to learn what I've synthesized.
Enjoy!
Fooled By Randomness
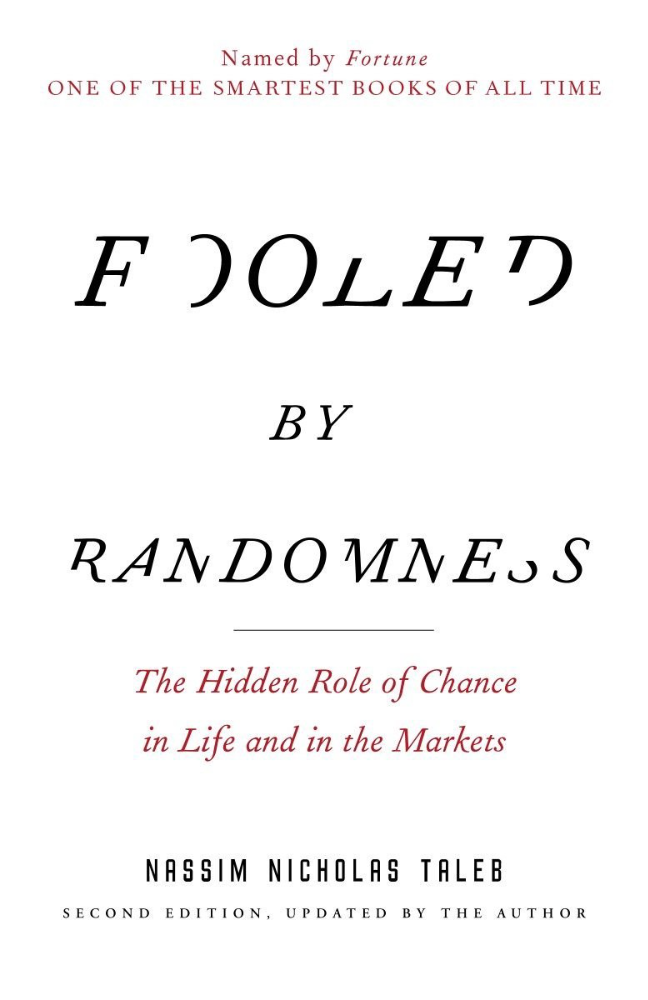
Nassim Taleb worked as a Wall Street analyst. He used options trading to bet on unlikely events like stock market crashes.
Using financial models, investors predict stock prices. The models assume constant, predictable company growth.
These models base their assumptions on historical data, so they assume the future will be like the past.
Fooled By Randomness argues that the future won't be like the past. We often see impossible market crashes like 2008's housing market collapse. The world changes too quickly to use historical data: by the time we understand how it works, it's changed.
Most people don't live to see history unfold. We think our childhood world will last forever. That goes double for stable societies like the U.S., which hasn't seen major turbulence in anyone's lifetime.
Fooled By Randomness taught me to expect the unexpected. The world is deceptive and rarely works as we expect. You can't always trust your past successes or what you've learned.
Antifragile
More Taleb. Some things, like the restaurant industry and the human body, improve under conditions of volatility and turbulence.
We didn't have a word for this counterintuitive concept until Taleb wrote Antifragile. The human body (which responds to some stressors, like exercise, by getting stronger) and the restaurant industry both benefit long-term from disorder (when economic turbulence happens, bad restaurants go out of business, improving the industry as a whole).
Many human systems are designed to minimize short-term variance because humans don't understand it. By eliminating short-term variation, we increase the likelihood of a major disaster.
Once, we put out every forest fire we found. Then, dead wood piled up in forests, causing catastrophic fires.
We don't like price changes, so politicians prop up markets with stimulus packages and printing money. This leads to a bigger crash later. Two years ago, we printed a ton of money for stimulus checks, and now we have double-digit inflation.
Antifragile taught me how important Plan B is. A system with one or two major weaknesses will fail. Make large systems redundant, foolproof, and change-responsive.
Reality is broken
We dread work. Work is tedious. Right?
Wrong. Work gives many people purpose. People are happiest when working. (That's why some are workaholics.)
Factory work saps your soul, office work is boring, and working for a large company you don't believe in and that operates unethically isn't satisfying.
Jane McGonigal says in Reality Is Broken that meaningful work makes us happy. People love games because they simulate good work. McGonigal says work should be more fun.
Some think they'd be happy on a private island sipping cocktails all day. That's not true. Without anything to do, most people would be bored. Unemployed people are miserable. Many retirees die within 2 years, much more than expected.
Instead of complaining, find meaningful work. If you don't like your job, it's because you're in the wrong environment. Find the right setting.
The Lean Startup
Before the airplane was invented, Harvard scientists researched flying machines. Who knew two North Carolina weirdos would beat them?
The Wright Brothers' plane design was key. Harvard researchers were mostly theoretical, designing an airplane on paper and trying to make it fly in theory. They'd build it, test it, and it wouldn't fly.
The Wright Brothers were different. They'd build a cheap plane, test it, and it'd crash. Then they'd learn from their mistakes, build another plane, and it'd crash.
They repeated this until they fixed all the problems and one of their planes stayed aloft.
Mistakes are considered bad. On the African savannah, one mistake meant death. Even today, if you make a costly mistake at work, you'll be fired as a scapegoat. Most people avoid failing.
In reality, making mistakes is the best way to learn.
Eric Reis offers an unintuitive recipe in The Lean Startup: come up with a hypothesis, test it, and fail. Then, try again with a new hypothesis. Keep trying, learning from each failure.
This is a great startup strategy. Startups are new businesses. Startups face uncertainty. Run lots of low-cost experiments to fail, learn, and succeed.
Don't fear failing. Low-cost failure is good because you learn more from it than you lose. As long as your worst-case scenario is acceptable, risk-taking is good.
The Sovereign Individual
Today, nation-states rule the world. The UN recognizes 195 countries, and they claim almost all land outside of Antarctica.
We agree. For the past 2,000 years, much of the world's territory was ungoverned.
Why today? Because technology has created incentives for nation-states for most of the past 500 years. The logic of violence favors nation-states, according to James Dale Davidson, author of the Sovereign Individual. Governments have a lot to gain by conquering as much territory as possible, so they do.
Not always. During the Dark Ages, Europe was fragmented and had few central governments. Partly because of armor. With armor, a sword, and a horse, you couldn't be stopped. Large states were hard to form because they rely on the threat of violence.
When gunpowder became popular in Europe, violence changed. In a world with guns, assembling large armies and conquest are cheaper.
James Dale Davidson says the internet will make nation-states obsolete. Most of the world's wealth will be online and in people's heads, making capital mobile.
Nation-states rely on predatory taxation of the rich to fund large militaries and welfare programs.
When capital is mobile, people can live anywhere in the world, Davidson says, making predatory taxation impossible. They're not bound by their job, land, or factory location. Wherever they're treated best.
Davidson says that over the next century, nation-states will collapse because they won't have enough money to operate as they do now. He imagines a world of small city-states, like Italy before 1900. (or Singapore today).
We've already seen some movement toward a more Sovereign Individual-like world. The pandemic proved large-scale remote work is possible, freeing workers from their location. Many cities and countries offer remote workers incentives to relocate.
Many Western businesspeople live in tax havens, and more people are renouncing their US citizenship due to high taxes. Increasing globalization has led to poor economic conditions and resentment among average people in the West, which is why politicians like Trump and Sanders rose to popularity with angry rhetoric, even though Obama rose to popularity with a more hopeful message.
The Sovereign Individual convinced me that the future will be different than Nassim Taleb's. Large countries like the U.S. will likely lose influence in the coming decades, while Portugal, Singapore, and Turkey will rise. If the trend toward less freedom continues, people may flee the West en masse.
So a traditional life of college, a big firm job, hard work, and corporate advancement may not be wise. Young people should learn as much as possible and develop flexible skills to adapt to the future.
Sapiens
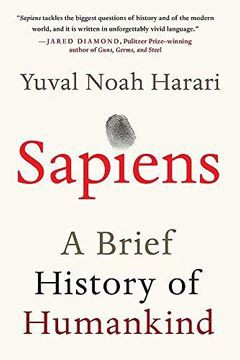
Sapiens is a history of humanity, from proto-humans in Ethiopia to our internet society today, with some future speculation.
Sapiens views humans (and Homo sapiens) as a unique species on Earth. We were animals 100,000 years ago. We're slowly becoming gods, able to affect the climate, travel to every corner of the Earth (and the Moon), build weapons that can kill us all, and wipe out thousands of species.
Sapiens examines what makes Homo sapiens unique. Humans can believe in myths like religion, money, and human-made entities like countries and LLCs.
These myths facilitate large-scale cooperation. Ants from the same colony can cooperate. Any two humans can trade, though. Even if they're not genetically related, large groups can bond over religion and nationality.
Combine that with intelligence, and you have a species capable of amazing feats.
Sapiens may make your head explode because it looks at the world without presupposing values, unlike most books. It questions things that aren't usually questioned and says provocative things.
It also shows how human history works. It may help you understand and predict the world. Maybe.
The 4-hour Workweek
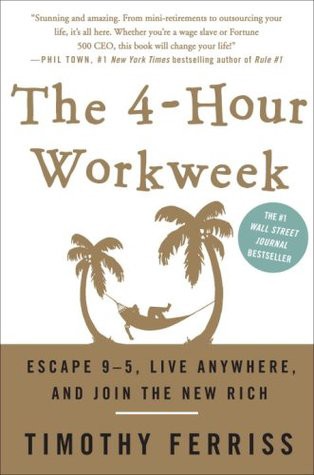
Things can be done better.
Tradition, laziness, bad bosses, or incentive structures cause complacency. If you're willing to make changes and not settle for the status quo, you can do whatever you do better and achieve more in less time.
The Four-Hour Work Week advocates this. Tim Ferriss explains how he made more sales in 2 hours than his 8-hour-a-day colleagues.
By firing 2 of his most annoying customers and empowering his customer service reps to make more decisions, he was able to leave his business and travel to Europe.
Ferriss shows how to escape your 9-to-5, outsource your life, develop a business that feeds you with little time, and go on mini-retirement adventures abroad.
Don't accept the status quo. Instead, level up. Find a way to improve your results. And try new things.
Why Nations Fail
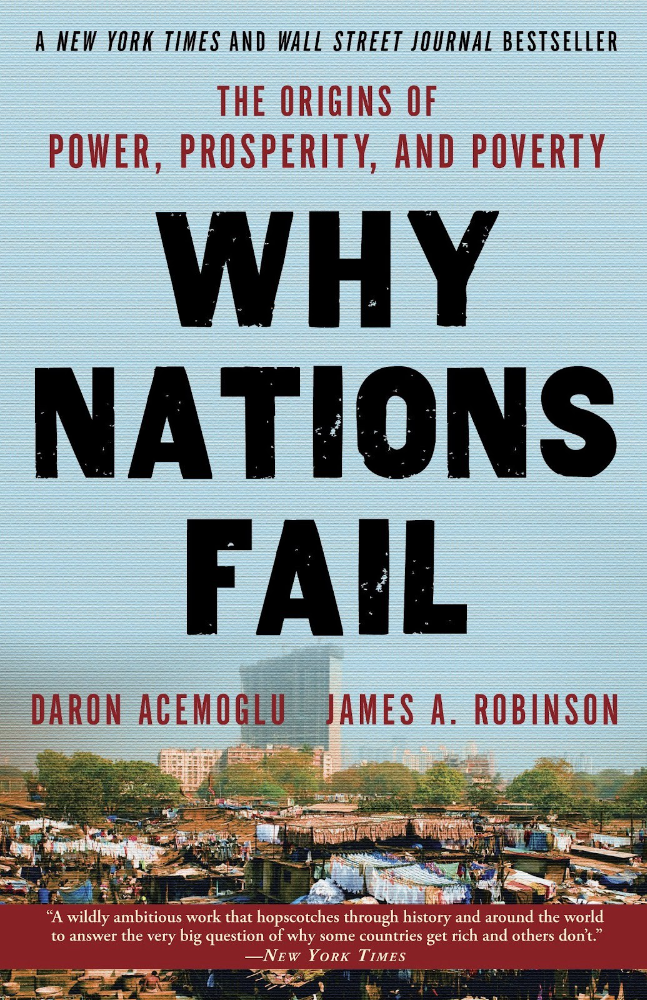
Nogales, Arizona and Mexico were once one town. The US/Mexico border was arbitrarily drawn.
Both towns have similar cultures and populations. Nogales, Arizona is well-developed and has a high standard of living. Nogales, Mexico is underdeveloped and has a low standard of living. Whoa!
Why Nations Fail explains how government-created institutions affect country development. Strong property rights, capitalism, and non-corrupt governments promote development. Countries without capitalism, strong property rights, or corrupt governments don't develop.
Successful countries must also embrace creative destruction. They must offer ordinary citizens a way to improve their lot by creating value for others, not reducing them to slaves, serfs, or peasants. Authors say that ordinary people could get rich on trading expeditions in 11th-century Venice.
East and West Germany and North and South Korea have different economies because their citizens are motivated differently. It explains why Chile, China, and Singapore grow so quickly after becoming market economies.
People have spent a lot of money on third-world poverty. According to Why Nations Fail, education and infrastructure aren't the answer. Developing nations must adopt free-market economic policies.
Elon Musk
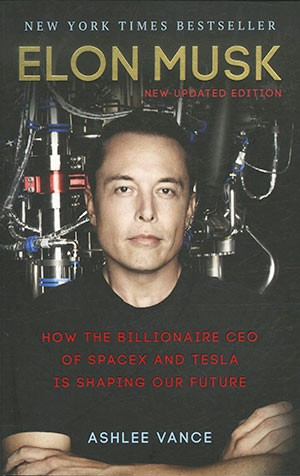
Elon Musk is the world's richest man, but that’s not a good way to describe him. Elon Musk is the world's richest man, which is like calling Steve Jobs a turtleneck-wearer or Benjamin Franklin a printer.
Elon Musk does cool sci-fi stuff to help humanity avoid existential threats.
Oil will run out. We've delayed this by developing better extraction methods. We only have so much nonrenewable oil.
Our society is doomed if it depends on oil. Elon Musk invested heavily in Tesla and SolarCity to speed the shift to renewable energy.
Musk worries about AI: we'll build machines smarter than us. We won't be able to stop these machines if something goes wrong, just like cows can't fight humans. Neuralink: we need to be smarter to compete with AI when the time comes.
If Earth becomes uninhabitable, we need a backup plan. Asteroid or nuclear war could strike Earth at any moment. We may not have much time to react if it happens in a few days. We must build a new civilization while times are good and resources are plentiful.
Short-term problems dominate our politics, but long-term issues are more important. Long-term problems can cause mass casualties and homelessness. Musk demonstrates how to think long-term.
The main reason people are impressed by Elon Musk, and why Ashlee Vances' biography influenced me so much, is that he does impossible things.
Electric cars were once considered unprofitable, but Tesla has made them mainstream. SpaceX is the world's largest private space company.
People lack imagination and dismiss ununderstood ideas as impossible. Humanity is about pushing limits. Don't worry if your dreams seem impossible. Try it.
Thanks for reading.
You might also like

Khoi Ho
3 years ago
After working at seven startups, here are the early-stage characteristics that contributed to profitability, unicorn status or successful acquisition.

I've worked in a People role at seven early-stage firms for over 15 years (I enjoy chasing a dream!). Few of the seven achieved profitability, including unicorn status or acquisition.
Did early-stage startups share anything? Was there a difference between winners and losers? YES.
I support founders and entrepreneurs building financially sustainable enterprises with a compelling cause. This isn't something everyone would do. A company's success demands more than guts. Founders drive startup success.
Six Qualities of Successful Startups
Successful startup founders either innately grasped the correlation between strong team engagement and a well-executed business model, or they knew how to ask and listen to others (executive coaches, other company leaders, the team itself) to learn about it.
Successful startups:
1. Co-founders agreed and got along personally.
Multi-founder startups are common. When co-founders agree on strategic decisions and are buddies, there's less friction and politics at work.
As a co-founder, ask your team if you're aligned. They'll explain.
I've seen C-level leaders harbor personal resentments over disagreements. A co-departure founder's caused volatile leadership and work disruptions that the team struggled to manage during and after.
2. Team stayed.
Successful startups have low turnover. Nobody is leaving. There may be a termination for performance, but other team members will have observed the issues and agreed with the decision.
You don't want organizational turnover of 30%+, with leaders citing performance issues but the team not believing them. This breeds suspicion.
Something is wrong if many employees leave voluntarily or involuntarily. You may hear about lack of empowerment, support, or toxic leadership in exit interviews and from the existing team. Intellectual capital loss and resource instability harm success.
3. Team momentum.
A successful startup's team is excited about its progress. Consistently achieving goals and having trackable performance metrics. Some describe this period of productivity as magical, with great talents joining the team and the right people in the right places. Increasing momentum.
I've also seen short-sighted decisions where only some departments, like sales and engineering, had goals. Lack of a unified goals system created silos and miscommunication. Some employees felt apathetic because they didn't know how they contributed to team goals.
4. Employees advanced in their careers.
Even if you haven't created career pathing or professional development programs, early-stage employees will grow and move into next-level roles. If you hire more experienced talent and leaders, expect them to mentor existing team members. Growing companies need good performers.
New talent shouldn't replace and discard existing talent. This creates animosity and makes existing employees feel unappreciated for their early contributions to the company.
5. The company lived its values.
Culture and identity are built on lived values. A company's values affect hiring, performance management, rewards, and other processes. Identify, practice, and believe in company values. Starting with team values instead of management or consultants helps achieve this. When a company's words and actions match, it builds trust.
When company values are beautifully displayed on a wall but few employees understand them, the opposite is true. If an employee can't name the company values, they're useless.
6. Communication was clear.
When necessary information is shared with the team, they feel included, trusted, and like owners. Transparency means employees have the needed information to do their jobs. Disclosure builds trust. The founders answer employees' questions honestly.
Information accessibility decreases office politics. Without transparency, even basic information is guarded and many decisions are made in secret. I've seen founders who don't share financial, board meeting, or compensation and equity information. The founders' lack of trust in the team wasn't surprising, so it was reciprocated.
The Choices
Finally. All six of the above traits (leadership alignment, minimal turnover, momentum, professional advancement, values, and transparency) were high in the profitable startups I've worked at, including unicorn status or acquisition.
I've seen these as the most common and constant signals of startup success or failure.
These characteristics are the product of founders' choices. These decisions lead to increased team engagement and business execution.
Here's something to consider for startup employees and want-to-bes. 90% of startups fail, despite the allure of building something new and gaining ownership. With the emotional and time investment in startup formation, look for startups with these traits to reduce your risk.
Both you and the startup will thrive in these workplaces.

Jim Clyde Monge
3 years ago
Can You Sell Images Created by AI?
Some AI-generated artworks sell for enormous sums of money.
But can you sell AI-Generated Artwork?
Simple answer: yes.
However, not all AI services enable allow usage and redistribution of images.
Let's check some of my favorite AI text-to-image generators:
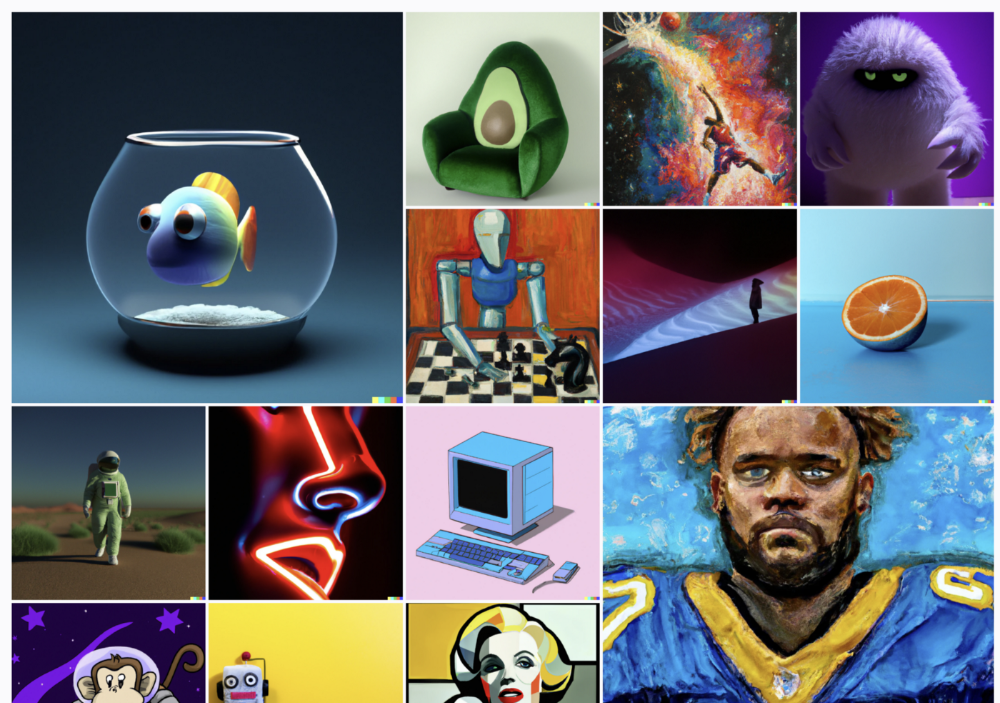
Dall-E2 by OpenAI
The AI art generator Dall-E2 is powerful. Since it’s still in beta, you can join the waitlist here.
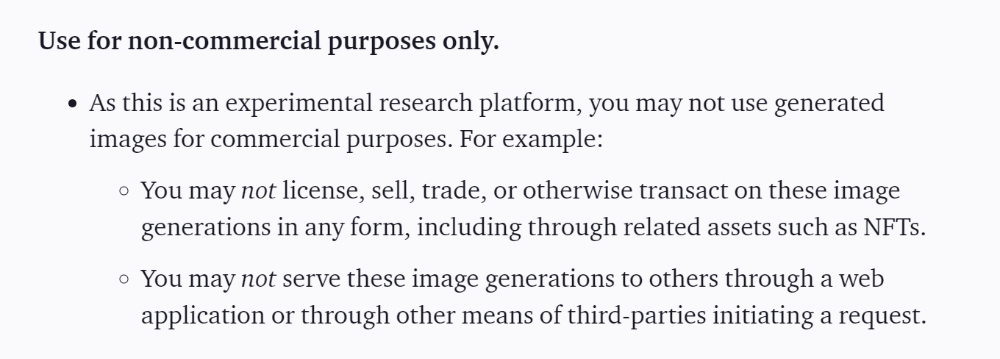
OpenAI DOES NOT allow the use and redistribution of any image for commercial purposes.
Here's the policy as of April 6, 2022.
Here are some images from Dall-E2’s webpage to show its art quality.
Several Reddit users reported receiving pricing surveys from OpenAI.
This suggests the company may bring out a subscription-based tier and a commercial license to sell images soon.
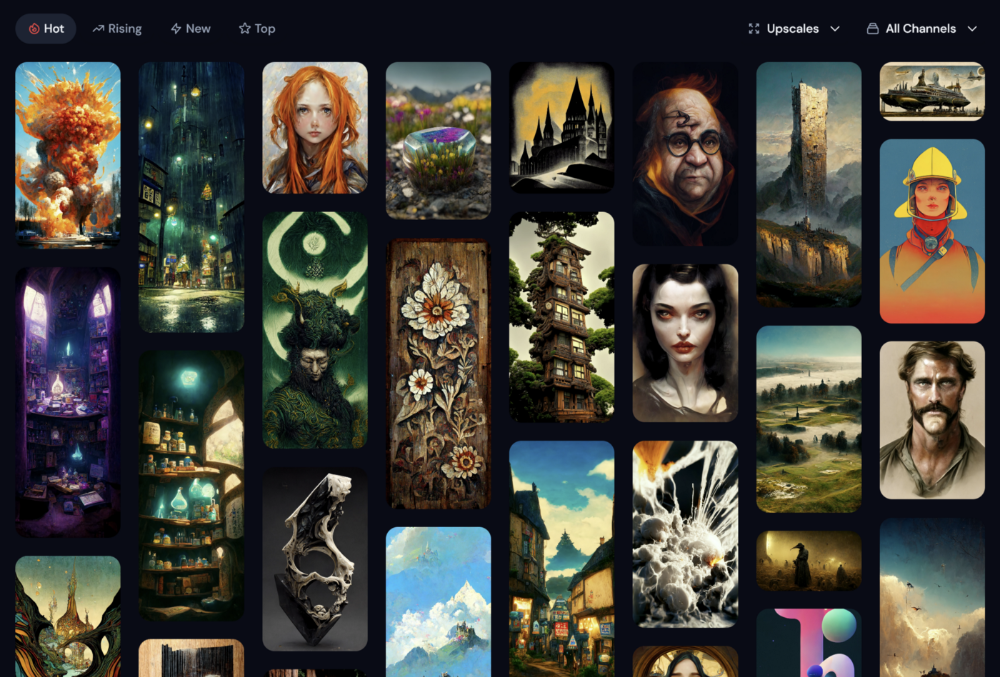
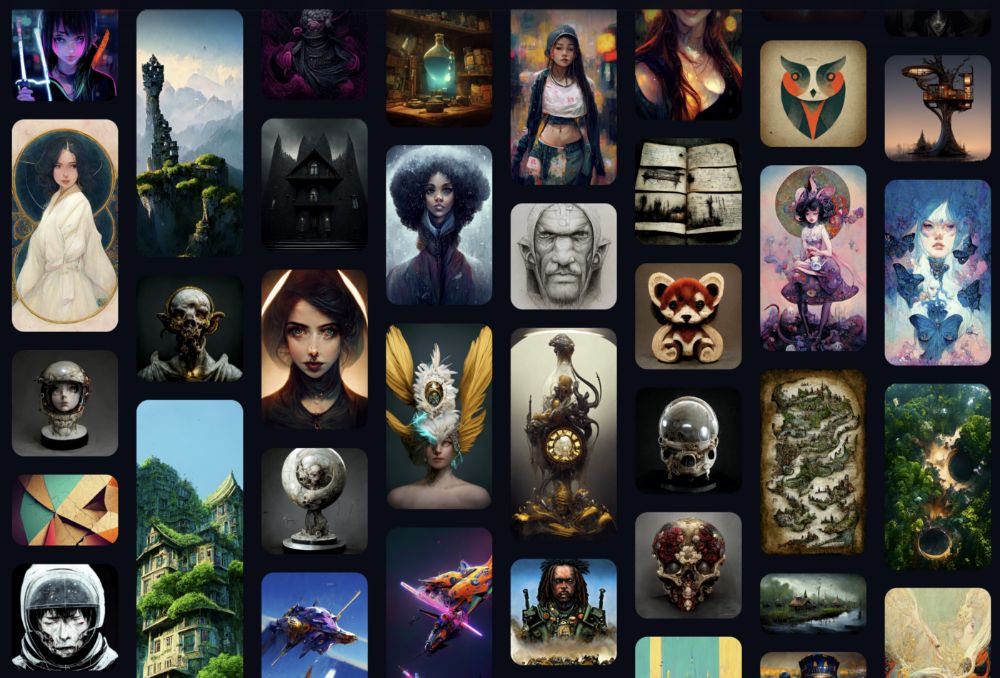
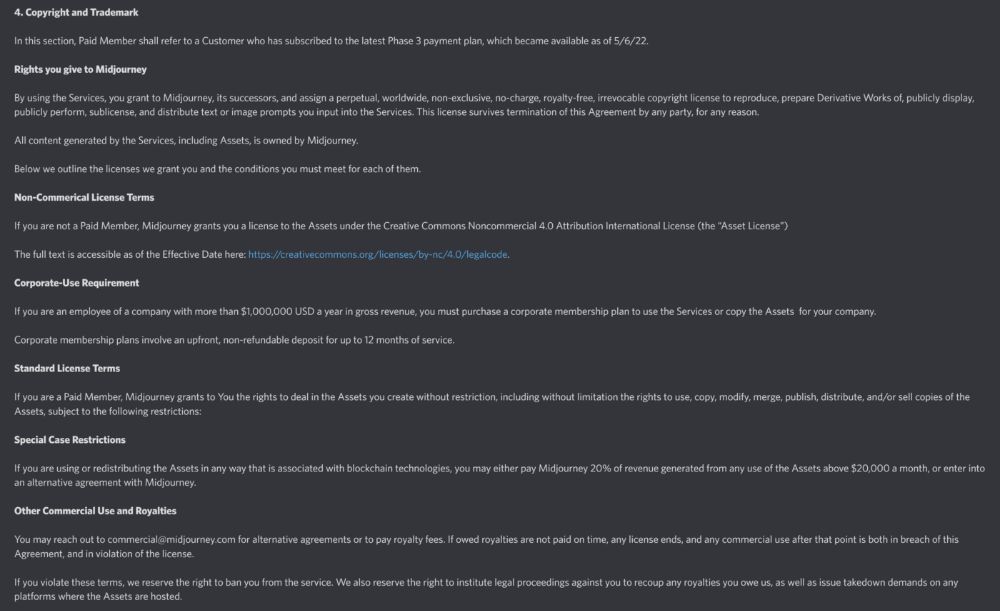
MidJourney
I like Midjourney's art generator. It makes great AI images. Here are some samples:
Standard Licenses are available for $10 per month.
Standard License allows you to use, copy, modify, merge, publish, distribute, and/or sell copies of the images, except for blockchain technologies.
If you utilize or distribute the Assets using blockchain technology, you must pay MidJourney 20% of revenue above $20,000 a month or engage in an alternative agreement.
Here's their copyright and trademark page.
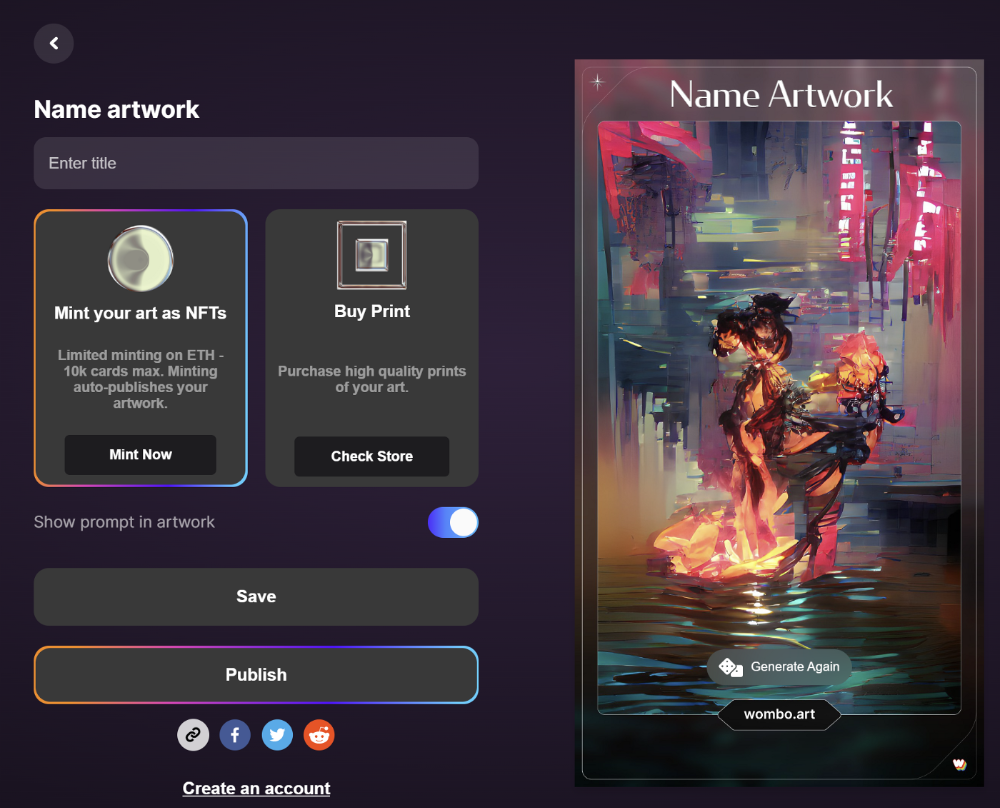
Dream by Wombo
Dream is one of the first public AI art generators.
This AI program is free, easy to use, and Wombo gives a royalty-free license to copy or share artworks.
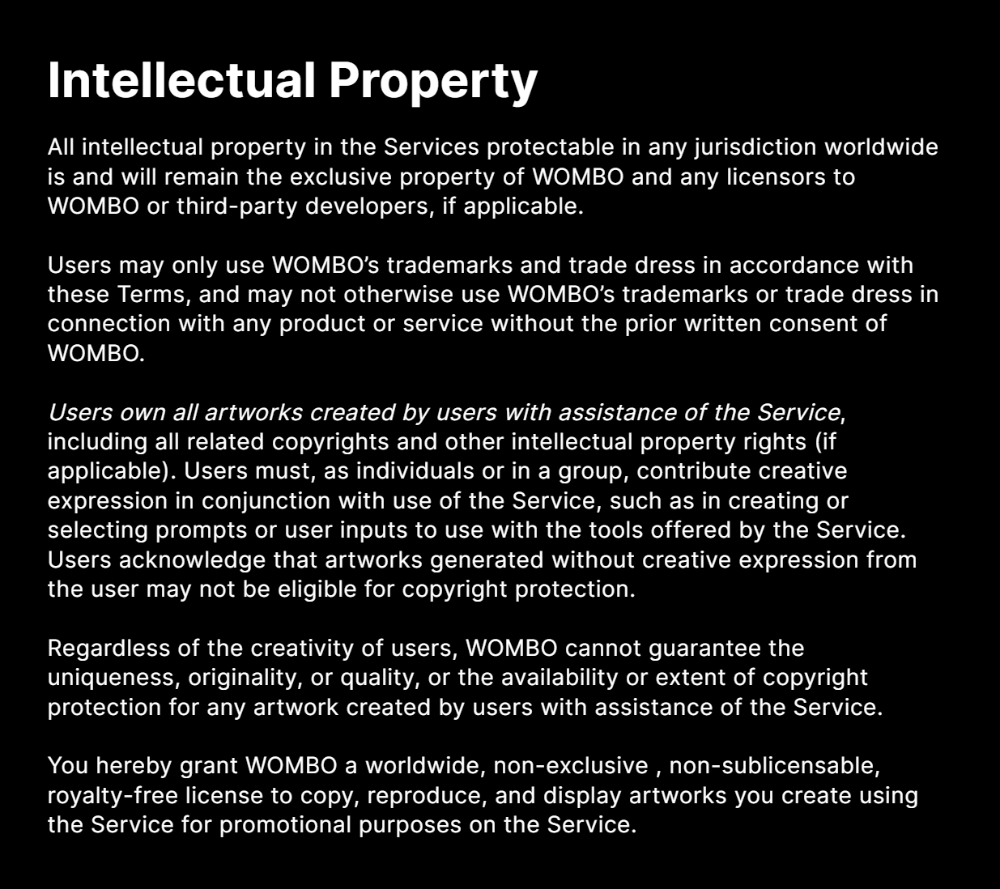
Users own all artworks generated by the tool. Including all related copyrights or intellectual property rights.
Here’s Wombos' intellectual property policy.
Final Reflections
AI is creating a new sort of art that's selling well. It’s becoming popular and valued, despite some skepticism.
Now that you know MidJourney and Wombo let you sell AI-generated art, you need to locate buyers. There are several ways to achieve this, but that’s for another story.

Yusuf Ibrahim
4 years ago
How to sell 10,000 NFTs on OpenSea for FREE (Puppeteer/NodeJS)
So you've finished your NFT collection and are ready to sell it. Except you can't figure out how to mint them! Not sure about smart contracts or want to avoid rising gas prices. You've tried and failed with apps like Mini mouse macro, and you're not familiar with Selenium/Python. Worry no more, NodeJS and Puppeteer have arrived!
Learn how to automatically post and sell all 1000 of my AI-generated word NFTs (Nakahana) on OpenSea for FREE!
My NFT project — Nakahana |
NOTE: Only NFTs on the Polygon blockchain can be sold for free; Ethereum requires an initiation charge. NFTs can still be bought with (wrapped) ETH.
If you want to go right into the code, here's the GitHub link: https://github.com/Yusu-f/nftuploader
Let's start with the knowledge and tools you'll need.
What you should know
You must be able to write and run simple NodeJS programs. You must also know how to utilize a Metamask wallet.
Tools needed
- NodeJS. You'll need NodeJs to run the script and NPM to install the dependencies.
- Puppeteer – Use Puppeteer to automate your browser and go to sleep while your computer works.
- Metamask – Create a crypto wallet and sign transactions using Metamask (free). You may learn how to utilize Metamask here.
- Chrome – Puppeteer supports Chrome.
Let's get started now!
Starting Out
Clone Github Repo to your local machine. Make sure that NodeJS, Chrome, and Metamask are all installed and working. Navigate to the project folder and execute npm install. This installs all requirements.
Replace the “extension path” variable with the Metamask chrome extension path. Read this tutorial to find the path.
Substitute an array containing your NFT names and metadata for the “arr” variable and the “collection_name” variable with your collection’s name.
Run the script.
After that, run node nftuploader.js.
Open a new chrome instance (not chromium) and Metamask in it. Import your Opensea wallet using your Secret Recovery Phrase or create a new one and link it. The script will be unable to continue after this but don’t worry, it’s all part of the plan.
Next steps
Open your terminal again and copy the route that starts with “ws”, e.g. “ws:/localhost:53634/devtools/browser/c07cb303-c84d-430d-af06-dd599cf2a94f”. Replace the path in the connect function of the nftuploader.js script.
const browser = await puppeteer.connect({ browserWSEndpoint: "ws://localhost:58533/devtools/browser/d09307b4-7a75-40f6-8dff-07a71bfff9b3", defaultViewport: null });
Rerun node nftuploader.js. A second tab should open in THE SAME chrome instance, navigating to your Opensea collection. Your NFTs should now start uploading one after the other! If any errors occur, the NFTs and errors are logged in an errors.log file.
Error Handling
The errors.log file should show the name of the NFTs and the error type. The script has been changed to allow you to simply check if an NFT has already been posted. Simply set the “searchBeforeUpload” setting to true.
We're done!
If you liked it, you can buy one of my NFTs! If you have any concerns or would need a feature added, please let me know.
Thank you to everyone who has read and liked. I never expected it to be so popular.