


More on Entrepreneurship/Creators

Esteban
3 years ago
The Berkus Startup Valuation Method: What Is It?
What Is That?
Berkus is a pre-revenue valuation method based exclusively on qualitative criteria, like Scorecard.
Few firms match their financial estimates, especially in the early stages, so valuation methodologies like the Berkus method are a good way to establish a valuation when the economic measures are not reliable.
How does it work?
This technique evaluates five key success factors.
Fundamental principle
Technology
Execution
Strategic alliances in its primary market
Production, followed by sales
The Berkus technique values the business idea and four success factors. As seen in the matrix below, each of these dimensions poses a danger to the startup's success.
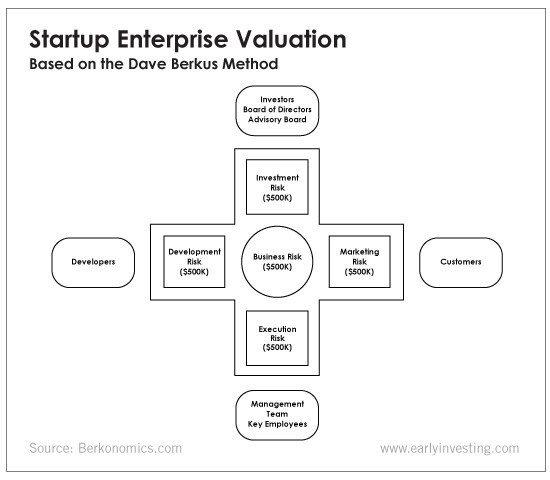
It assigns $0-$500,000 to each of these beginning regions. This approach enables a maximum $2.5M pre-money valuation.
This approach relies significantly on geography and uses the US as a baseline, as it differs in every country in Europe.
A set of standards for analyzing each dimension individually
Fundamental principle (or strength of the idea)
Ideas are worthless; execution matters. Most of us can relate to seeing a new business open in our area or a startup get funded and thinking, "I had this concept years ago!" Someone did it.
The concept remains. To assess the idea's viability, we must consider several criteria.
The concept's exclusivity It is necessary to protect a product or service's concept using patents and copyrights. Additionally, it must be capable of generating large profits.
Planned growth and growth that goes in a specific direction have a lot of potential, therefore incorporating them into a business is really advantageous.
The ability of a concept to grow A venture's ability to generate scalable revenue is a key factor in its emergence and continuation. A startup needs a scalable idea in order to compete successfully in the market.
The attraction of a business idea to a broad spectrum of people is significantly influenced by the current socio-political climate. Thus, the requirement for the assumption of conformity.
Concept Validation Ideas must go through rigorous testing with a variety of audiences in order to lower risk during the implementation phase.
Technology (Prototype)
This aspect reduces startup's technological risk. How good is the startup prototype when facing cyber threats, GDPR compliance (in Europe), tech stack replication difficulty, etc.?
Execution
Check the management team's efficacy. A potential angel investor must verify the founders' experience and track record with previous ventures. Good leadership is needed to chart a ship's course.
Strategic alliances in its primary market
Existing and new relationships will play a vital role in the development of both B2B and B2C startups. What are the startup's synergies? potential ones?
Production, followed by sales (product rollout)
Startup success depends on its manufacturing and product rollout. It depends on the overall addressable market, the startup's ability to market and sell their product, and their capacity to provide consistent, high-quality support.
Example
We're now founders of EyeCaramba, a machine vision-assisted streaming platform. My imagination always goes to poor puns when naming a startup.
Since we're first-time founders and the Berkus technique depends exclusively on qualitative methods and the evaluator's skill, we ask our angel-investor acquaintance for a pre-money appraisal of EyeCaramba.
Our friend offers us the following table:
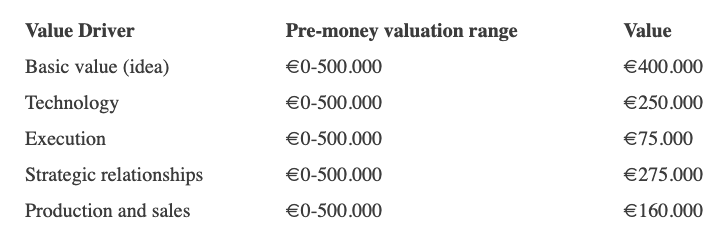
Because we're first-time founders, our pal lowered our Execution score. He knows the idea's value and that the gaming industry is red-hot, with worse startup ideas getting funded, therefore he gave the Basic value the highest value (idea).
EyeCaramba's pre-money valuation is $400,000 + $250,000 + $75,000 + $275,000 + $164,000 (1.16M). Good.
References
https://medium.com/humble-ventures/how-angel-investors-value-pre-revenue-startups-part-iii-8271405f0774#:~:text=pre%2Drevenue%20startups.-,Berkus%20Method,potential%20of%20the%20idea%20itself.%E2%80%9D
https://eqvista.com/berkus-valuation-method-for-startups/
https://www.venionaire.com/early-stage-startup-valuation-part-2-the-berkus-method/

Bernard Bado
3 years ago
Build This Before Someone Else Does!

Do you want to build and launch your own software company? To do this, all you need is a product that solves a problem.
Coming up with profitable ideas is not that easy. But you’re in luck because you got me!
I’ll give you the idea for free. All you need to do is execute it properly.
If you’re ready, let’s jump right into it! Starting with the problem.
Problem
Youtube has many creators. Every day, they think of new ways to entertain or inform us.
They work hard to make videos. Many of their efforts go to waste. They limit their revenue and reach.
Solution
Content repurposing solves this problem.
One video can become several TikToks. Creating YouTube videos from a podcast episode.
Or, one video might become a blog entry.
By turning videos into blog entries, Youtubers may develop evergreen SEO content, attract a new audience, and reach a non-YouTube audience.
Many YouTube creators want this easy feature.
Let's build it!
Implementation
We identified the problem, and we have a solution. All that’s left to do is see how it can be done.
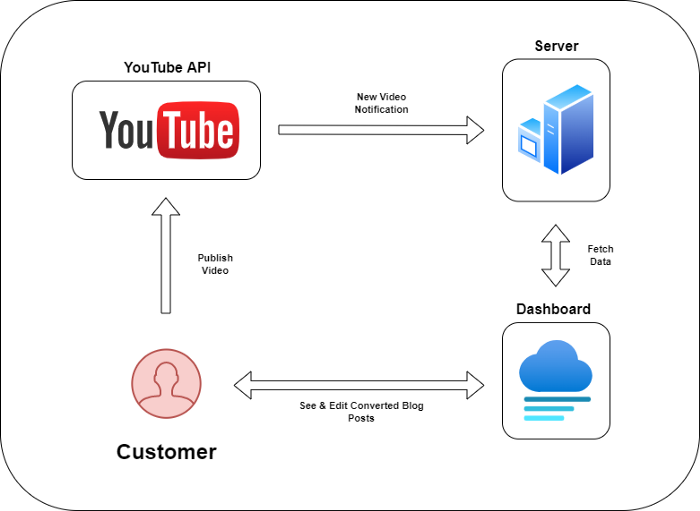
Monitoring new video uploads
First, watch when a friend uploads a new video. Everything should happen automatically without user input.
YouTube Webhooks make this easy. Our server listens for YouTube Webhook notifications.
After publishing a new video, we create a conversion job.
Creating a Blog Post from a Video
Next, turn a video into a blog article.
To convert, we must extract the video's audio (which can be achieved by using FFmpeg on the server).
Once we have the audio channel, we can use speech-to-text.
Services can accomplish this easily.
Speech-to-text on Google
Google Translate
Deepgram
Deepgram's affordability and integration make it my pick.
After conversion, the blog post needs formatting, error checking, and proofreading.
After this, a new blog post will appear in our web app's dashboard.
Completing a blog post
After conversion, users must examine and amend their blog posts.
Our application dashboard would handle all of this. It's a dashboard-style software where users can:
Link their Youtube account
Check out the converted videos in the future.
View the conversions that are ongoing.
Edit and format converted blog articles.
It's a web-based app.
It doesn't matter how it's made but I'd choose Next.js.
Next.js is a React front-end standard. Vercel serverless functions could conduct the conversions.
This would let me host the software for free and reduce server expenditures.
Taking It One Step Further
SaaS in a nutshell. Future improvements include integrating with WordPress or Ghost.
Our app users could then publish blog posts. Streamlining the procedure.
MVPs don't need this functionality.
Final Thoughts
Repurposing content helps you post more often, reach more people, and develop faster.
Many agencies charge a fortune for this service. Handmade means pricey.
Content creators will go crazy if you automate and cheaply solve this problem.
Just execute this idea!

Carter Kilmann
3 years ago
I finally achieved a $100K freelance income. Here's what I wish I knew.

We love round numbers, don't we? $100,000 is a frequent freelancing milestone. You feel like six figures means you're doing something properly.
You've most likely already conquered initial freelancing challenges like finding clients, setting fair pricing, coping with criticism, getting through dry spells, managing funds, etc.
You think I must be doing well. Last month, my freelance income topped $100,000.
That may not sound impressive considering I've been freelancing for 2.75 years, but I made 30% of that in the previous four months, which is crazy.
Here are the things I wish I'd known during the early days of self-employment that would have helped me hit $100,000 faster.
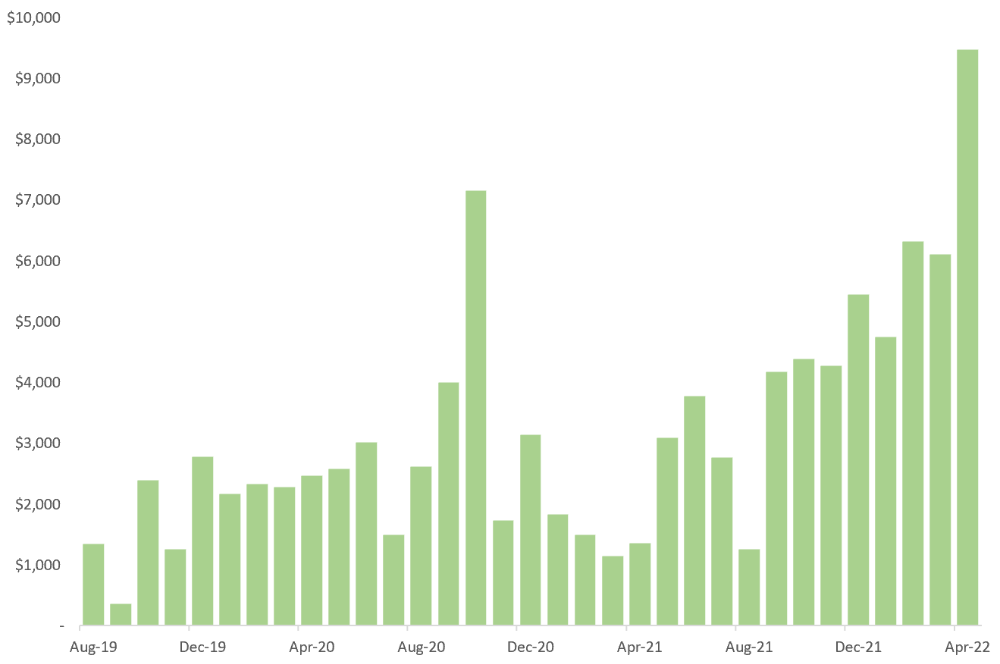
1. The Volatility of Freelancing Will Stabilize.
Freelancing is risky. No surprise.
Here's an example.
October 2020 was my best month, earning $7,150. Between $4,004 in September and $1,730 in November. Unsteady.
Freelancing is regrettably like that. Moving clients. Content requirements change. Allocating so much time to personal pursuits wasn't smart, but yet.
Stabilizing income takes time. Consider my rolling three-month average income since I started freelancing. My three-month average monthly income. In February, this metric topped $5,000. Now, it's in the mid-$7,000s, but it took a while to get there.
Finding freelance gigs that provide high pay, high volume, and recurring revenue is difficult. But it's not impossible.
TLDR: Don't expect a steady income increase at first. Be patient.
2. You Have More Value Than You Realize.
Writing is difficult. Assembling words, communicating a message, and provoking action are a puzzle.
People are willing to pay you for it because they can't do what you do or don't have enough time.
Keeping that in mind can have huge commercial repercussions.
When talking to clients, don't tiptoe. You can ignore ridiculous deadlines. You don't have to take unmanageable work.
You solve an issue, so make sure you get rightly paid.
TLDR: Frame services as problem-solutions. This will let you charge more and set boundaries.
3. Increase Your Prices.
I studied hard before freelancing. I read articles and watched videos about writing businesses.
I didn't want to work for pennies. Despite this clarity, I had no real strategy to raise my rates.
I then luckily stumbled into higher-paying work. We discussed fees and hours with a friend who launched a consulting business. It's subjective and speculative because value isn't standardized. One company may laugh at your charges. If your solution helps them create a solid ROI, another client may pay $200 per hour.
When he told me he charged his first client $125 per hour, I thought, Why not?
A new-ish client wanted to discuss a huge forthcoming project, so I raised my rates. They knew my worth, so they didn't blink when I handed them my new number.
TLDR: Increase rates periodically (e.g., every 6 or 12 months). Writing skill develops with practice. You'll gain value over time.
4. Remember Your Limits.
If you can squeeze additional time into a day, let me know. I can't manipulate time yet.
We all have time and economic limits. You could theoretically keep boosting rates, but your prospect pool diminishes. Outsourcing and establishing extra revenue sources might boost monthly revenues.
I've devoted a lot of time to side projects (hopefully extra cash sources), but I've only just started outsourcing. I wish I'd tried this earlier.
If you can discover good freelancers, you can grow your firm without sacrificing time.
TLDR: Expand your writing network immediately. You'll meet freelancers who understand your daily grind and locate reference sources.
5. Every Action You Take Involves an Investment. Be Certain to Select Correctly.
Investing in stocks or crypto requires paying money, right?
In business, time is your currency (and maybe money too). Your daily habits define your future. If you spend time collecting software customers and compiling content in the space, you'll end up with both. So be sure.
I only spend around 50% of my time on client work, therefore it's taken me nearly three years to earn $100,000. I spend the remainder of my time on personal projects including a freelance book, an investment newsletter, and this blog.
Why? I don't want to rely on client work forever. So, I'm working on projects that could pay off later and help me live a more fulfilling life.
TLDR: Consider the long-term impact of your time commitments, and don't overextend. You can only make so many "investments" in a given time.
6. LinkedIn Is an Endless Mine of Gold. Use It.
Why didn't I use LinkedIn earlier?
I designed a LinkedIn inbound lead strategy that generates 12 leads a month and a few high-quality offers. As a result, I've turned down good gigs. Wish I'd begun earlier.
If you want to create a freelance business, prioritize LinkedIn. Too many freelancers ignore this site, missing out on high-paying clients. Build your profile, post often, and interact.
TLDR: Study LinkedIn's top creators. Once you understand their audiences, start posting and participating daily.
For 99% of People, Freelancing is Not a Get-Rich-Quick Scheme.
Here's a list of things I wish I'd known when I started freelancing.
Although it is erratic, freelancing eventually becomes stable.
You deserve respect and discretion over how you conduct business because you have solved an issue.
Increase your charges rather than undervaluing yourself. If necessary, add a reminder to your calendar. Your worth grows with time.
In order to grow your firm, outsource jobs. After that, you can work on the things that are most important to you.
Take into account how your present time commitments may affect the future. It will assist in putting things into perspective and determining whether what you are doing is indeed worthwhile.
Participate on LinkedIn. You'll get better jobs as a result.
If I could give my old self (and other freelancers) one bit of advice, it's this:
Despite appearances, you're making progress.
Each job. Tweets. Newsletters. Progress. It's simpler to see retroactively than in the moment.
Consistent, intentional work pays off. No good comes from doing nothing. You must set goals, divide them into time-based targets, and then optimize your calendar.
Then you'll understand you're doing well.
Want to learn more? I’ll teach you.
You might also like

The Mystique
3 years ago
Four Shocking Dark Web Incidents that Should Make You Avoid It
Dark Web activity? Is it as horrible as they say?

We peruse our phones for hours. Internet has improved our worldview.
However, the world's harshest realities remain buried on the internet and unattainable by everyone.
Browsers cannot access the Dark Web. Browse it with high-security authentication and exclusive access. There are compelling reasons to avoid the dark web at all costs.
1. The Dark Web and I

Darius wrote My Dark Web Story on reddit two years ago. The user claimed to have shared his dark web experience. DaRealEddyYT wanted to surf the dark web after hearing several stories.
He curiously downloaded Tor Browser, which provides anonymity and security.
In the Dark Room, bound
As Darius logged in, a text popped up: “Want a surprise? Click on this link.”
The link opened to a room with a chair. Only one light source illuminated the room. The chair held a female tied.
As the screen read "Let the game begin," a man entered the room and was paid in bitcoins to torment the girl.
The man dragged and tortured the woman.
A danger to safety
Leaving so soon, Darius, disgusted Darius tried to leave the stream. The anonymous user then sent Darius his personal information, including his address, which frightened him because he didn't know Tor was insecure.
After deleting the app, his phone camera was compromised.
He also stated that he left his residence and returned to find it unlocked and a letter saying, Thought we wouldn't find you? Reddit never updated the story.
The story may have been a fake, but a much scarier true story about the dark side of the internet exists.
2. The Silk Road Market

The dark web is restricted for a reason. The dark web has everything illicit imaginable. It's awful central.
The dark web has everything, from organ sales to drug trafficking to money laundering to human trafficking. Illegal drugs, pirated software, credit card, bank, and personal information can be found in seconds.
The dark web has reserved websites like Google. The Silk Road Website, which operated from 2011 to 2013, was a leading digital black market.
The FBI grew obsessed with site founder and processor Ross William Ulbricht.
The site became a criminal organization as money laundering and black enterprises increased. Bitcoin was utilized for credit card payment.
The FBI was close to arresting the site's administrator. Ross was detained after the agency closed Silk Road in 2013.
Two years later, in 2015, he was convicted and sentenced to two consecutive life terms and forty years. He appealed in 2016 but was denied, thus he is currently serving time.
The hefty sentence was for more than running a black marketing site. He was also convicted of murder-for-hire, earning about $730,000 in a short time.
3. Person-buying auctions

Bidding on individuals is another weird internet activity. After a Milan photo shoot, 20-year-old British model Chloe Ayling was kidnapped.
An ad agency in Milan made a bogus offer to shoot with the mother of a two-year-old boy. Four men gave her anesthetic and put her in a duffel bag when she arrived.
She was held captive for several days, and her images and $300,000 price were posted on the dark web. Black Death Trafficking Group kidnapped her to sell her for sex.
She was told two black death foot warriors abducted her. The captors released her when they found she was a mother because mothers were less desirable to sex slave buyers.
In July 2018, Lukasz Pawel Herba was arrested and sentenced to 16 years and nine months in prison. Being a young mother saved Chloe from creepy bidding.
However, it exceeds expectations of how many more would be in such danger daily without their knowledge.
4. Organ sales

Many are unaware of dark web organ sales. Patients who cannot acquire organs often turn to dark web brokers.
Brokers handle all transactions between donors and customers.
Bitcoins are used for dark web transactions, and the Tor server permits personal data on the web.
The WHO reports approximately 10,000 unlawful organ transplants annually. The black web sells kidneys, hearts, even eyes.
To protect our lives and privacy, we should manage our curiosity and never look up dangerous stuff.
While it's fascinating and appealing to know what's going on in the world we don't know about, it's best to prioritize our well-being because one never knows how bad it might get.
Sources

Ari Joury, PhD
3 years ago
7 ways to turn into a major problem-solver

For some people, the glass is half empty. For others, it’s half full. And for some, the question is, How do I get this glass totally full again?
Problem-solvers are the last group. They're neutral. Pragmatists.
Problems surround them. They fix things instead of judging them. Problem-solvers improve the world wherever they go.
Some fail. Sometimes their good intentions have terrible results. Like when they try to help a grandma cross the road because she can't do it alone but discover she never wanted to.
Most programmers, software engineers, and data scientists solve problems. They use computer code to fix problems they see.
Coding is best done by understanding and solving the problem.
Despite your best intentions, building the wrong solution may have negative consequences. Helping an unwilling grandma cross the road.
How can you improve problem-solving?
1. Examine your presumptions.
Don’t think There’s a grandma, and she’s unable to cross the road. Therefore I must help her over the road. Instead think This grandma looks unable to cross the road. Let’s ask her whether she needs my help to cross it.
Maybe the grandma can’t cross the road alone, but maybe she can. You can’t tell for sure just by looking at her. It’s better to ask.
Maybe the grandma wants to cross the road. But maybe she doesn’t. It’s better to ask!
Building software is similar. Do only I find this website ugly? Who can I consult?
We all have biases, mental shortcuts, and worldviews. They simplify life.
Problem-solving requires questioning all assumptions. They might be wrong!
Think less. Ask more.
Secondly, fully comprehend the issue.
Grandma wants to cross the road? Does she want flowers from the shop across the street?
Understanding the problem advances us two steps. Instead of just watching people and their challenges, try to read their intentions.
Don't ask, How can I help grandma cross the road? Why would this grandma cross the road? What's her goal?
Understand what people want before proposing solutions.
3. Request more information. This is not a scam!
People think great problem solvers solve problems immediately. False!
Problem-solvers study problems. Understanding the problem makes solving it easy.
When you see a grandma struggling to cross the road, you want to grab her elbow and pull her over. However, a good problem solver would ask grandma what she wants. So:
Problem solver: Excuse me, ma’am? Do you wish to get over the road? Grandma: Yes indeed, young man! Thanks for asking. Problem solver: What do you want to do on the other side? Grandma: I want to buy a bouquet of flowers for my dear husband. He loves flowers! I wish the shop wasn’t across this busy road… Problem solver: Which flowers does your husband like best? Grandma: He loves red dahlia. I usually buy about 20 of them. They look so pretty in his vase at the window! Problem solver: I can get those dahlia for you quickly. Go sit on the bench over here while you’re waiting; I’ll be back in five minutes. Grandma: You would do that for me? What a generous young man you are!
A mediocre problem solver would have helped the grandma cross the road, but he might have forgotten that she needs to cross again. She must watch out for cars and protect her flowers on the way back.
A good problem solver realizes that grandma's husband wants 20 red dahlias and completes the task.
4- Rapid and intense brainstorming
Understanding a problem makes solutions easy. However, you may not have all the information needed to solve the problem.
Additionally, retrieving crucial information can be difficult.
You could start a blog. You don't know your readers' interests. You can't ask readers because you don't know who they are.
Brainstorming works here. Set a stopwatch (most smartphones have one) to ring after five minutes. In the remaining time, write down as many topics as possible.
No answer is wrong. Note everything.
Sort these topics later. Programming or data science? What might readers scroll past—are these your socks this morning?
Rank your ideas intuitively and logically. Write Medium stories using the top 35 ideas.
5 - Google it.
Doctor Google may answer this seemingly insignificant question. If you understand your problem, try googling or binging.
Someone has probably had your problem before. The problem-solver may have posted their solution online.
Use others' experiences. If you're social, ask a friend or coworker for help.
6 - Consider it later
Rest your brain.
Reread. Your brain needs rest to function.
Hustle culture encourages working 24/7. It doesn't take a neuroscientist to see that this is mental torture.
Leave an unsolvable problem. Visit friends, take a hot shower, or do whatever you enjoy outside of problem-solving.
Nap.
I get my best ideas in the morning after working on a problem. I couldn't have had these ideas last night.
Sleeping subconsciously. Leave it alone and you may be surprised by the genius it produces.
7 - Learn to live with frustration
There are problems that you’ll never solve.
Mathematicians are world-class problem-solvers. The brightest minds in history have failed to solve many mathematical problems.
A Gordian knot problem can frustrate you. You're smart!
Frustration-haters don't solve problems well. They choose simple problems to avoid frustration.
No. Great problem solvers want to solve a problem but know when to give up.
Frustration initially hurts. You adapt.
Famous last words
If you read this article, you probably solve problems. We've covered many ways to improve, so here's a summary:
Test your presumptions. Is the issue the same for everyone else when you see one? Or are your prejudices and self-judgments misguiding you?
Recognize the issue completely. On the surface, a problem may seem straightforward, but what's really going on? Try to see what the current situation might be building up to by thinking two steps ahead of the current situation.
Request more information. You are no longer a high school student. A two-sentence problem statement is not sufficient to provide a solution. Ask away if you need more details!
Think quickly and thoroughly. In a constrained amount of time, try to write down all your thoughts. All concepts are worthwhile! Later, you can order them.
Google it. There is a purpose for the internet. Use it.
Consider it later at night. A rested mind is more creative. It might seem counterintuitive to leave a problem unresolved. But while you're sleeping, your subconscious will handle the laborious tasks.
Accept annoyance as a normal part of life. Don't give up if you're feeling frustrated. It's a step in the procedure. It's also perfectly acceptable to give up on a problem because there are other, more pressing issues that need to be addressed.
You might feel stupid sometimes, but that just shows that you’re human. You care about the world and you want to make it better.
At the end of the day, that’s all there is to problem solving — making the world a little bit better.

Nitin Sharma
3 years ago
Web3 Terminology You Should Know
The easiest online explanation.

Web3 is growing. Crypto companies are growing.
Instagram, Adidas, and Stripe adopted cryptocurrency.

Bitcoin and other cryptocurrencies made web3 famous.
Most don't know where to start. Cryptocurrency, DeFi, etc. are investments.
Since we don't understand web3, I'll help you today.
Let’s go.
1. Web3
It is the third generation of the web, and it is built on the decentralization idea which means no one can control it.
There are static webpages that we can only read on the first generation of the web (i.e. Web 1.0).
Web 2.0 websites are interactive. Twitter, Medium, and YouTube.
Each generation controlled the website owner. Simply put, the owner can block us. However, data breaches and selling user data to other companies are issues.
They can influence the audience's mind since they have control.
Assume Twitter's CEO endorses Donald Trump. Result? Twitter would have promoted Donald Trump with tweets and graphics, enhancing his chances of winning.
We need a decentralized, uncontrollable system.
And then there’s Web3.0 to consider. As Bitcoin and Ethereum values climb, so has its popularity. Web3.0 is uncontrolled web evolution. It's good and bad.
Dapps, DeFi, and DAOs are here. It'll all be explained afterwards.
2. Cryptocurrencies:
No need to elaborate.
Bitcoin, Ethereum, Cardano, and Dogecoin are cryptocurrencies. It's digital money used for payments and other uses.
Programs must interact with cryptocurrencies.
3. Blockchain:
Blockchain facilitates bitcoin transactions, investments, and earnings.
This technology governs Web3. It underpins the web3 environment.
Let us delve much deeper.
Blockchain is simple. However, the name expresses the meaning.
Blockchain is a chain of blocks.
Let's use an image if you don't understand.
The graphic above explains blockchain. Think Blockchain. The block stores related data.
Here's more.
4. Smart contracts
Programmers and developers must write programs. Smart contracts are these blockchain apps.
That’s reasonable.
Decentralized web3.0 requires immutable smart contracts or programs.
5. NFTs
Blockchain art is NFT. Non-Fungible Tokens.
Explaining Non-Fungible Token may help.
Two sorts of tokens:
These tokens are fungible, meaning they can be changed. Think of Bitcoin or cash. The token won't change if you sell one Bitcoin and acquire another.
Non-Fungible Token: Since these tokens cannot be exchanged, they are exclusive. For instance, music, painting, and so forth.
Right now, Companies and even individuals are currently developing worthless NFTs.
The concept of NFTs is much improved when properly handled.
6. Dapp
Decentralized apps are Dapps. Instagram, Twitter, and Medium apps in the same way that there is a lot of decentralized blockchain app.
Curve, Yearn Finance, OpenSea, Axie Infinity, etc. are dapps.
7. DAOs
DAOs are member-owned and governed.
Consider it a company with a core group of contributors.
8. DeFi
We all utilize centrally regulated financial services. We fund these banks.
If you have $10,000 in your bank account, the bank can invest it and retain the majority of the profits.
We only get a penny back. Some banks offer poor returns. To secure a loan, we must trust the bank, divulge our information, and fill out lots of paperwork.
DeFi was built for such issues.
Decentralized banks are uncontrolled. Staking, liquidity, yield farming, and more can earn you money.
Web3 beginners should start with these resources.