

More on Science

Will Lockett
3 years ago
The Unlocking Of The Ultimate Clean Energy
The company seeking 24/7 ultra-powerful solar electricity.
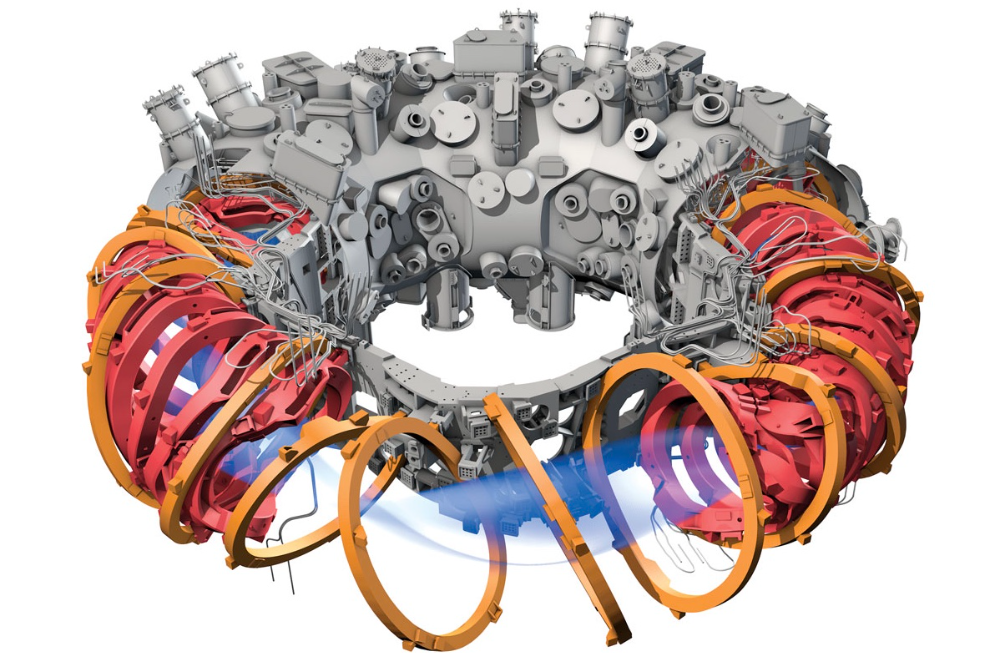
We're rushing to adopt low-carbon energy to prevent a self-made doomsday. We're using solar, wind, and wave energy. These low-carbon sources aren't perfect. They consume large areas of land, causing habitat loss. They don't produce power reliably, necessitating large grid-level batteries, an environmental nightmare. We can and must do better than fossil fuels. Longi, one of the world's top solar panel producers, is creating a low-carbon energy source. Solar-powered spacecraft. But how does it work? Why is it so environmentally harmonious? And how can Longi unlock it?
Space-based solar makes sense. Satellites above Medium Earth Orbit (MEO) enjoy 24/7 daylight. Outer space has no atmosphere or ozone layer to block the Sun's high-energy UV radiation. Solar panels can create more energy in space than on Earth due to these two factors. Solar panels in orbit can create 40 times more power than those on Earth, according to estimates.
How can we utilize this immense power? Launch a geostationary satellite with solar panels, then beam power to Earth. Such a technology could be our most eco-friendly energy source. (Better than fusion power!) How?
Solar panels create more energy in space, as I've said. Solar panel manufacture and grid batteries emit the most carbon. This indicates that a space-solar farm's carbon footprint (which doesn't need a battery because it's a constant power source) might be over 40 times smaller than a terrestrial one. Combine that with carbon-neutral launch vehicles like Starship, and you have a low-carbon power source. Solar power has one of the lowest emissions per kWh at 6g/kWh, so space-based solar could approach net-zero emissions.
Space solar is versatile because it doesn't require enormous infrastructure. A space-solar farm could power New York and Dallas with the same efficiency, without cables. The satellite will transmit power to a nearby terminal. This allows an energy system to evolve and adapt as the society it powers changes. Building and maintaining infrastructure can be carbon-intensive, thus less infrastructure means less emissions.
Space-based solar doesn't destroy habitats, either. Solar and wind power can be engineered to reduce habitat loss, but they still harm ecosystems, which must be restored. Space solar requires almost no land, therefore it's easier on Mother Nature.
Space solar power could be the ultimate energy source. So why haven’t we done it yet?
Well, for two reasons: the cost of launch and the efficiency of wireless energy transmission.
Advances in rocket construction and reusable rocket technology have lowered orbital launch costs. In the early 2000s, the Space Shuttle cost $60,000 per kg launched into LEO, but a SpaceX Falcon 9 costs only $3,205. 95% drop! Even at these low prices, launching a space-based solar farm is commercially questionable.
Energy transmission efficiency is half of its commercial viability. Space-based solar farms must be in geostationary orbit to get 24/7 daylight, 22,300 miles above Earth's surface. It's a long way to wirelessly transmit energy. Most laser and microwave systems are below 20% efficient.
Space-based solar power is uneconomical due to low efficiency and high deployment costs.
Longi wants to create this ultimate power. But how?
They'll send solar panels into space to develop space-based solar power that can be beamed to Earth. This mission will help them design solar panels tough enough for space while remaining efficient.
Longi is a Chinese company, and China's space program and universities are developing space-based solar power and seeking commercial partners. Xidian University has built a 98%-efficient microwave-based wireless energy transmission system for space-based solar power. The Long March 5B is China's super-cheap (but not carbon-offset) launch vehicle.
Longi fills the gap. They have the commercial know-how and ability to build solar satellites and terrestrial terminals at scale. Universities and the Chinese government have transmission technology and low-cost launch vehicles to launch this technology.
It may take a decade to develop and refine this energy solution. This could spark a clean energy revolution. Once operational, Longi and the Chinese government could offer the world a flexible, environmentally friendly, rapidly deployable energy source.
Should the world adopt this technology and let China control its energy? I'm not very political, so you decide. This seems to be the beginning of tapping into this planet-saving energy source. Forget fusion reactors. Carbon-neutral energy is coming soon.
Katherine Kornei
3 years ago
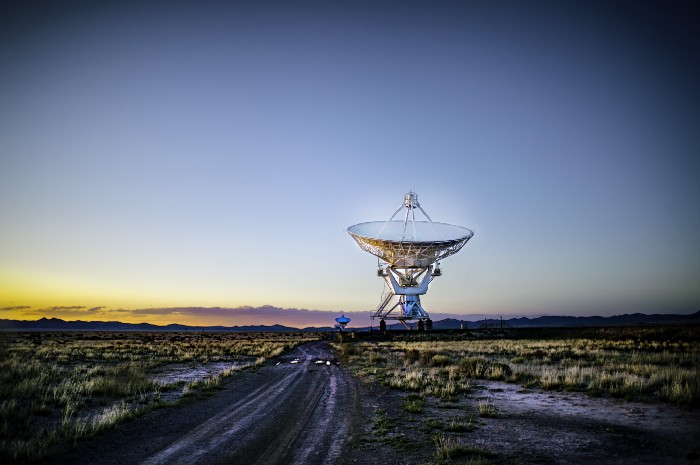
The InSight lander from NASA has recorded the greatest tremor ever felt on Mars.
The magnitude 5 earthquake was responsible for the discharge of energy that was 10 times greater than the previous record holder.
Any Martians who happen to be reading this should quickly learn how to duck and cover.
NASA's Jet Propulsion Laboratory in Pasadena, California, reported that on May 4, the planet Mars was shaken by an earthquake of around magnitude 5, making it the greatest Marsquake ever detected to this point. The shaking persisted for more than six hours and unleashed more than ten times as much energy as the earthquake that had previously held the record for strongest.
The event was captured on record by the InSight lander, which is operated by the United States Space Agency and has been researching the innards of Mars ever since it touched down on the planet in 2018 (SN: 11/26/18). The epicenter of the earthquake was probably located in the vicinity of Cerberus Fossae, which is located more than 1,000 kilometers away from the lander.
The surface of Cerberus Fossae is notorious for being broken up and experiencing periodic rockfalls. According to geophysicist Philippe Lognonné, who is the lead investigator of the Seismic Experiment for Interior Structure, the seismometer that is onboard the InSight lander, it is reasonable to assume that the ground is moving in that area. "This is an old crater from a volcanic eruption."
Marsquakes, which are similar to earthquakes in that they give information about the interior structure of our planet, can be utilized to investigate what lies beneath the surface of Mars (SN: 7/22/21). And according to Lognonné, who works at the Institut de Physique du Globe in Paris, there is a great deal that can be gleaned from analyzing this massive earthquake. Because the quality of the signal is so high, we will be able to focus on the specifics.

Sara_Mednick
3 years ago
Since I'm a scientist, I oppose biohacking
Understanding your own energy depletion and restoration is how to truly optimize
Hack has meant many bad things for centuries. In the 1800s, a hack was a meager horse used to transport goods.
Modern usage describes a butcher or ax murderer's cleaver chop. The 1980s programming boom distinguished elegant code from "hacks". Both got you to your goal, but the latter made any programmer cringe and mutter about changing the code. From this emerged the hacker trope, the friendless anti-villain living in a murky hovel lit by the computer monitor, eating junk food and breaking into databases to highlight security system failures or steal hotdog money.
Now, start-a-billion-dollar-business-from-your-garage types have shifted their sights from app development to DIY biology, coining the term "bio-hack". This is a required keyword and meta tag for every fitness-related podcast, book, conference, app, or device.
Bio-hacking involves bypassing your body and mind's security systems to achieve a goal. Many biohackers' initial goals were reasonable, like lowering blood pressure and weight. Encouraged by their own progress, self-determination, and seemingly exquisite control of their biology, they aimed to outsmart aging and death to live 180 to 1000 years (summarized well in this vox.com article).
With this grandiose north star, the hunt for novel supplements and genetic engineering began.
Companies selling do-it-yourself biological manipulations cite lab studies in mice as proof of their safety and success in reversing age-related diseases or promoting longevity in humans (the goal changes depending on whether a company is talking to the federal government or private donors).
The FDA is slower than science, they say. Why not alter your biochemistry by buying pills online, editing your DNA with a CRISPR kit, or using a sauna delivered to your home? How about a microchip or electrical stimulator?
What could go wrong?
I'm not the neo-police, making citizen's arrests every time someone introduces a new plumbing gadget or extrapolates from animal research on resveratrol or catechins that we should drink more red wine or eat more chocolate. As a scientist who's spent her career asking, "Can we get better?" I've come to view bio-hacking as misguided, profit-driven, and counterproductive to its followers' goals.
We're creatures of nature. Despite all the new gadgets and bio-hacks, we still use Roman plumbing technology, and the best way to stay fit, sharp, and happy is to follow a recipe passed down since the beginning of time. Bacteria, plants, and all natural beings are rhythmic, with alternating periods of high activity and dormancy, whether measured in seconds, hours, days, or seasons. Nature repeats successful patterns.
During the Upstate, every cell in your body is naturally primed and pumped full of glycogen and ATP (your cells' energy currencies), as well as cortisol, which supports your muscles, heart, metabolism, cognitive prowess, emotional regulation, and general "get 'er done" attitude. This big energy release depletes your batteries and requires the Downstate, when your subsystems recharge at the cellular level.
Downstates are when you give your heart a break from pumping nutrient-rich blood through your body; when you give your metabolism a break from inflammation, oxidative stress, and sympathetic arousal caused by eating fast food — or just eating too fast; or when you give your mind a chance to wander, think bigger thoughts, and come up with new creative solutions. When you're responding to notifications, emails, and fires, you can't relax.
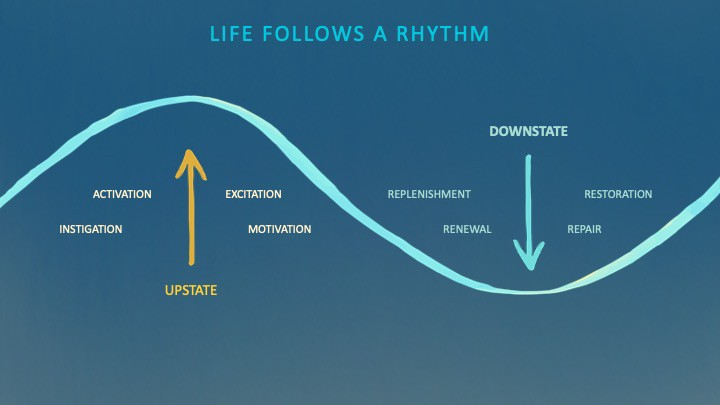
Downstates aren't just for consistently recharging your battery. By spending time in the Downstate, your body and brain get extra energy and nutrients, allowing you to grow smarter, faster, stronger, and more self-regulated. This state supports half-marathon training, exam prep, and mediation. As we age, spending more time in the Downstate is key to mental and physical health, well-being, and longevity.
When you prioritize energy-demanding activities during Upstate periods and energy-replenishing activities during Downstate periods, all your subsystems, including cardiovascular, metabolic, muscular, cognitive, and emotional, hum along at their optimal settings. When you synchronize the Upstates and Downstates of these individual rhythms, their functioning improves. A hard workout causes autonomic stress, which triggers Downstate recovery.
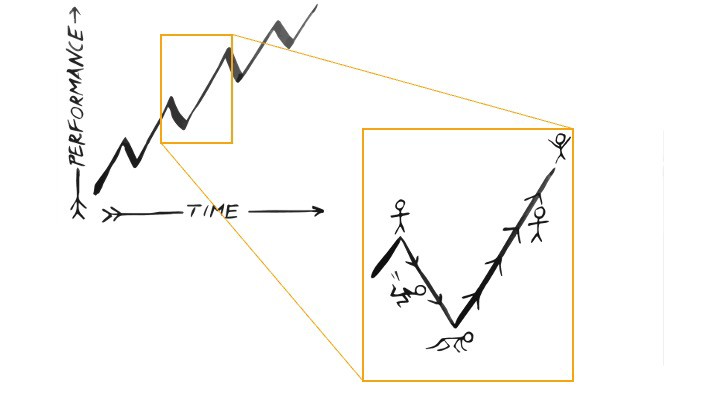
By choosing the right timing and type of exercise during the day, you can ensure a deeper recovery and greater readiness for the next workout by working with your natural rhythms and strengthening your autonomic and sleep Downstates.
Morning cardio workouts increase deep sleep compared to afternoon workouts. Timing and type of meals determine when your sleep hormone melatonin is released, ushering in sleep.
Rhythm isn't a hack. It's not a way to cheat the system or the boss. Nature has honed its optimization wisdom over trillions of days and nights. Stop looking for quick fixes. You're a whole system made of smaller subsystems that must work together to function well. No one pill or subsystem will make it all work. Understanding and coordinating your rhythms is free, easy, and only benefits you.
Dr. Sara C. Mednick is a cognitive neuroscientist at UC Irvine and author of The Power of the Downstate (HachetteGO)
You might also like

Rajesh Gupta
3 years ago
Why Is It So Difficult to Give Up Smoking?
I started smoking in 2002 at IIT BHU. Most of us thought it was enjoyable at first. I didn't realize the cost later.
In 2005, during my final semester, I lost my father. Suddenly, I felt more accountable for my mother and myself.
I quit before starting my first job in Bangalore. I didn't see any smoking friends in my hometown for 2 months before moving to Bangalore.
For the next 5-6 years, I had no regimen and smoked only when drinking.
Due to personal concerns, I started smoking again after my 2011 marriage. Now smoking was a constant guilty pleasure.
I smoked 3-4 cigarettes a day, but never in front of my family or on weekends. I used to excuse this with pride! First office ritual: smoking. Even with guilt, I couldn't stop this time because of personal concerns.
After 8-9 years, in mid 2019, a personal development program solved all my problems. I felt complete in myself. After this, I just needed one cigarette each day.
The hardest thing was leaving this final cigarette behind, even though I didn't want it.
James Clear's Atomic Habits was published last year. I'd only read 2-3 non-tech books before reading this one in August 2021. I knew everything but couldn't use it.
In April 2022, I realized the compounding effect of a bad habit thanks to my subconscious mind. 1 cigarette per day (excluding weekends) equals 240 = 24 packs per year, which is a lot. No matter how much I did, it felt negative.
Then I applied the 2nd principle of this book, identifying the trigger. I tried to identify all the major triggers of smoking. I found social drinking is one of them & If I am able to control it during that time, I can easily control it in other situations as well. Going further whenever I drank, I was pre-determined to ignore the craving at any cost. Believe me, it was very hard initially but gradually this craving started fading away even with drinks.
I've been smoke-free for 3 months. Now I know a bad habit's effects. After realizing the power of habits, I'm developing other good habits which I ignored all my life.
Vanessa Karel
3 years ago
10 hard lessons from founding a startup.
Here is the ugly stuff, read this if you have a founder in your life or are trying to become one. Your call.

#1 You'll try to talk yourself to sleep, but it won't always work.
As founders, we're all driven. Good and bad, you're restless. Success requires resistance and discipline. Your startup will be on your mind 24/7, and not everyone will have the patience to listen to your worries, ideas, and coffee runs. You become more self-sufficient than ever before.
#2 No one will understand what you're going through unless they've been a founder.
Some of my closest friends don't understand the work that goes into starting a business, and we can't blame them.
#3 You'll feel alienated.
Your problems aren't common; calling your bestie won't help. You must search hard for the right resources. It alienates you from conversations you no longer relate to. (No 4th of July, no long weekends!)
#4 Since you're your "own boss," people assume you have lots of free time.
Do you agree? I was on a webinar with lots of new entrepreneurs, and one woman said, "I started my own business so I could have more time for myself." This may be true for some lucky people, and you can be flexible with your schedule. If you want your business to succeed, you'll probably be its slave for a while.
#5 No time for illness or family emergencies.
Both last month. Oh, no! Physically and emotionally withdrawing at the worst times will give you perspective. I learned this the hard way because I was too stubborn to postpone an important interview. I thought if I rested all day and only took one call, I'd be fine. Nope. I had a fever and my mind wasn't as sharp, so my performance and audience interaction suffered. Nope. Better to delay than miss out.
Oh, and setting a "OoO" makes you cringe.
#6 Good luck with your mental health, perfectionists.
When building a startup, it's difficult to accept that there won't be enough time to do everything. You can't make them all, not perfectly. You must learn to accept things that are done but not perfect.
#7 As a founder, you'll make mistakes, but you'll want to make them quickly so you can learn.
Hard lessons are learned quicker. You'll need to pivot and try new things often; some won't work, and it's best to discover them sooner rather than later.
#8 Pyramid schemes abound.
I didn't realize how bad it was until I started a company. You must spy and constantly research. As a founder, you'll receive many emails from people claiming to "support" you. Be wary and keep your eyes open. When it's too good to be true. Some "companies" will try to get you to pay for "competitions" to "pitch at events." Don't do it.
#9 Keep your competitor research to a minimum.
Actually, competition is good. It means there's a market for those solutions. However, this can be mentally exhausting too. Learn about their geography and updates, but that's it.
#10 You'll feel guilty taking vacation.
I don't know what to say, but I no longer enjoy watching TV, and that's okay. Pay attention to things that enrich you, bring you joy, and have fun. It boosts creativity.
Being a startup founder may be one of the hardest professional challenges you face, but it's also a great learning experience. Your passion will take you places you never imagined and open doors to opportunities you wouldn't have otherwise. You'll meet amazing people. No regrets, no complaints. It's a roller coaster, but the good days are great.
Miss anything? Comment below

umair haque
2 years ago
The reasons why our civilization is deteriorating
The Industrial Revolution's Curse: Why One Age's Power Prevents the Next Ones
A surprising fact. Recently, Big Oil's 1970s climate change projections were disturbingly accurate. Of course, we now know that it worked tirelessly to deny climate change, polluting our societies to this day. That's a small example of the Industrial Revolution's curse.
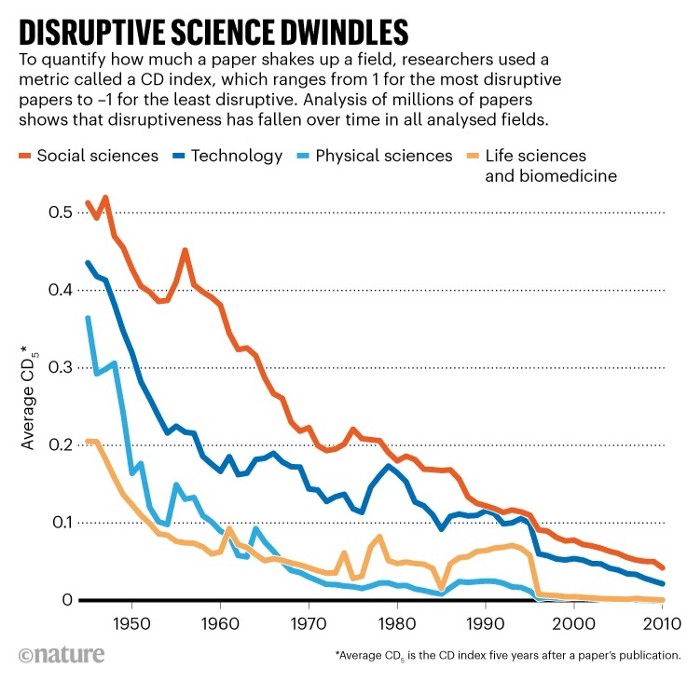
Let me rephrase this nuanced and possibly weird thought. The chart above? Disruptive science is declining. The kind that produces major discoveries, new paradigms, and shattering prejudices.
Not alone. Our civilisation reached a turning point suddenly. Progress stopped and reversed for the first time in centuries.
The Industrial Revolution's Big Bang started it all. At least some humans had riches for the first time, if not all, and with that wealth came many things. Longer, healthier lives since now health may be publicly and privately invested in. For the first time in history, wealthy civilizations could invest their gains in pure research, a good that would have sounded frivolous to cultures struggling to squeeze out the next crop, which required every shoulder to the till.
So. Don't confuse me with the Industrial Revolution's curse. Industry progressed. Contrary. I'm claiming that the Big Bang of Progress is slowing, plateauing, and ultimately reversing. All social indicators show that. From progress itself to disruptive, breakthrough research, everything is slowing down.
It's troubling. Because progress slows and plateaus, pre-modern social problems like fascism, extremism, and fundamentalism return. People crave nostalgic utopias when they lose faith in modernity. That strongman may shield me from this hazardous life. If I accept my place in a blood-and-soil hierarchy, I have a stable, secure position and someone to punch and detest. It's no coincidence that as our civilization hits a plateau of progress, there is a tsunami pulling the world backwards, with people viscerally, openly longing for everything from theocracy to fascism to fundamentalism, an authoritarian strongman to soothe their fears and tell them what to do, whether in Britain, heartland America, India, China, and beyond.
However, one aspect remains unknown. Technology. Let me clarify.
How do most people picture tech? Say that without thinking. Most people think of social media or AI. Well, small correlation engines called artificial neurons are a far cry from biological intelligence, which functions in far more obscure and intricate ways, down to the subatomic level. But let's try it.
Today, tech means AI. But. Do you foresee it?
Consider why civilisation is plateauing and regressing. Because we can no longer provide the most basic necessities at the same rate. On our track, clean air, water, food, energy, medicine, and healthcare will become inaccessible to huge numbers within a decade or three. Not enough. There isn't, therefore prices for food, medicine, and energy keep rising, with occasional relief.
Why our civilizations are encountering what economists like me term a budget constraint—a hard wall of what we can supply—should be evident. Global warming and extinction. Megafires, megadroughts, megafloods, and failed crops. On a civilizational scale, good luck supplying the fundamentals that way. Industrial food production cannot feed a planet warming past two degrees. Crop failures, droughts, floods. Another example: glaciers melt, rivers dry up, and the planet's fresh water supply contracts like a heart attack.
Now. Let's talk tech again. Mostly AI, maybe phone apps. The unsettling reality is that current technology cannot save humanity. Not much.
AI can do things that have become cliches to titillate the masses. It may talk to you and act like a person. It can generate art, which means reproduce it, but nonetheless, AI art! Despite doubts, it promises to self-drive cars. Unimportant.
We need different technology now. AI won't grow crops in ash-covered fields, cleanse water, halt glaciers from melting, or stop the clear-cutting of the planet's few remaining forests. It's not useless, but on a civilizational scale, it's much less beneficial than its proponents claim. By the time it matures, AI can help deliver therapy, keep old people company, and even drive cars more efficiently. None of it can save our culture.
Expand that scenario. AI's most likely use? Replacing call-center workers. Support. It may help doctors diagnose, surgeons orient, or engineers create more fuel-efficient motors. This is civilizationally marginal.
Non-disruptive. Do you see the connection with the paper that indicated disruptive science is declining? AI exemplifies that. It's called disruptive, yet it's a textbook incremental technology. Oh, cool, I can communicate with a bot instead of a poor human in an underdeveloped country and have the same or more trouble being understood. This bot is making more people unemployed. I can now view a million AI artworks.
AI illustrates our civilization's trap. Its innovative technologies will change our lives. But as you can see, its incremental, delivering small benefits at most, and certainly not enough to balance, let alone solve, the broader problem of steadily dropping living standards as our society meets a wall of being able to feed itself with fundamentals.
Contrast AI with disruptive innovations we need. What do we need to avoid a post-Roman Dark Age and preserve our civilization in the coming decades? We must be able to post-industrially produce all our basic needs. We need post-industrial solutions for clean water, electricity, cement, glass, steel, manufacture for garments and shoes, starting with the fossil fuel-intensive plastic, cotton, and nylon they're made of, and even food.
Consider. We have no post-industrial food system. What happens when crop failures—already dangerously accelerating—reach a critical point? Our civilization is vulnerable. Think of ancient civilizations that couldn't survive the drying up of their water sources, the failure of their primary fields, which they assumed the gods would preserve forever, or an earthquake or sickness that killed most of their animals. Bang. Lost. They failed. They splintered, fragmented, and abandoned vast capitols and cities, and suddenly, in history's sight, poof, they were gone.
We're getting close. Decline equals civilizational peril.
We believe dumb notions about AI becoming disruptive when it's incremental. Most of us don't realize our civilization's risk because we believe these falsehoods. Everyone should know that we cannot create any thing at civilizational scale without fossil fuels. Most of us don't know it, thus we don't realize that the breakthrough technologies and systems we need don't manipulate information anymore. Instead, biotechnologies, largely but not genes, generate food without fossil fuels.
We need another Industrial Revolution. AI, apps, bots, and whatnot won't matter unless you think you can eat and drink them while the world dies and fascists, lunatics, and zealots take democracy's strongholds. That's dramatic, but only because it's already happening. Maybe AI can entertain you in that bunker while society collapses with smart jokes or a million Mondrian-like artworks. If civilization is to survive, it cannot create the new Industrial Revolution.
The revolution has begun, but only in small ways. Post-industrial fundamental systems leaders are developing worldwide. The Netherlands is leading post-industrial agriculture. That's amazing because it's a tiny country performing well. Correct? Discover how large-scale agriculture can function, not just you and me, aged hippies, cultivating lettuce in our backyards.
Iceland is leading bioplastics, which, if done well, will be a major advance. Of sure, microplastics are drowning the oceans. What should we do since we can't live without it? We need algae-based bioplastics for green plastic.
That's still young. Any of the above may not function on a civilizational scale. Bioplastics use algae, which can cause problems if overused. None of the aforementioned indicate the next Industrial Revolution is here. Contrary. Slowly.
We have three decades until everything fails. Before life ends. Curtain down. No more fields, rivers, or weather. Freshwater and life stocks have plummeted. Again, we've peaked and declined in our ability to live at today's relatively rich standards. Game over—no more. On a dying planet, producing the fundamentals for a civilisation that left it too late to construct post-industrial systems becomes next to impossible, with output dropping faster and quicker each year, quarter, and day.
Too slow. That's because it's not really happening. Most people think AI when I say tech. I get a politicized response if I say Green New Deal or Clean Industrial Revolution. Half the individuals I talk to have been politicized into believing that climate change isn't real and that any breakthrough technical progress isn't required, desirable, possible, or genuine. They'll suffer.
The Industrial Revolution curse. Every revolution creates new authorities, which ossify and refuse to relinquish their privileges. For fifty years, Big Oil has denied climate change, even though their scientists predicted it. We also have a software industry and its venture capital power centers that are happy for the average person to think tech means chatbots, not being able to produce basics for a civilization without destroying the planet, and billionaires who buy comms platforms for the same eye-watering amount of money it would take to save life on Earth.
The entire world's vested interests are against the next industrial revolution, which is understandable since they were established from fossil money. From finance to energy to corporate profits to entertainment, power in our world is the result of the last industrial revolution, which means it has no motivation or purpose to give up fossil money, as we are witnessing more brutally out in the open.
Thus, the Industrial Revolution's curse—fossil power—rules our globe. Big Agriculture, Big Pharma, Wall St., Silicon Valley, and many others—including politics, which they buy and sell—are basically fossil power, and they have no interest in generating or letting the next industrial revolution happen. That's why tiny enterprises like those creating bioplastics in Iceland or nations savvy enough to shun fossil power, like the Netherlands, which has a precarious relationship with nature, do it. However, fossil power dominates politics, economics, food, clothes, energy, and medicine, and it has no motivation to change.
Allow disruptive innovations again. As they occur, its position becomes increasingly vulnerable. If you were fossil power, would you allow another industrial revolution to destroy its privilege and wealth?
You might, since power and money haven't corrupted you. However, fossil power prevents us from building, creating, and growing what we need to survive as a society. I mean the entire economic, financial, and political power structure from the last industrial revolution, not simply Big Oil. My friends, fossil power's chokehold over our society is likely to continue suffocating the advances that could have spared our civilization from a decline that's now here and spiraling closer to oblivion.