


More on Web3 & Crypto

Caleb Naysmith
3 years ago Draft
A Myth: Decentralization
It’s simply not conceivable, or at least not credible.
One of the most touted selling points of Crypto has always been this grandiose idea of decentralization. Bitcoin first arose in 2009 after the housing crisis and subsequent crash that came with it. It aimed to solve this supposed issue of centralization. Nobody “owns” Bitcoin in theory, so the idea then goes that it won’t be subject to the same downfalls that led to the 2008 crash or similarly speculative events that led to the 2008 disaster. The issue is the banks, not the human nature associated with the greedy individuals running them.
Subsequent blockchains have attempted to fix many of the issues of Bitcoin by increasing capacity, decreasing the costs and processing times associated with Bitcoin, and expanding what can be done with their blockchains. Since nobody owns Bitcoin, it hasn’t really been able to be expanded on. You have people like Vitalk Buterin, however, that actively work on Ethereum though.
The leap from Bitcoin to Ethereum was a massive leap toward centralization, and the trend has only gotten worse. In fact, crypto has since become almost exclusively centralized in recent years.
Decentralization is only good in theory
It’s a good idea. In fact, it’s a wonderful idea. However, like other utopian societies, individuals misjudge human nature and greed. In a perfect world, decentralization would certainly be a wonderful idea because sure, people may function as their own banks, move payments immediately, remain anonymous, and so on. However, underneath this are a couple issues:
You can already send money instantaneously today.
They are not decentralized.
Decentralization is a bad idea.
Being your own bank is a stupid move.
Let’s break these down. Some are quite simple, but lets have a look.
Sending money right away
One thing with crypto is the idea that you can send payments instantly. This has pretty much been entirely solved in current times. You can transmit significant sums of money instantly for a nominal cost and it’s instantaneously cleared. Venmo was launched in 2009 and has since increased to prominence, and currently is on most people's phones. I can directly send ANY amount of money quickly from my bank to another person's Venmo account.
Comparing that with ETH and Bitcoin, Venmo wins all around. I can send money to someone for free instantly in dollars and the only fee paid is optional depending on when you want it.
Both Bitcoin and Ethereum are subject to demand. If the blockchains have a lot of people trying to process transactions fee’s go up, and the time that it takes to receive your crypto takes longer. When Ethereum gets bad, people have reported spending several thousand of dollars on just 1 transaction.
These transactions take place via “miners” bundling and confirming transactions, then recording them on the blockchain to confirm that the transaction did indeed happen. They charge fees to do this and are also paid in Bitcoin/ETH. When a transaction is confirmed, it's then sent to the other users wallet. This within itself is subject to lots of controversy because each transaction needs to be confirmed 6 times, this takes massive amounts of power, and most of the power is wasted because this is an adversarial system in which the person that mines the transaction gets paid, and everyone else is out of luck. Also, these could theoretically be subject to a “51% attack” in which anyone with over 51% of the mining hash rate could effectively control all of the transactions, and reverse transactions while keeping the BTC resulting in “double spending”.
There are tons of other issues with this, but essentially it means: They rely on these third parties to confirm the transactions. Without people confirming these transactions, Bitcoin stalls completely, and if anyone becomes too dominant they can effectively control bitcoin.
Not to mention, these transactions are in Bitcoin and ETH, not dollars. So, you need to convert them to dollars still, and that's several more transactions, and likely to take several days anyway as the centralized exchange needs to send you the money by traditional methods.
They are not distributed
That takes me to the following point. This isn’t decentralized, at all. Bitcoin is the closest it gets because Satoshi basically closed it to new upgrades, although its still subject to:
Whales
Miners
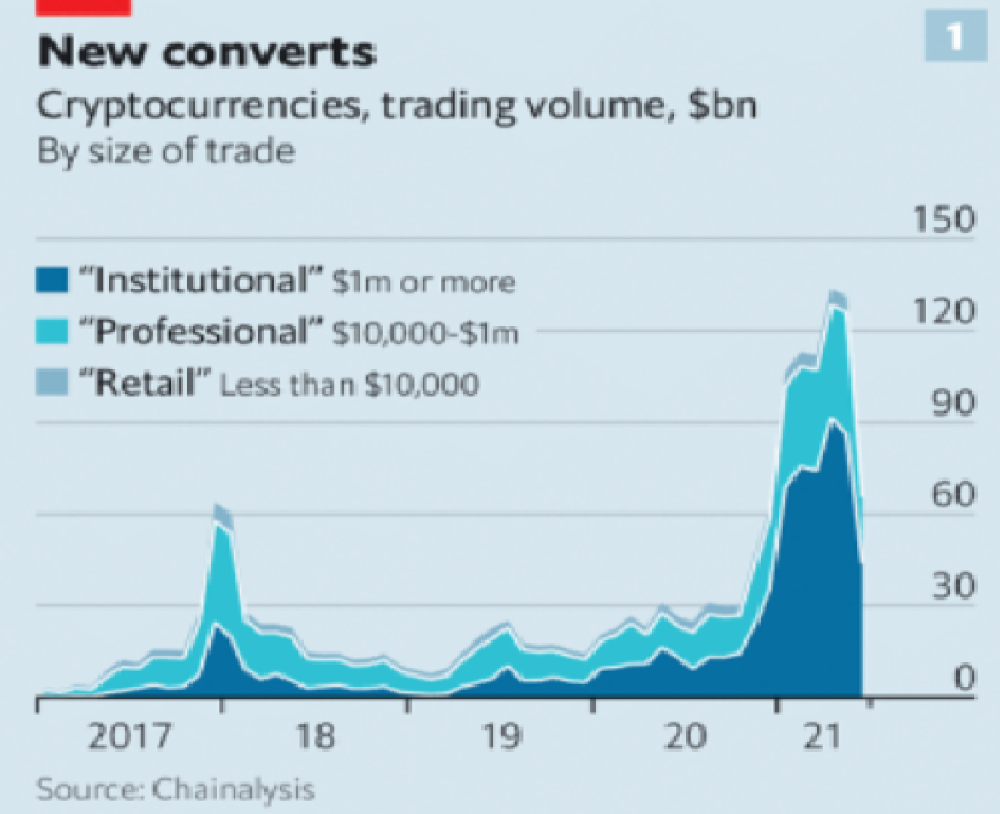
It’s vital to realize that these are often the same folks. While whales aren’t centralized entities typically, they can considerably effect the price and outcome of Bitcoin. If the largest wallets holding as much as 1 million BTC were to sell, it’d effectively collapse the price perhaps beyond repair. However, Bitcoin can and is pretty much controlled by the miners. Further, Bitcoin is more like an oligarchy than decentralized. It’s been effectively used to make the rich richer, and both the mining and price is impacted by the rich. The overwhelming minority of those actually using it are retail investors. The retail investors are basically never the ones generating money from it either.
As far as ETH and other cryptos go, there is realistically 0 case for them being decentralized. Vitalik could not only kill it but even walking away from it would likely lead to a significant decline. It has tons of issues right now that Vitalik has promised to fix with the eventual Ethereum 2.0., and stepping away from it wouldn’t help.
Most tokens as well are generally tied to some promise of future developments and creators. The same is true for most NFT projects. The reason 99% of crypto and NFT projects fail is because they failed to deliver on various promises or bad dev teams, or poor innovation, or the founders just straight up stole from everyone. I could go more in-depth than this but go find any project and if there is a dev team, company, or person tied to it then it's likely, not decentralized. The success of that project is directly tied to the dev team, and if they wanted to, most hold large wallets and could sell it all off effectively killing the project. Not to mention, any crypto project that doesn’t have a locked contract can 100% be completely rugged and they can run off with all of the money.
Decentralization is undesirable
Even if they were decentralized then it would not be a good thing. The graphic above indicates this is effectively a rich person’s unregulated playground… so it’s exactly like… the very issue it tried to solve?
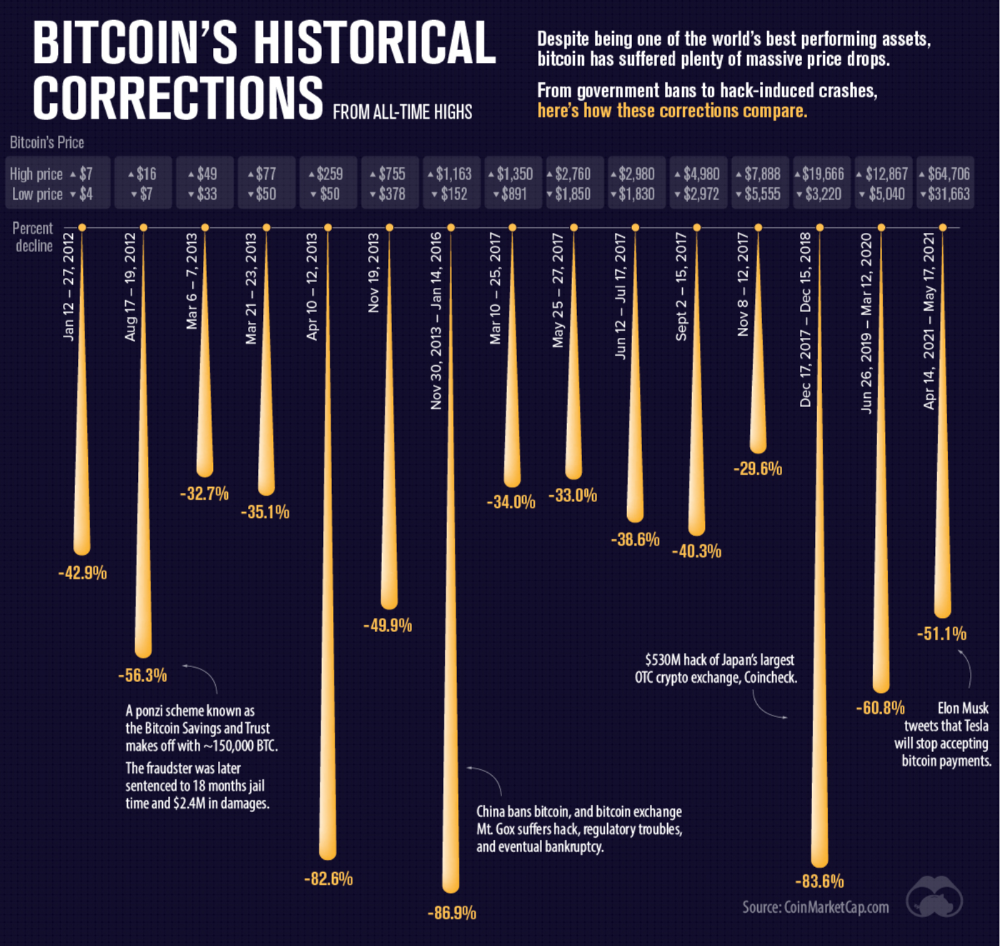
Not to mention, it’s supposedly meant to prevent things like 2008, but is regularly subjected to 50–90% drawdowns in value? Back when Bitcoin was only known in niche parts of the dark web and illegal markets, it would regularly drop as much as 90% and has a long history of massive drawdowns.
The majority of crypto is blatant scams, and ALL of crypto is a “zero” or “negative” sum game in that it relies on the next person buying for people to make money. This is not a good thing. This has yet to solve any issues around what caused the 2008 crisis. Rather, it seemingly amplified all of the bad parts of it actually. Crypto is the ultimate speculative asset and realistically has no valuation metric. People invest in Apple because it has revenue and cash on hand. People invest in crypto purely for speculation. The lack of regulation or accountability means this is amplified to the most extreme degree where anything goes: Fraud, deception, pump and dumps, scams, etc. This results in a pure speculative madhouse where, unsurprisingly, only the rich win. Not only that but the deck is massively stacked in against the everyday investor because you can’t do a pump and dump without money.
At the heart of all of this is still the same issues: greed and human nature. However, in setting out to solve the issues that allowed 2008 to happen, they made something that literally took all of the bad parts of 2008 and then amplified it. 2008, similarly, was due to greed and human nature but was allowed to happen due to lack of oversite, rich people's excessive leverage over the poor, and excessive speculation. Crypto trades SOLELY on human emotion, has 0 oversite, is pure speculation, and the power dynamic is just as bad or worse.
Why should each individual be their own bank?
This is the last one, and it's short and basic. Why do we want people functioning as their own bank? Everything we do relies on another person. Without the internet, and internet providers there is no crypto. We don’t have people functioning as their own home and car manufacturers or internet service providers. Sure, you might specialize in some of these things, but masquerading as your own bank is a horrible idea.
I am not in the banking industry so I don’t know all the issues with banking. Most people aren’t in banking or crypto, so they don’t know the ENDLESS scams associated with it, and they are bound to lose their money eventually.
If you appreciate this article and want to read more from me and authors like me, without any limits, consider buying me a coffee: buymeacoffee.com/calebnaysmith
Langston Thomas
3 years ago
A Simple Guide to NFT Blockchains
Ethereum's blockchain rules NFTs. Many consider it the one-stop shop for NFTs, and it's become the most talked-about and trafficked blockchain in existence.
Other blockchains are becoming popular in NFTs. Crypto-artists and NFT enthusiasts have sought new places to mint and trade NFTs due to Ethereum's high transaction costs and environmental impact.
When choosing a blockchain to mint on, there are several factors to consider. Size, creator costs, consumer spending habits, security, and community input are important. We've created a high-level summary of blockchains for NFTs to help clarify the fast-paced world of web3 tech.
Ethereum
Ethereum currently has the most NFTs. It's decentralized and provides financial and legal services without intermediaries. It houses popular NFT marketplaces (OpenSea), projects (CryptoPunks and the Bored Ape Yacht Club), and artists (Pak and Beeple).
It's also expensive and energy-intensive. This is because Ethereum works using a Proof-of-Work (PoW) mechanism. PoW requires computers to solve puzzles to add blocks and transactions to the blockchain. Solving these puzzles requires a lot of computer power, resulting in astronomical energy loss.
You should consider this blockchain first due to its popularity, security, decentralization, and ease of use.
Solana
Solana is a fast programmable blockchain. Its proof-of-history and proof-of-stake (PoS) consensus mechanisms eliminate complex puzzles. Reduced validation times and fees result.
PoS users stake their cryptocurrency to become a block validator. Validators get SOL. This encourages and rewards users to become stakers. PoH works with PoS to cryptographically verify time between events. Solana blockchain ensures transactions are in order and found by the correct leader (validator).
Solana's PoS and PoH mechanisms keep transaction fees and times low. Solana isn't as popular as Ethereum, so there are fewer NFT marketplaces and blockchain traders.
Tezos
Tezos is a greener blockchain. Tezos rose in 2021. Hic et Nunc was hailed as an economic alternative to Ethereum-centric marketplaces until Nov. 14, 2021.
Similar to Solana, Tezos uses a PoS consensus mechanism and only a PoS mechanism to reduce computational work. This blockchain uses two million times less energy than Ethereum. It's cheaper than Ethereum (but does cost more than Solana).
Tezos is a good place to start minting NFTs in bulk. Objkt is the largest Tezos marketplace.
Flow
Flow is a high-performance blockchain for NFTs, games, and decentralized apps (dApps). Flow is built with scalability in mind, so billions of people could interact with NFTs on the blockchain.
Flow became the NBA's blockchain partner in 2019. Flow, a product of Dapper labs (the team behind CryptoKitties), launched and hosts NBA Top Shot, making the blockchain integral to the popularity of non-fungible tokens.
Flow uses PoS to verify transactions, like Tezos. Developers are working on a model to handle 10,000 transactions per second on the blockchain. Low transaction fees.
Flow NFTs are tradeable on Blocktobay, OpenSea, Rarible, Foundation, and other platforms. NBA, NFL, UFC, and others have launched NFT marketplaces on Flow. Flow isn't as popular as Ethereum, resulting in fewer NFT marketplaces and blockchain traders.
Asset Exchange (WAX)
WAX is king of virtual collectibles. WAX is popular for digitalized versions of legacy collectibles like trading cards, figurines, memorabilia, etc.
Wax uses a PoS mechanism, but also creates carbon offset NFTs and partners with Climate Care. Like Flow, WAX transaction fees are low, and network fees are redistributed to the WAX community as an incentive to collectors.
WAX marketplaces host Topps, NASCAR, Hot Wheels, and cult classic film franchises like Godzilla, The Princess Bride, and Spiderman.
Binance Smart Chain
BSC is another good option for balancing fees and performance. High-speed transactions and low fees hurt decentralization. BSC is most centralized.
Binance Smart Chain uses Proof of Staked Authority (PoSA) to support a short block time and low fees. The 21 validators needed to run the exchange switch every 24 hours. 11 of the 21 validators are directly connected to the Binance Crypto Exchange, according to reports.
While many in the crypto and NFT ecosystems dislike centralization, the BSC NFT market picked up speed in 2021. OpenBiSea, AirNFTs, JuggerWorld, and others are gaining popularity despite not having as robust an ecosystem as Ethereum.

TheRedKnight
3 years ago
Say goodbye to Ponzi yields - A new era of decentralized perpetual
Decentralized perpetual may be the next crypto market boom; with tons of perpetual popping up, let's look at two protocols that offer organic, non-inflationary yields.
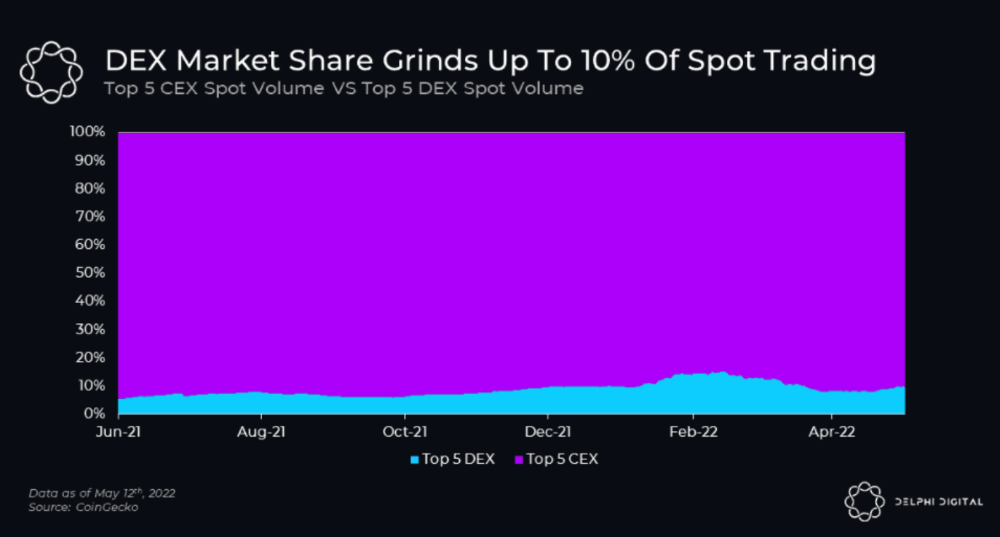
Decentralized derivatives exchanges' market share has increased tenfold in a year, but it's still 2% of CEXs'. DEXs have a long way to go before they can compete with centralized exchanges in speed, liquidity, user experience, and composability.
I'll cover gains.trade and GMX protocol in Polygon, Avalanche, and Arbitrum. Both protocols support leveraged perpetual crypto, stock, and Forex trading.
Why these protocols?
Decentralized GMX Gains protocol
Organic yield: path to sustainability
I've never trusted Defi's non-organic yields. Example: XYZ protocol. 20–75% of tokens may be set aside as farming rewards to provide liquidity, according to tokenomics.
Say you provide ETH-USDC liquidity. They advertise a 50% APR reward for this pair, 10% from trading fees and 40% from farming rewards. Only 10% is real, the rest is "Ponzi." The "real" reward is in protocol tokens.
Why keep this token? Governance voting or staking rewards are promoted services.
Most liquidity providers expect compensation for unused tokens. Basic psychological principles then? — Profit.
Nobody wants governance tokens. How many out of 100 care about the protocol's direction and will vote?
Staking increases your token's value. Currently, they're mostly non-liquid. If the protocol is compromised, you can't withdraw funds. Most people are sceptical of staking because of this.
"Free tokens," lack of use cases, and skepticism lead to tokens moving south. No farming reward protocols have lasted.
It may have shown strength in a bull market, but what about a bear market?
What is decentralized perpetual?
A perpetual contract is a type of futures contract that doesn't expire. So one can hold a position forever.
You can buy/sell any leveraged instruments (Long-Short) without expiration.
In centralized exchanges like Binance and coinbase, fees and revenue (liquidation) go to the exchanges, not users.
Users can provide liquidity that traders can use to leverage trade, and the revenue goes to liquidity providers.
Gains.trade and GMX protocol are perpetual trading platforms with a non-inflationary organic yield for liquidity providers.
GMX protocol
GMX is an Arbitrum and Avax protocol that rewards in ETH and Avax. GLP uses a fast oracle to borrow the "true price" from other trading venues, unlike a traditional AMM.
GLP and GMX are protocol tokens. GLP is used for leveraged trading, swapping, etc.
GLP is a basket of tokens, including ETH, BTC, AVAX, stablecoins, and UNI, LINK, and Stablecoins.
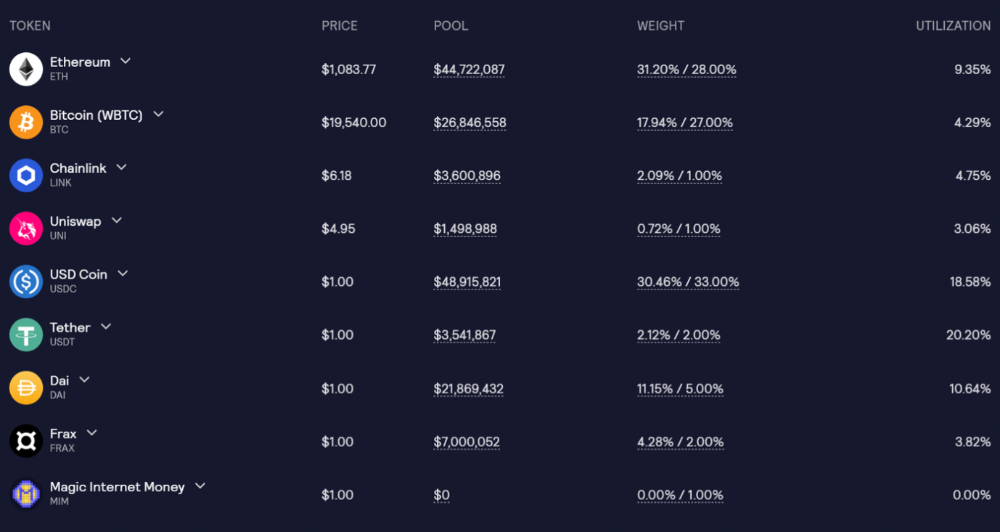
GLP composition on arbitrum
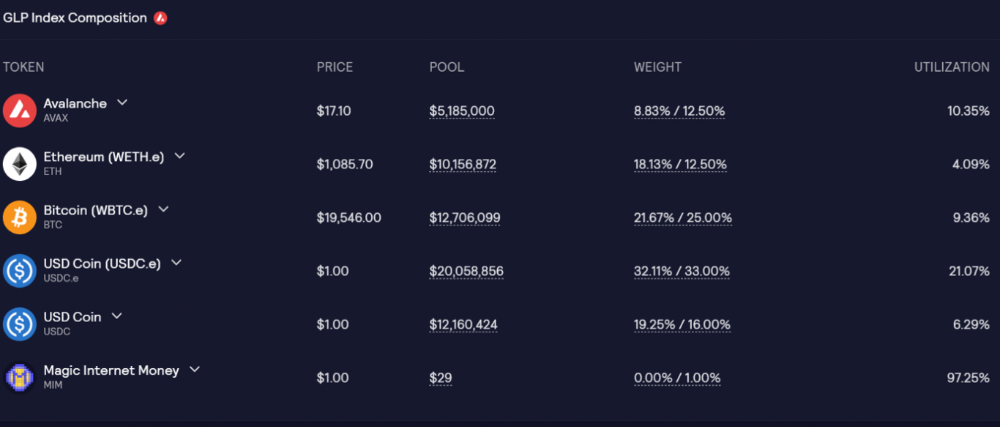
GLP composition on Avalanche
GLP token rebalances based on usage, providing liquidity without loss.
Protocol "runs" on Staking GLP. Depending on their chain, the protocol will reward users with ETH or AVAX. Current rewards are 22 percent (15.71 percent in ETH and the rest in escrowed GMX) and 21 percent (15.72 percent in AVAX and the rest in escrowed GMX). escGMX and ETH/AVAX percentages fluctuate.
Where is the yield coming from?
Swap fees, perpetual interest, and liquidations generate yield. 70% of fees go to GLP stakers, 30% to GMX. Organic yields aren't paid in inflationary farm tokens.
Escrowed GMX is vested GMX that unlocks in 365 days. To fully unlock GMX, you must farm the Escrowed GMX token for 365 days. That means less selling pressure for the GMX token.
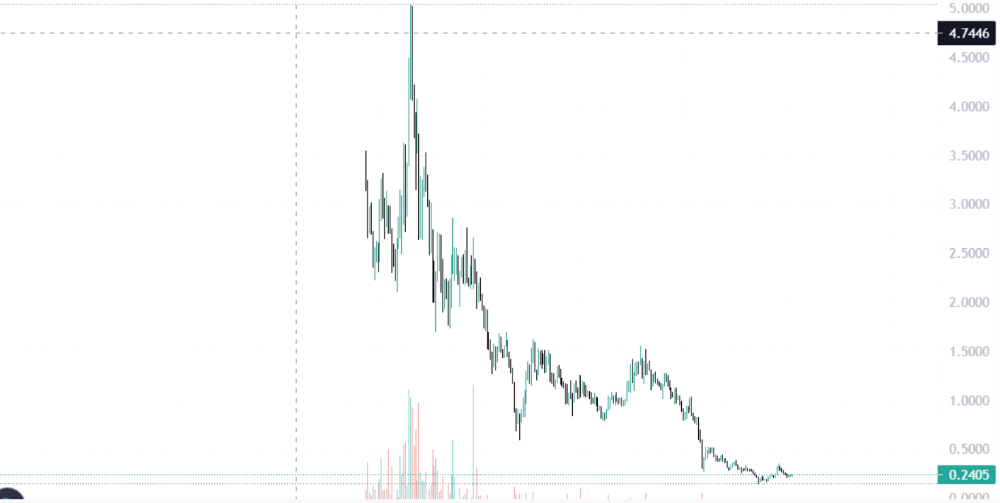
GMX's status
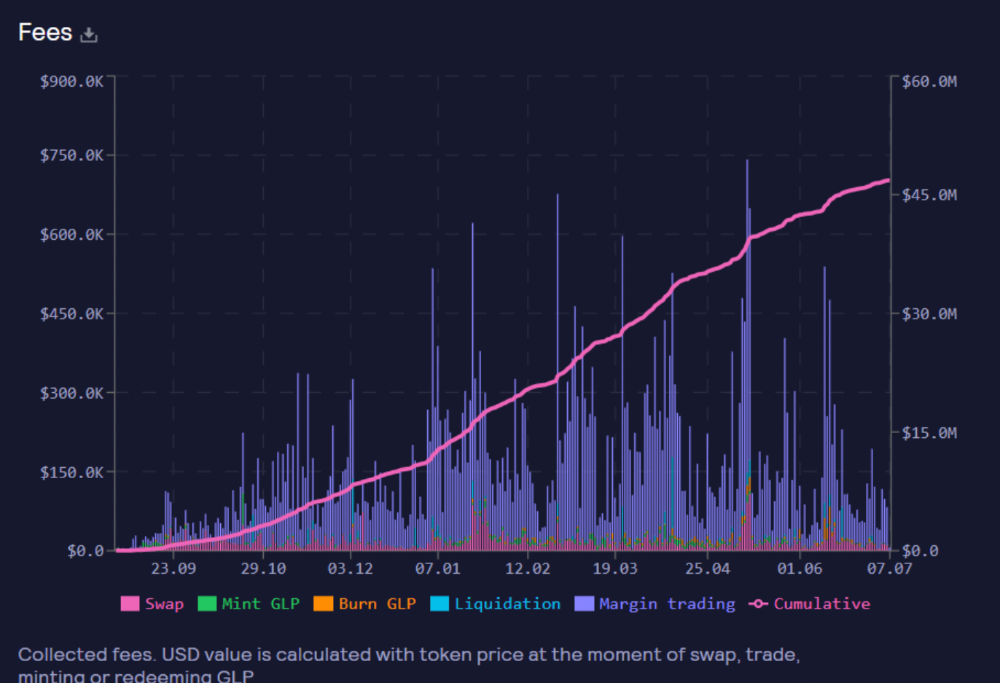
These are the fees in Arbitrum in the past 11 months by GMX.
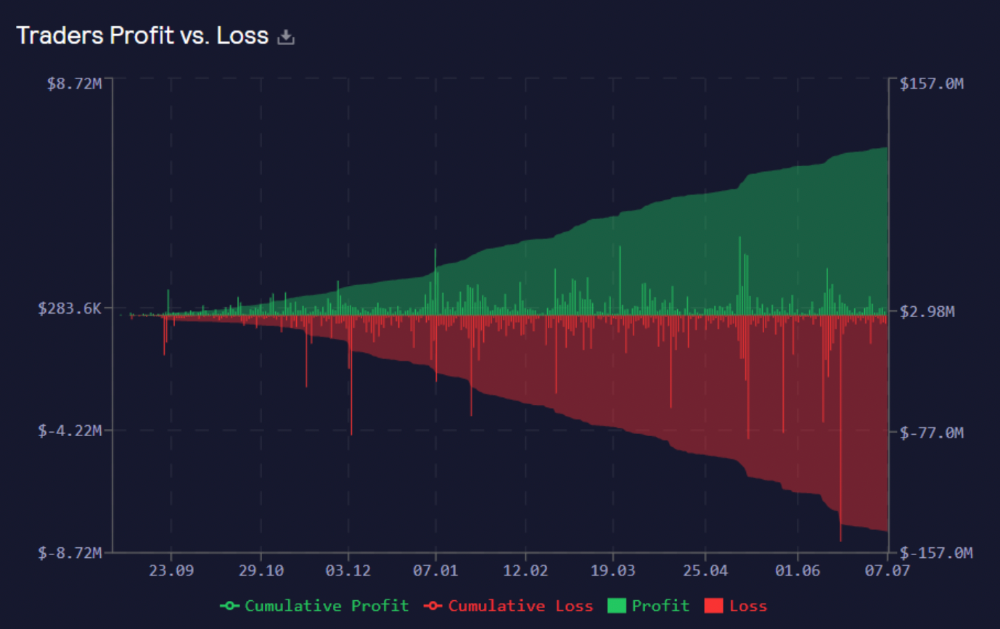
GMX works like a casino, which increases fees. Most fees come from Margin trading, which means most traders lose money; this money goes to the casino, or GLP stakers.
Strategies
My personal strategy is to DCA into GLP when markets hit bottom and stake it; GLP will be less volatile with extra staking rewards.
GLP YoY return vs. naked buying
Let's say I invested $10,000 in BTC, AVAX, and ETH in January.
BTC price: 47665$
ETH price: 3760$
AVAX price: $145
Current prices
BTC $21,000 (Down 56 percent )
ETH $1233 (Down 67.2 percent )
AVAX $20.36 (Down 85.95 percent )
Your $10,000 investment is now worth around $3,000.
How about GLP? My initial investment is 50% stables and 50% other assets ( Assuming the coverage ratio for stables is 50 percent at that time)
Without GLP staking yield, your value is $6500.
Let's assume the average APR for GLP staking is 23%, or $1500. So 8000$ total. It's 50% safer than holding naked assets in a bear market.
In a bull market, naked assets are preferable to GLP.
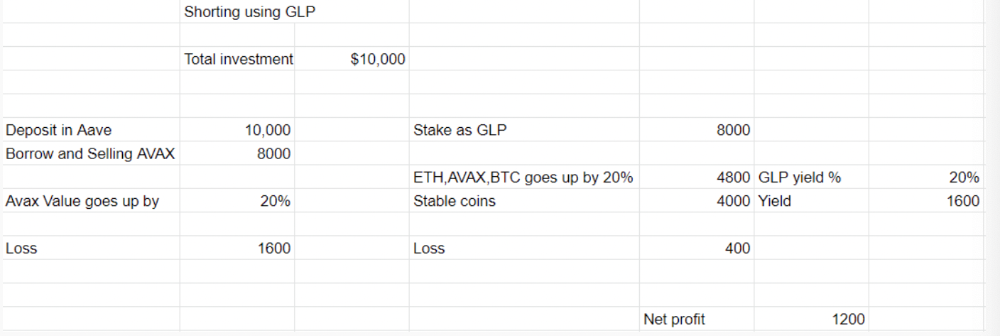
Short farming using GLP
Simple GLP short farming.
You use a stable asset as collateral to borrow AVAX. Sell it and buy GLP. Even if GLP rises, it won't rise as fast as AVAX, so we can get yields.
Let's do the maths
You deposit $10,000 USDT in Aave and borrow Avax. Say you borrow $8,000; you sell it, buy GLP, and risk 20%.
After a year, ETH, AVAX, and BTC rise 20%. GLP is $8800. $800 vanishes. 20% yields $1600. You're profitable. Shorting Avax costs $1600. (Assumptions-ETH, AVAX, BTC move the same, GLP yield is 20%. GLP has a 50:50 stablecoin/others ratio. Aave won't liquidate
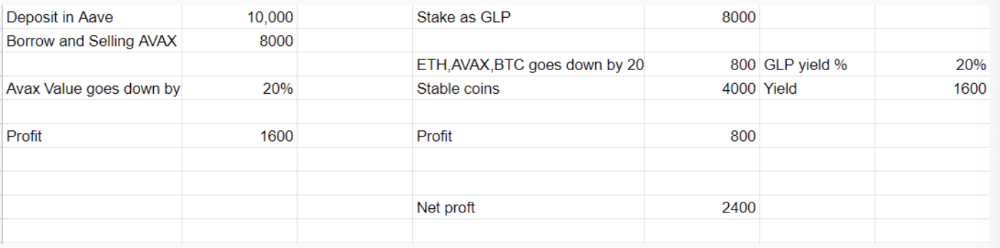
In naked Avax shorting, Avax falls 20% in a year. You'll make $1600. If you buy GLP and stake it using the sold Avax and BTC, ETH and Avax go down by 20% - your profit is 20%, but with the yield, your total gain is $2400.
Issues with GMX
GMX's historical funding rates are always net positive, so long always pays short. This makes long-term shorts less appealing.
Oracle price discovery isn't enough. This limitation doesn't affect Bitcoin and ETH, but it affects less liquid assets. Traders can buy and sell less liquid assets at a lower price than their actual cost as long as GMX exists.
As users must provide GLP liquidity, adding more assets to GMX will be difficult. Next iteration will have synthetic assets.
Gains Protocol
Best leveraged trading platform. Smart contract-based decentralized protocol. 46 crypto pairs can be leveraged 5–150x and 10 Forex pairs 5–1000x. $10 DAI @ 150x (min collateral x leverage pos size is $1500 DAI). No funding fees, no KYC, trade DAI from your wallet, keep funds.
DAI single-sided staking and the GNS-DAI pool are important parts of Gains trading. GNS-DAI stakers get 90% of trading fees and 100% swap fees. 10 percent of trading fees go to DAI stakers, which is currently 14 percent!
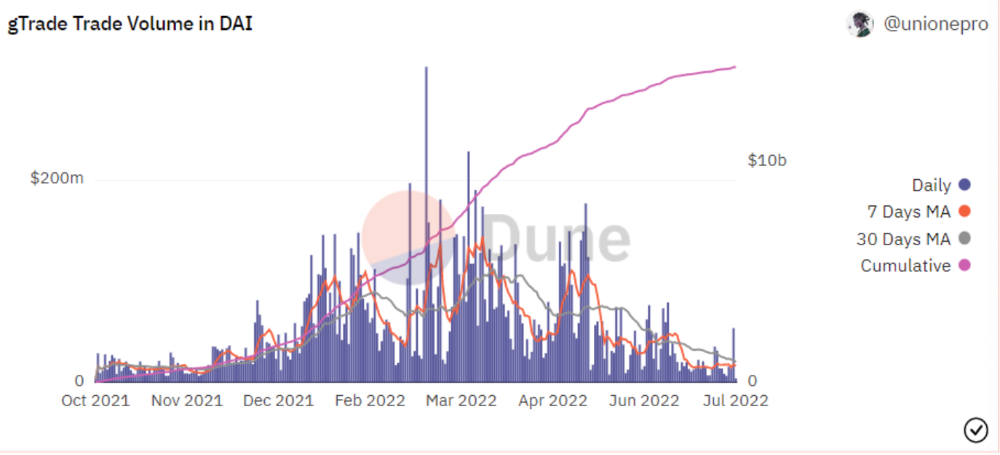
Trade volume
When a trader opens a trade, the leverage and profit are pulled from the DAI pool. If he loses, the protocol yield goes to the stakers.
If the trader's win rate is high and the DAI pool slowly depletes, the GNS token is minted and sold to refill DAI. Trader losses are used to burn GNS tokens. 25%+ of GNS is burned, making it deflationary.
Due to high leverage and volatility of crypto assets, most traders lose money and the protocol always wins, keeping GNS deflationary.
Gains uses a unique decentralized oracle for price feeds, which is better for leverage trading platforms. Let me explain.
Gains uses chainlink price oracles, not its own price feeds. Chainlink oracles only query centralized exchanges for price feeds every minute, which is unsuitable for high-precision trading.
Gains created a custom oracle that queries the eight chainlink nodes for the current price and, on average, for trade confirmation. This model eliminates every-second inquiries, which waste gas but are more efficient than chainlink's per-minute price.
This price oracle helps Gains open and close trades instantly, eliminate scam wicks, etc.
Other benefits include:
Stop-loss guarantee (open positions updated)
No scam wicks
Spot-pricing
Highest possible leverage
Fixed-spreads. During high volatility, a broker can increase the spread, which can hit your stop loss without the price moving.
Trade directly from your wallet and keep your funds.
>90% loss before liquidation (Some platforms liquidate as little as -50 percent)
KYC-free
Directly trade from wallet; keep funds safe
Further improvements
GNS-DAI liquidity providers fear the impermanent loss, so the protocol is migrating to its own liquidity and single staking GNS vaults. This allows users to stake GNS without permanent loss and obtain 90% DAI trading fees by staking. This starts in August.
Their upcoming improvements can be found here.
Gains constantly add new features and change pairs. It's an interesting protocol.
Conclusion
Next bull run, watch decentralized perpetual protocols. Effective tokenomics and non-inflationary yields may attract traders and liquidity providers. But still, there is a long way for them to develop, and I don't see them tackling the centralized exchanges any time soon until they fix their inherent problems and improve fast enough.
Read the full post here.
You might also like

Darius Foroux
3 years ago
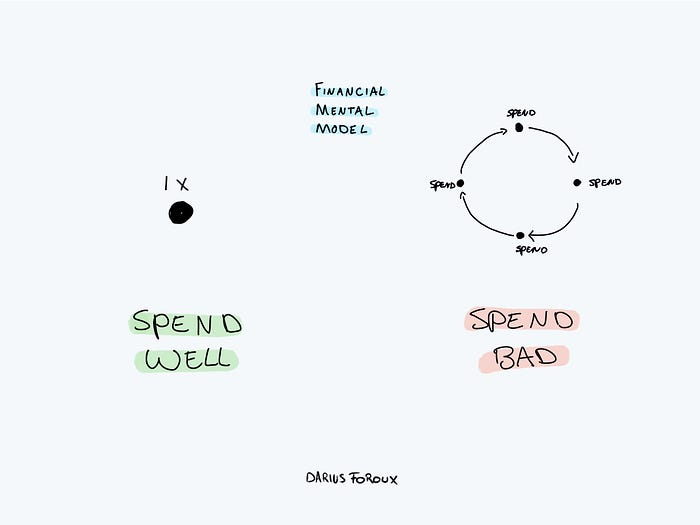
My financial life was changed by a single, straightforward mental model.
Prioritize big-ticket purchases
I've made several spending blunders. I get sick thinking about how much money I spent.
My financial mental model was poor back then.
Stoicism and mindfulness keep me from attaching to those feelings. It still hurts.
Until four or five years ago, I bought a new winter jacket every year.
Ten years ago, I spent twice as much. Now that I have a fantastic, warm winter parka, I don't even consider acquiring another one. No more spending. I'm not looking for jackets either.
Saving time and money by spending well is my thinking paradigm.
The philosophy is expressed in most languages. Cheap is expensive in the Netherlands. This applies beyond shopping.
In this essay, I will offer three examples of how this mental paradigm transformed my financial life.
Publishing books
In 2015, I presented and positioned my first book poorly.
I called the book Huge Life Success and made a funny Canva cover in 30 minutes. This:

That looks nothing like my present books. No logo or style. The book felt amateurish.
The book started bothering me a few weeks after publication. The advice was good, but it didn't appear professional. I studied the book business extensively.
I created a style for all my designs. Branding. Win Your Inner Wars was reissued a year later.
Title, cover, and description changed. Rearranging the chapters improved readability.
Seven years later, the book sells hundreds of copies a month. That taught me a lot.
Rushing to finish a project is enticing. Send it and move forward.
Avoid rushing everything. Relax. Develop your projects. Perform well. Perform the job well.
My first novel was underfunded and underworked. A bad book arrived. I then invested time and money in writing the greatest book I could.
That book still sells.
Traveling
I hate travel. Airports, flights, trains, and lines irritate me.
But, I enjoy traveling to beautiful areas.
I do it strangely. I make up travel rules. I never go to airports in summer. I hate being near airports on holidays. Unworthy.
No vacation packages for me. Those airline packages with a flight, shuttle, and hotel. I've had enough.
I try to avoid crowds and popular spots. July Paris? Nuts and bolts, please. Christmas in NYC? No, please keep me sane.
I fly business class behind. I accept upgrades upon check-in. I prefer driving. I drove from the Netherlands to southern Spain.
Thankfully, no lines. What if travel costs more? Thus? I enjoy it from the start. I start traveling then.
I rarely travel since I'm so difficult. One great excursion beats several average ones.
Personal effectiveness
New apps, tools, and strategies intrigue most productivity professionals.
No.
I researched years ago. I spent years investigating productivity in university.
I bought books, courses, applications, and tools. It was expensive and time-consuming.
Im finished. Productivity no longer costs me time or money. OK. I worked on it once and now follow my strategy.
I avoid new programs and systems. My stuff works. Why change winners?
Spending wisely saves time and money.
Spending wisely means spending once. Many people ignore productivity. It's understudied. No classes.
Some assume reading a few articles or a book is enough. Productivity is personal. You need a personal system.
Time invested is one-time. You can trust your system for life once you find it.
Concentrate on the expensive choices.
Life's short. Saving money quickly is enticing.
Spend less on groceries today. True. That won't fix your finances.
Adopt a lifestyle that makes you affluent over time. Consider major choices.
Are they causing long-term poverty? Are you richer?
Leasing cars comes to mind. The automobile costs a fortune today. The premium could accomplish a million nice things.
Focusing on important decisions makes life easier. Consider your future. You want to improve next year.

Jenn Leach
3 years ago
In November, I made an effort to pitch 10 brands per day. Here's what I discovered.
I pitched 10 brands per workday for a total of 200.
How did I do?
It was difficult.
I've never pitched so much.
What did this challenge teach me?
the superiority of quality over quantity
When you need help, outsource
Don't disregard burnout in order to complete a challenge because it exists.
First, pitching brands for brand deals requires quality. Find firms that align with your brand to expose to your audience.
If you associate with any company, you'll lose audience loyalty. I didn't lose sight of that, but I couldn't resist finishing the task.
Outsourcing.
Delegating work to teammates is effective.
I wish I'd done it.
Three people can pitch 200 companies a month significantly faster than one.
One person does research, one to two do outreach, and one to two do follow-up and negotiating.
Simple.
In 2022, I'll outsource everything.
Burnout.
I felt this, so I slowed down at the end of the month.
Thanksgiving week in November was slow.
I was buying and decorating for Christmas. First time putting up outdoor holiday lights was fun.
Much was happening.
I'm not perfect.
I'm being honest.
The Outcomes
Less than 50 brands pitched.
Result: A deal with 3 brands.
I hoped for 4 brands with reaching out to 200 companies, so three with under 50 is wonderful.
That’s a 6% conversion rate!
Whoo-hoo!
I needed 2%.
Here's a screenshot from one of the deals I booked.
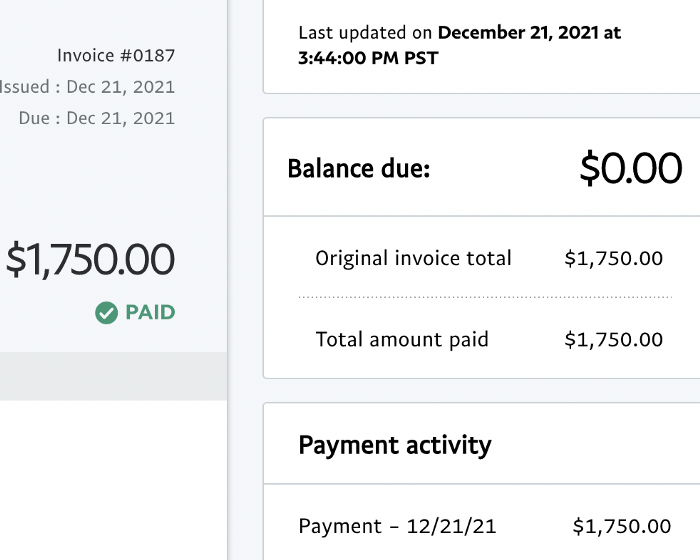
These companies fit my company well. Each campaign is different, but I've booked $2,450 in brand work with a couple of pending transactions for December and January.
$2,450 in brand work booked!
How did I do? You tell me.
Is this something you’d try yourself?

Katharine Valentino
4 years ago
A Gun-toting Teacher Is Like a Cook With Rat Poison
Pink or blue AR-15s?
A teacher teaches; a gun kills. Killing isn't teaching. Killing is opposite of teaching.
Without 27 school shootings this year, we wouldn't be talking about arming teachers. Gun makers, distributors, and the NRA cause most school shootings. Gun makers, distributors, and the NRA wouldn't be huge business if weapons weren't profitable.
Guns, ammo, body armor, holsters, concealed carriers, bore sights, cleaner kits, spare magazines and speed loaders, gun safes, and ear protection are sold. And more guns.
And lots more profit.
Guns aren't bread. You eat a loaf of bread in a week or so and then must buy more. Bread makers will make money. Winchester 94.30–30 1899 Lever Action Rifle from 1894 still kills. (For safety, I won't link to the ad.) Gun makers don't object if you collect antique weapons, but they need you to buy the latest, in-style killing machine. The youngster who killed 19 students and 2 teachers at Robb Elementary School in Uvalde, Texas, used an AR-15. Better yet, two.
Salvador Ramos, the Robb Elementary shooter, is a "killing influencer" He pushes consumers to buy items, which benefits manufacturers and distributors. Like every previous AR-15 influencer, he profits Colt, the rifle's manufacturer, and 52,779 gun dealers in the U.S. Ramos and other AR-15 influences make us fear for our safety and our children's. Fearing for our safety, we acquire 20 million firearms a year and live in a gun culture.
So now at school, we want to arm teachers.
Consider. Which of your teachers would you have preferred in body armor with a gun drawn?
Miss Summers? Remember her bringing daisies from her yard to second grade? She handed each student a beautiful flower. Miss Summers loved everyone, even those with AR-15s. She can't shoot.
Frasier? Mr. Frasier turned a youngster over down to explain "invert." Mr. Frasier's hands shook when he wasn't flipping fifth-graders and fractions. He may have shot wrong.
Mrs. Barkley barked in high school English class when anyone started an essay with "But." Mrs. Barkley dubbed Abie a "Jewboy" and gave him terrible grades. Arming Miss Barkley is like poisoning the chef.
Think back. Do you remember a teacher with a gun? No. Arming teachers so the gun industry can make more money is the craziest idea ever.
Or maybe you agree with Ted Cruz, the gun lobby-bought senator, that more guns reduce gun violence. After the next school shooting, you'll undoubtedly talk about arming teachers and pupils. Colt will likely develop a backpack-sized, lighter version of its popular killing machine in pink and blue for kids and boys. The MAR-15? (M for mini).
This post is a summary. Read the full one here.