


More on Science
Daniel Clery
3 years ago
Twisted device investigates fusion alternatives
German stellarator revamped to run longer, hotter, compete with tokamaks
Tokamaks have dominated the search for fusion energy for decades. Just as ITER, the world's largest and most expensive tokamak, nears completion in southern France, a smaller, twistier testbed will start up in Germany.
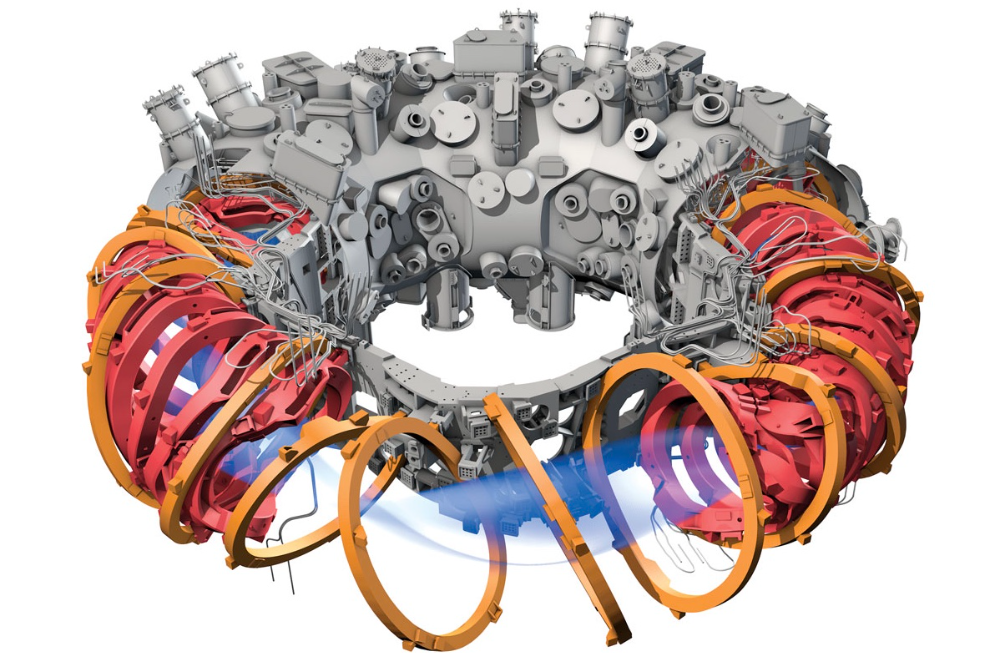
If the 16-meter-wide stellarator can match or outperform similar-size tokamaks, fusion experts may rethink their future. Stellarators can keep their superhot gases stable enough to fuse nuclei and produce energy. They can theoretically run forever, but tokamaks must pause to reset their magnet coils.
The €1 billion German machine, Wendelstein 7-X (W7-X), is already getting "tokamak-like performance" in short runs, claims plasma physicist David Gates, preventing particles and heat from escaping the superhot gas. If W7-X can go long, "it will be ahead," he says. "Stellarators excel" Eindhoven University of Technology theorist Josefine Proll says, "Stellarators are back in the game." A few of startup companies, including one that Gates is leaving Princeton Plasma Physics Laboratory, are developing their own stellarators.
W7-X has been running at the Max Planck Institute for Plasma Physics (IPP) in Greifswald, Germany, since 2015, albeit only at low power and for brief runs. W7-X's developers took it down and replaced all inner walls and fittings with water-cooled equivalents, allowing for longer, hotter runs. The team reported at a W7-X board meeting last week that the revised plasma vessel has no leaks. It's expected to restart later this month to show if it can get plasma to fusion-igniting conditions.
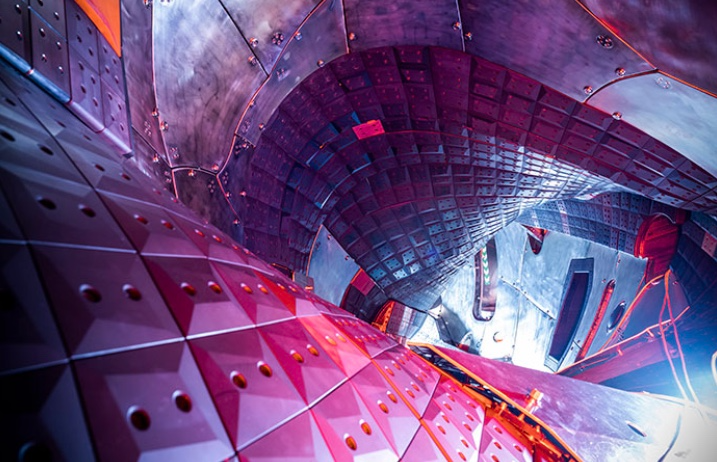
Wendelstein 7-X's water-cooled inner surface allows for longer runs.
HOSAN/IPP
Both stellarators and tokamaks create magnetic gas cages hot enough to melt metal. Microwaves or particle beams heat. Extreme temperatures create a plasma, a seething mix of separated nuclei and electrons, and cause the nuclei to fuse, releasing energy. A fusion power plant would use deuterium and tritium, which react quickly. Non-energy-generating research machines like W7-X avoid tritium and use hydrogen or deuterium instead.
Tokamaks and stellarators use electromagnetic coils to create plasma-confining magnetic fields. A greater field near the hole causes plasma to drift to the reactor's wall.
Tokamaks control drift by circulating plasma around a ring. Streaming creates a magnetic field that twists and stabilizes ionized plasma. Stellarators employ magnetic coils to twist, not plasma. Once plasma physicists got powerful enough supercomputers, they could optimize stellarator magnets to improve plasma confinement.
W7-X is the first large, optimized stellarator with 50 6- ton superconducting coils. Its construction began in the mid-1990s and cost roughly twice the €550 million originally budgeted.
The wait hasn't disappointed researchers. W7-X director Thomas Klinger: "The machine operated immediately." "It's a friendly machine." It did everything we asked." Tokamaks are prone to "instabilities" (plasma bulging or wobbling) or strong "disruptions," sometimes associated to halted plasma flow. IPP theorist Sophia Henneberg believes stellarators don't employ plasma current, which "removes an entire branch" of instabilities.
In early stellarators, the magnetic field geometry drove slower particles to follow banana-shaped orbits until they collided with other particles and leaked energy. Gates believes W7-X's ability to suppress this effect implies its optimization works.
W7-X loses heat through different forms of turbulence, which push particles toward the wall. Theorists have only lately mastered simulating turbulence. W7-X's forthcoming campaign will test simulations and turbulence-fighting techniques.
A stellarator can run constantly, unlike a tokamak, which pulses. W7-X has run 100 seconds—long by tokamak standards—at low power. The device's uncooled microwave and particle heating systems only produced 11.5 megawatts. The update doubles heating power. High temperature, high plasma density, and extensive runs will test stellarators' fusion power potential. Klinger wants to heat ions to 50 million degrees Celsius for 100 seconds. That would make W7-X "a world-class machine," he argues. The team will push for 30 minutes. "We'll move step-by-step," he says.
W7-X's success has inspired VCs to finance entrepreneurs creating commercial stellarators. Startups must simplify magnet production.
Princeton Stellarators, created by Gates and colleagues this year, has $3 million to build a prototype reactor without W7-X's twisted magnet coils. Instead, it will use a mosaic of 1000 HTS square coils on the plasma vessel's outside. By adjusting each coil's magnetic field, operators can change the applied field's form. Gates: "It moves coil complexity to the control system." The company intends to construct a reactor that can fuse cheap, abundant deuterium to produce neutrons for radioisotopes. If successful, the company will build a reactor.
Renaissance Fusion, situated in Grenoble, France, raised €16 million and wants to coat plasma vessel segments in HTS. Using a laser, engineers will burn off superconductor tracks to carve magnet coils. They want to build a meter-long test segment in 2 years and a full prototype by 2027.
Type One Energy in Madison, Wisconsin, won DOE money to bend HTS cables for stellarator magnets. The business carved twisting grooves in metal with computer-controlled etching equipment to coil cables. David Anderson of the University of Wisconsin, Madison, claims advanced manufacturing technology enables the stellarator.
Anderson said W7-X's next phase will boost stellarator work. “Half-hour discharges are steady-state,” he says. “This is a big deal.”

Jack Burns
3 years ago
Here's what to expect from NASA Artemis 1 and why it's significant.
NASA's Artemis 1 mission will help return people to the Moon after a half-century break. The mission is a shakedown cruise for NASA's Space Launch System and Orion Crew Capsule.
The spaceship will visit the Moon, deploy satellites, and enter orbit. NASA wants to practice operating the spacecraft, test the conditions people will face on the Moon, and ensure a safe return to Earth.
We asked Jack Burns, a space scientist at the University of Colorado Boulder and former member of NASA's Presidential Transition Team, to describe the mission, explain what the Artemis program promises for space exploration, and reflect on how the space program has changed in the half-century since humans last set foot on the moon.
What distinguishes Artemis 1 from other rockets?
Artemis 1 is the Space Launch System's first launch. NASA calls this a "heavy-lift" vehicle. It will be more powerful than Apollo's Saturn V, which transported people to the Moon in the 1960s and 1970s.
It's a new sort of rocket system with two strap-on solid rocket boosters from the space shuttle. It's a mix of the shuttle and Saturn V.
The Orion Crew Capsule will be tested extensively. It'll spend a month in the high-radiation Moon environment. It will also test the heat shield, which protects the capsule and its occupants at 25,000 mph. The heat shield must work well because this is the fastest capsule descent since Apollo.
This mission will also carry miniature Moon-orbiting satellites. These will undertake vital precursor science, including as examining further into permanently shadowed craters where scientists suspect there is water and measuring the radiation environment to see long-term human consequences.
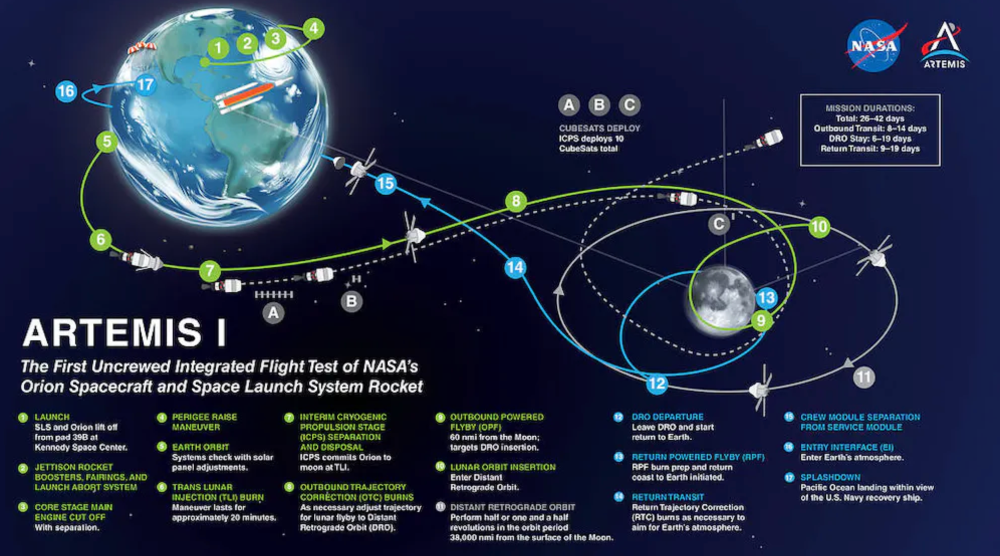
Artemis 1 will launch, fly to the Moon, place satellites, orbit it, return to Earth, and splash down in the ocean. NASA.
What's Artemis's goal? What launches are next?
The mission is a first step toward Artemis 3, which will lead to the first human Moon missions since 1972. Artemis 1 is unmanned.
Artemis 2 will have astronauts a few years later. Like Apollo 8, it will be an orbital mission that circles the Moon and returns. The astronauts will orbit the Moon longer and test everything with a crew.
Eventually, Artemis 3 will meet with the SpaceX Starship on the Moon's surface and transfer people. Orion will stay in orbit while the lunar Starship lands astronauts. They'll go to the Moon's south pole to investigate the water ice there.
Artemis is reminiscent of Apollo. What's changed in 50 years?
Kennedy wanted to beat the Soviets to the Moon with Apollo. The administration didn't care much about space flight or the Moon, but the goal would place America first in space and technology.
You live and die by the sword if you do that. When the U.S. reached the Moon, it was over. Russia lost. We planted flags and did science experiments. Richard Nixon canceled the program after Apollo 11 because the political goals were attained.
Large rocket with two boosters between two gates
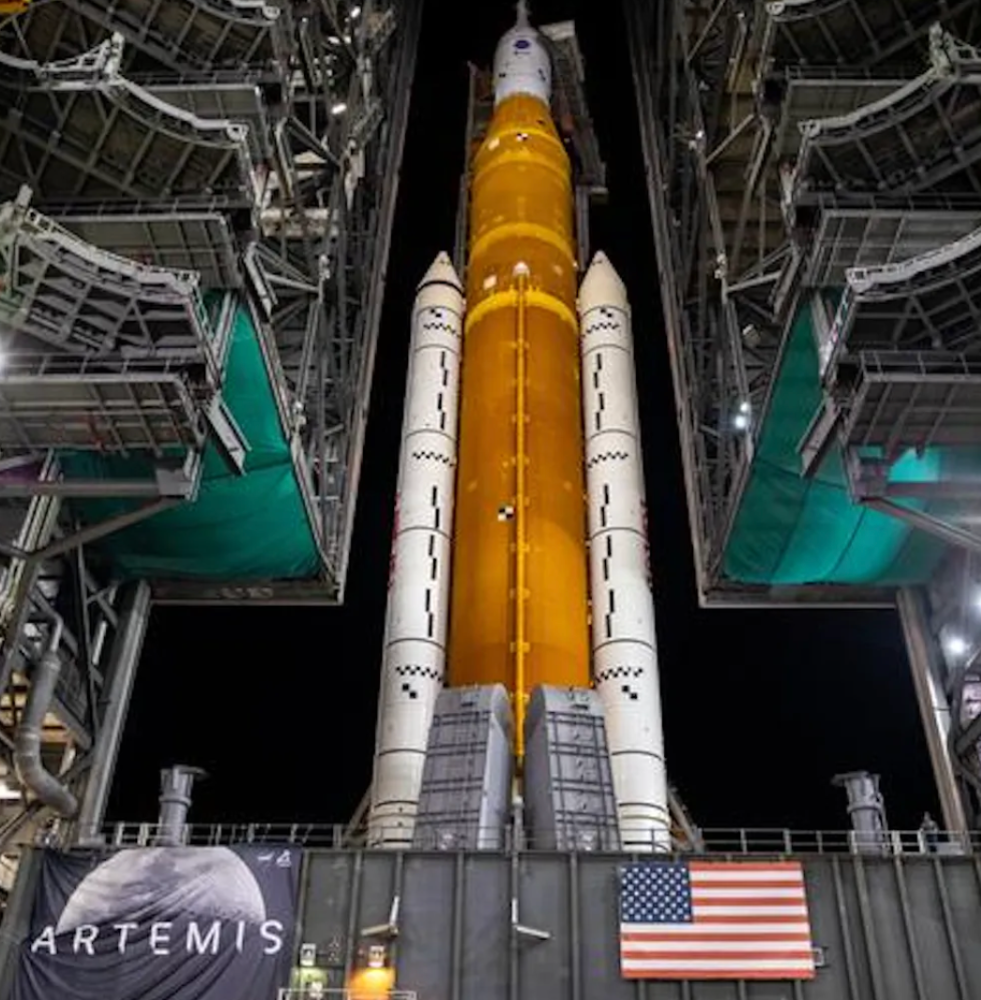
NASA's new Space Launch System is brought to a launchpad. NASA
50 years later... It's quite different. We're not trying to beat the Russians, Chinese, or anyone else, but to begin sustainable space exploration.
Artemis has many goals. It includes harnessing in-situ resources like water ice and lunar soil to make food, fuel, and building materials.
SpaceX is part of this first journey to the Moon's surface, therefore the initiative is also helping to develop a lunar and space economy. NASA doesn't own the Starship but is buying seats for astronauts. SpaceX will employ Starship to transport cargo, private astronauts, and foreign astronauts.
Fifty years of technology advancement has made getting to the Moon cheaper and more practical, and computer technology allows for more advanced tests. 50 years of technological progress have changed everything. Anyone with enough money can send a spacecraft to the Moon, but not humans.
Commercial Lunar Payload Services engages commercial companies to develop uncrewed Moon landers. We're sending a radio telescope to the Moon in January. Even 10 years ago, that was impossible.
Since humans last visited the Moon 50 years ago, technology has improved greatly.
What other changes does Artemis have in store?
The government says Artemis 3 will have at least one woman and likely a person of color.
I'm looking forward to seeing more diversity so young kids can say, "Hey, there's an astronaut that looks like me. I can do this. I can be part of the space program.”

Nojus Tumenas
3 years ago
NASA: Strange Betelgeuse Explosion Just Took Place

Orion's red supergiant Betelgeuse erupted. This is astronomers' most magnificent occurrence.
Betelgeuse, a supergiant star in Orion, garnered attention in 2019 for its peculiar appearance. It continued to dim in 2020.
The star was previously thought to explode as a supernova. Studying the event has revealed what happened to Betelgeuse since it happened.
Astronomers saw that the star released a large amount of material, causing it to lose a section of its surface.
They have never seen anything like this and are unsure what caused the star to release so much material.
According to Harvard-Smithsonian Center for Astrophysics astrophysicist Andrea Dupre, astronomers' data reveals an unexplained mystery.
They say it's a new technique to examine star evolution. The James Webb telescope revealed the star's surface features.
Corona flares are stellar mass ejections. These eruptions change the Sun's outer atmosphere.
This could affect power grids and satellite communications if it hits Earth.
Betelgeuse's flare ejected four times more material than the Sun's corona flare.
Astronomers have monitored star rhythms for 50 years. They've seen its dimming and brightening cycle start, stop, and repeat.
Monitoring Betelgeuse's pulse revealed the eruption's power.
Dupre believes the star's convection cells are still amplifying the blast's effects, comparing it to an imbalanced washing machine tub.
The star's outer layer has returned to normal, Hubble data shows. The photosphere slowly rebuilds its springy surface.
Dupre noted the star's unusual behavior. For instance, it’s causing its interior to bounce.
This suggests that the mass ejections that caused the star's surface to lose mass were two separate processes.
Researchers hope to better understand star mass ejection with the James Webb Space Telescope.
You might also like
Jared A. Brock
4 years ago
Here is the actual reason why Russia invaded Ukraine
Democracy's demise
Our Ukrainian brothers and sisters are being attacked by a far superior force.
It's the biggest invasion since WWII.
43.3 million peaceful Ukrainians awoke this morning to tanks, mortars, and missiles. Russia is already 15 miles away.
America and the West will not deploy troops.
They're sanctioning. Except railways. And luxuries. And energy. Diamonds. Their dependence on Russian energy exports means they won't even cut Russia off from SWIFT.
Ukraine is desperate enough to hand out guns on the street.
France, Austria, Turkey, and the EU are considering military aid, but Ukraine will fall without America or NATO.
The Russian goal is likely to encircle Kyiv and topple Zelenskyy's government. A proxy power will be reinstated once Russia has total control.
“Western security services believe Putin intends to overthrow the government and install a puppet regime,” says Financial Times foreign affairs commentator Gideon Rachman. This “decapitation” strategy includes municipalities. Ukrainian officials are being targeted for arrest or death.”
Also, Putin has never lost a war.
Why is Russia attacking Ukraine?
Putin, like a snowflake college student, “feels unsafe.”
Why?
Because Ukraine is full of “Nazi ideas.”
Putin claims he has felt threatened by Ukraine since the country's pro-Putin leader was ousted and replaced by a popular Jewish comedian.
Hee hee
He fears a full-scale enemy on his doorstep if Ukraine joins NATO. But he refuses to see it both ways. NATO has never invaded Russia, but Russia has always stolen land from its neighbors. Can you blame them for joining a mutual defense alliance when a real threat exists?
Nations that feel threatened can join NATO. That doesn't justify an attack by Russia. It allows them to defend themselves. But NATO isn't attacking Moscow. They aren't.
Russian President Putin's "special operation" aims to de-Nazify the Jewish-led nation.
To keep Crimea and the other two regions he has already stolen, he wants Ukraine undefended by NATO.
(Warlords have fought for control of the strategically important Crimea for over 2,000 years.)
Putin wants to own all of Ukraine.
Why?
The Black Sea is his goal.
Ports bring money and power, and Ukraine pipelines transport Russian energy products.
Putin wants their wheat, too — with 70% crop coverage, Ukraine would be their southern breadbasket, and Russia has no qualms about starving millions of Ukrainians to death to feed its people.
In the end, it's all about greed and power.
Putin wants to own everything Russia has ever owned. This year he turns 70, and he wants to be remembered like his hero Peter the Great.
In order to get it, he's willing to kill thousands of Ukrainians
Art imitates life
This story began when a Jewish TV comedian portrayed a teacher elected President after ranting about corruption.
Servant of the People, the hit sitcom, is now the leading centrist political party.
Right, President Zelenskyy won the hearts and minds of Ukrainians by imagining a fairer world.
A fair fight is something dictators, corporatists, monopolists, and warlords despise.
Now Zelenskyy and his people will die, allowing one of history's most corrupt leaders to amass even more power.
The poor always lose
Meanwhile, the West will impose economic sanctions on Russia.
China is likely to step in to help Russia — or at least the wealthy.
The poor and working class in Russia will suffer greatly if there is a hard crash or long-term depression.
Putin's friends will continue to drink champagne and eat caviar.
Russia cutting off oil, gas, and fertilizer could cause more inflation and possibly a recession if it cuts off supplies to the West. This causes more suffering and hardship for the Western poor and working class.
Why? a billionaire sociopath gets his dirt.
Yes, Russia is simply copying America. Some of us think all war is morally wrong, regardless of who does it.
But let's not kid ourselves right now.
The markets rallied after the biggest invasion in Europe since WWII.
Investors hope Ukraine collapses and Russian oil flows.
Unbridled capitalists value lifeless.
What we can do about Ukraine
When the Russian army invaded eastern Finland, my wife's grandmother fled as a child. 80 years later, Russia still has Karelia.
Russia invaded Ukraine today to retake two eastern provinces.
History has taught us nothing.
Past mistakes won't fix the future.
Instead, we should try:
- Pray and/or meditate on our actions with our families.
- Stop buying Russian products (vodka, obviously, but also pay more for hydro/solar/geothermal/etc.)
- Stop wasting money on frivolous items and donate it to Ukrainian charities.
Here are 35+ places to donate.
- To protest, gather a few friends, contact the media, and shake signs in front of the Russian embassy.
- Prepare to welcome refugees.
More war won't save the planet or change hearts.
Only love can work.

Justin Kuepper
4 years ago
Day Trading Introduction
Historically, only large financial institutions, brokerages, and trading houses could actively trade in the stock market. With instant global news dissemination and low commissions, developments such as discount brokerages and online trading have leveled the playing—or should we say trading—field. It's never been easier for retail investors to trade like pros thanks to trading platforms like Robinhood and zero commissions.
Day trading is a lucrative career (as long as you do it properly). But it can be difficult for newbies, especially if they aren't fully prepared with a strategy. Even the most experienced day traders can lose money.
So, how does day trading work?
Day Trading Basics
Day trading is the practice of buying and selling a security on the same trading day. It occurs in all markets, but is most common in forex and stock markets. Day traders are typically well educated and well funded. For small price movements in highly liquid stocks or currencies, they use leverage and short-term trading strategies.
Day traders are tuned into short-term market events. News trading is a popular strategy. Scheduled announcements like economic data, corporate earnings, or interest rates are influenced by market psychology. Markets react when expectations are not met or exceeded, usually with large moves, which can help day traders.
Intraday trading strategies abound. Among these are:
- Scalping: This strategy seeks to profit from minor price changes throughout the day.
- Range trading: To determine buy and sell levels, range traders use support and resistance levels.
- News-based trading exploits the increased volatility around news events.
- High-frequency trading (HFT): The use of sophisticated algorithms to exploit small or short-term market inefficiencies.
A Disputed Practice
Day trading's profit potential is often debated on Wall Street. Scammers have enticed novices by promising huge returns in a short time. Sadly, the notion that trading is a get-rich-quick scheme persists. Some daytrade without knowledge. But some day traders succeed despite—or perhaps because of—the risks.
Day trading is frowned upon by many professional money managers. They claim that the reward rarely outweighs the risk. Those who day trade, however, claim there are profits to be made. Profitable day trading is possible, but it is risky and requires considerable skill. Moreover, economists and financial professionals agree that active trading strategies tend to underperform passive index strategies over time, especially when fees and taxes are factored in.
Day trading is not for everyone and is risky. It also requires a thorough understanding of how markets work and various short-term profit strategies. Though day traders' success stories often get a lot of media attention, keep in mind that most day traders are not wealthy: Many will fail, while others will barely survive. Also, while skill is important, bad luck can sink even the most experienced day trader.
Characteristics of a Day Trader
Experts in the field are typically well-established professional day traders.
They usually have extensive market knowledge. Here are some prerequisites for successful day trading.
Market knowledge and experience
Those who try to day-trade without understanding market fundamentals frequently lose. Day traders should be able to perform technical analysis and read charts. Charts can be misleading if not fully understood. Do your homework and know the ins and outs of the products you trade.
Enough capital
Day traders only use risk capital they can lose. This not only saves them money but also helps them trade without emotion. To profit from intraday price movements, a lot of capital is often required. Most day traders use high levels of leverage in margin accounts, and volatile market swings can trigger large margin calls on short notice.
Strategy
A trader needs a competitive advantage. Swing trading, arbitrage, and trading news are all common day trading strategies. They tweak these strategies until they consistently profit and limit losses.
Strategy Breakdown:
Type | Risk | Reward
Swing Trading | High | High
Arbitrage | Low | Medium
Trading News | Medium | Medium
Mergers/Acquisitions | Medium | High
Discipline
A profitable strategy is useless without discipline. Many day traders lose money because they don't meet their own criteria. “Plan the trade and trade the plan,” they say. Success requires discipline.
Day traders profit from market volatility. For a day trader, a stock's daily movement is appealing. This could be due to an earnings report, investor sentiment, or even general economic or company news.
Day traders also prefer highly liquid stocks because they can change positions without affecting the stock's price. Traders may buy a stock if the price rises. If the price falls, a trader may decide to sell short to profit.
A day trader wants to trade a stock that moves (a lot).
Day Trading for a Living
Professional day traders can be self-employed or employed by a larger institution.
Most day traders work for large firms like hedge funds and banks' proprietary trading desks. These traders benefit from direct counterparty lines, a trading desk, large capital and leverage, and expensive analytical software (among other advantages). By taking advantage of arbitrage and news events, these traders can profit from less risky day trades before individual traders react.
Individual traders often manage other people’s money or simply trade with their own. They rarely have access to a trading desk, but they frequently have strong ties to a brokerage (due to high commissions) and other resources. However, their limited scope prevents them from directly competing with institutional day traders. Not to mention more risks. Individuals typically day trade highly liquid stocks using technical analysis and swing trades, with some leverage.
Day trading necessitates access to some of the most complex financial products and services. Day traders usually need:
Access to a trading desk
Traders who work for large institutions or manage large sums of money usually use this. The trading or dealing desk provides these traders with immediate order execution, which is critical during volatile market conditions. For example, when an acquisition is announced, day traders interested in merger arbitrage can place orders before the rest of the market.
News sources
The majority of day trading opportunities come from news, so being the first to know when something significant happens is critical. It has access to multiple leading newswires, constant news coverage, and software that continuously analyzes news sources for important stories.
Analytical tools
Most day traders rely on expensive trading software. Technical traders and swing traders rely on software more than news. This software's features include:
-
Automatic pattern recognition: It can identify technical indicators like flags and channels, or more complex indicators like Elliott Wave patterns.
-
Genetic and neural applications: These programs use neural networks and genetic algorithms to improve trading systems and make more accurate price predictions.
-
Broker integration: Some of these apps even connect directly to the brokerage, allowing for instant and even automatic trade execution. This reduces trading emotion and improves execution times.
-
Backtesting: This allows traders to look at past performance of a strategy to predict future performance. Remember that past results do not always predict future results.
Together, these tools give traders a competitive advantage. It's easy to see why inexperienced traders lose money without them. A day trader's earnings potential is also affected by the market in which they trade, their capital, and their time commitment.
Day Trading Risks
Day trading can be intimidating for the average investor due to the numerous risks involved. The SEC highlights the following risks of day trading:
Because day traders typically lose money in their first months of trading and many never make profits, they should only risk money they can afford to lose.
Trading is a full-time job that is stressful and costly: Observing dozens of ticker quotes and price fluctuations to spot market trends requires intense concentration. Day traders also spend a lot on commissions, training, and computers.
Day traders heavily rely on borrowing: Day-trading strategies rely on borrowed funds to make profits, which is why many day traders lose everything and end up in debt.
Avoid easy profit promises: Avoid “hot tips” and “expert advice” from day trading newsletters and websites, and be wary of day trading educational seminars and classes.
Should You Day Trade?
As stated previously, day trading as a career can be difficult and demanding.
- First, you must be familiar with the trading world and know your risk tolerance, capital, and goals.
- Day trading also takes a lot of time. You'll need to put in a lot of time if you want to perfect your strategies and make money. Part-time or whenever isn't going to cut it. You must be fully committed.
- If you decide trading is for you, remember to start small. Concentrate on a few stocks rather than jumping into the market blindly. Enlarging your trading strategy can result in big losses.
- Finally, keep your cool and avoid trading emotionally. The more you can do that, the better. Keeping a level head allows you to stay focused and on track.
If you follow these simple rules, you may be on your way to a successful day trading career.
Is Day Trading Illegal?
Day trading is not illegal or unethical, but it is risky. Because most day-trading strategies use margin accounts, day traders risk losing more than they invest and becoming heavily in debt.
How Can Arbitrage Be Used in Day Trading?
Arbitrage is the simultaneous purchase and sale of a security in multiple markets to profit from small price differences. Because arbitrage ensures that any deviation in an asset's price from its fair value is quickly corrected, arbitrage opportunities are rare.
Why Don’t Day Traders Hold Positions Overnight?
Day traders rarely hold overnight positions for several reasons: Overnight trades require more capital because most brokers require higher margin; stocks can gap up or down on overnight news, causing big trading losses; and holding a losing position overnight in the hope of recovering some or all of the losses may be against the trader's core day-trading philosophy.
What Are Day Trader Margin Requirements?
Regulation D requires that a pattern day trader client of a broker-dealer maintain at all times $25,000 in equity in their account.
How Much Buying Power Does Day Trading Have?
Buying power is the total amount of funds an investor has available to trade securities. FINRA rules allow a pattern day trader to trade up to four times their maintenance margin excess as of the previous day's close.
The Verdict
Although controversial, day trading can be a profitable strategy. Day traders, both institutional and retail, keep the markets efficient and liquid. Though day trading is still popular among novice traders, it should be left to those with the necessary skills and resources.

Simone Basso
3 years ago
How I set up my teams to be successful
After 10 years of working in scale-ups, I've embraced a few concepts for scaling Tech and Product teams.
First, cross-functionalize teams. Product Managers represent the business, Product Designers the consumer, and Engineers build.
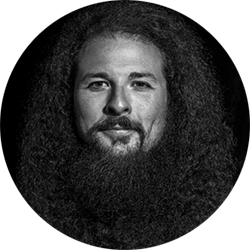
I organize teams of 5-10 individuals, following AWS's two pizza teams guidelines, with a Product Trio guiding each.
If more individuals are needed to reach a goal, I group teams under a Product Trio.
With Engineering being the biggest group, Staff/Principal Engineers often support the Trio on cross-team technical decisions.
Product Managers, Engineering Managers, or Engineers in the team may manage projects (depending on the project or aim), but the trio is collectively responsible for the team's output and outcome.
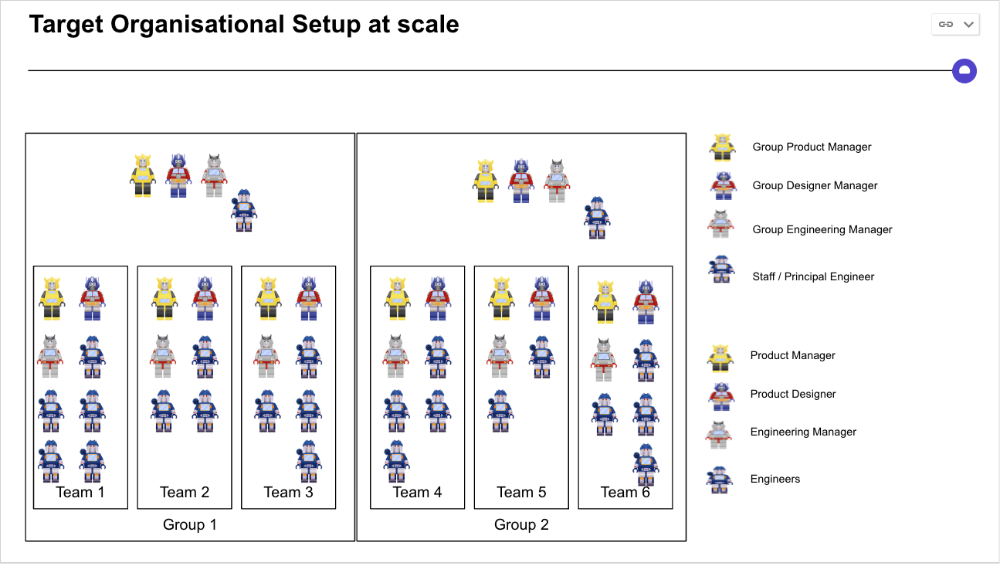
Once the Product Trio model is created, roles, duties, team ceremonies, and cooperation models must be clarified.
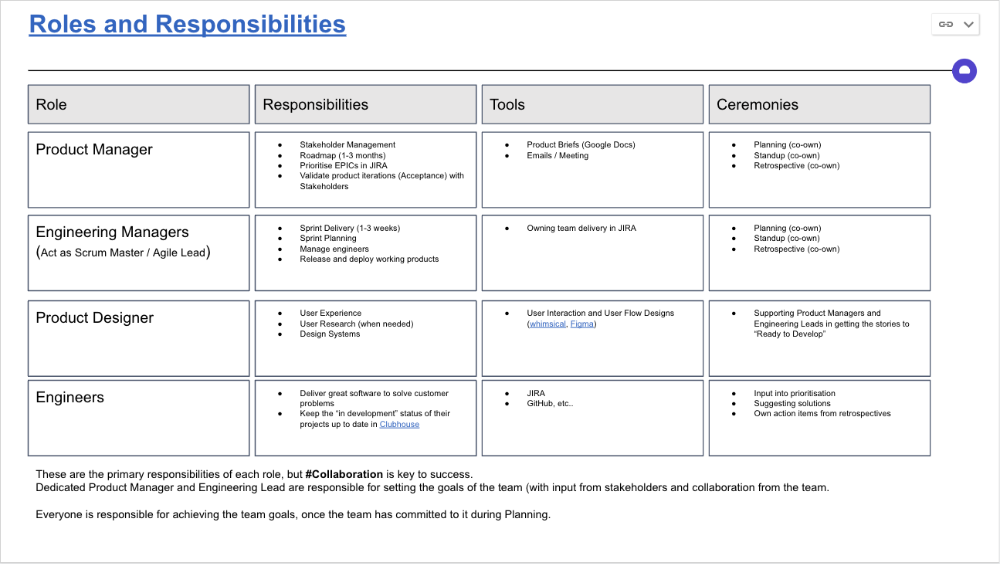
Keep reporting lines by discipline. Line managers are accountable for each individual's advancement, thus it's crucial that they know the work in detail.
Cross-team collaboration becomes more important after 3 teams (15-30 people). Teams can easily diverge in how they write code, run ceremonies, and build products.
Establishing groups of people that are cross-team, but grouped by discipline and skills, sharing and agreeing on working practices becomes critical.
The “Spotify Guild” model has been where I’ve taken a lot of my inspiration from.
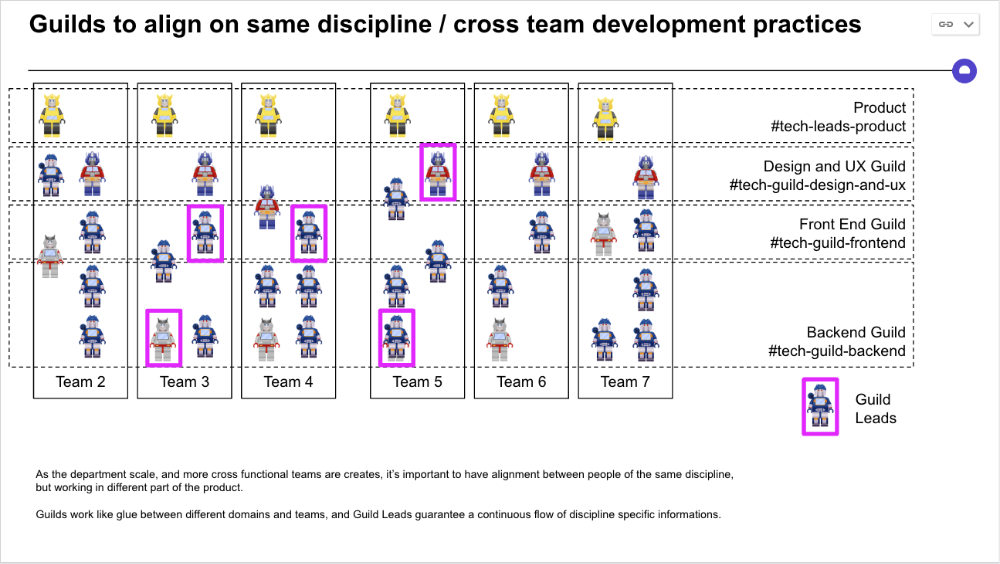
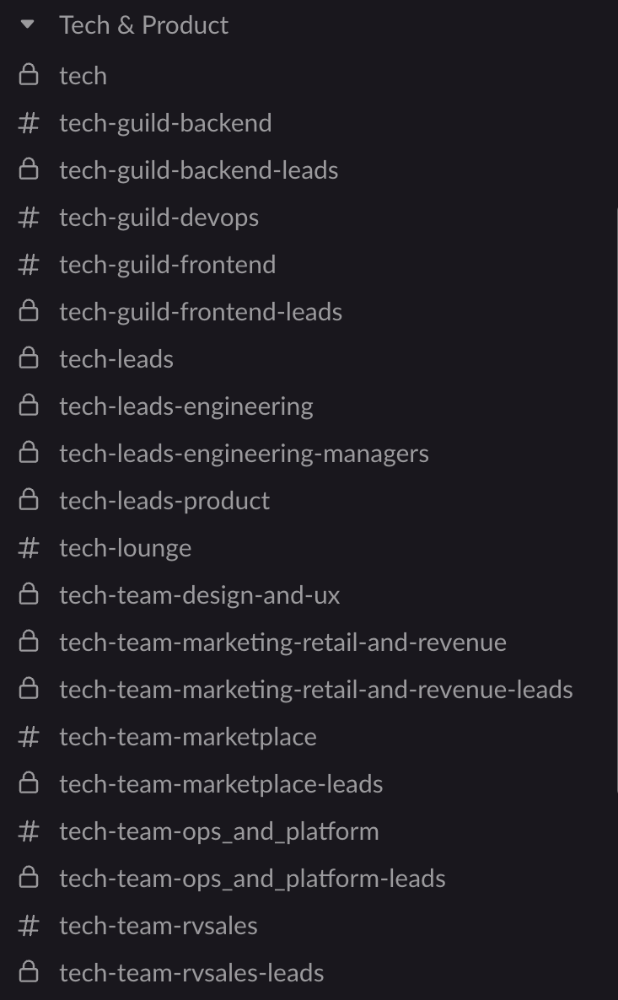
Last, establish a taxonomy for communication channels.
In Slack, I create one channel per team and one per guild (and one for me to have discussions with the team leads).
These are just some of the basic principles I follow to organize teams.
A book I particularly like about team types and how they interact with each other is https://teamtopologies.com/.