


More on Entrepreneurship/Creators

Keagan Stokoe
3 years ago
Generalists Create Startups; Specialists Scale Them
There’s a funny part of ‘Steve Jobs’ by Walter Isaacson where Jobs says that Bill Gates was more a copier than an innovator:
“Bill is basically unimaginative and has never invented anything, which is why I think he’s more comfortable now in philanthropy than technology. He just shamelessly ripped off other people’s ideas….He’d be a broader guy if he had dropped acid once or gone off to an ashram when he was younger.”
Gates lacked flavor. Nobody ever got excited about a Microsoft launch, despite their good products. Jobs had the world's best product taste. Apple vs. Microsoft.
A CEO's core job functions are all driven by taste: recruiting, vision, and company culture all require good taste. Depending on the type of company you want to build, know where you stand between Microsoft and Apple.
How can you improve your product judgment? How to acquire taste?

Test and refine
Product development follows two parallel paths: the ‘customer obsession’ path and the ‘taste and iterate’ path.
The customer obsession path involves solving customer problems. Lean Startup frameworks show you what to build at each step.
Taste-and-iterate doesn't involve the customer. You iterate internally and rely on product leaders' taste and judgment.
Creative Selection by Ken Kocienda explains this method. In Creative Selection, demos are iterated and presented to product leaders. Your boss presents to their boss, and so on up to Steve Jobs. If you have good product taste, you can be a panelist.
The iPhone follows this path. Before seeing an iPhone, consumers couldn't want one. Customer obsession wouldn't have gotten you far because iPhone buyers didn't know they wanted one.
In The Hard Thing About Hard Things, Ben Horowitz writes:
“It turns out that is exactly what product strategy is all about — figuring out the right product is the innovator’s job, not the customer’s job. The customer only knows what she thinks she wants based on her experience with the current product. The innovator can take into account everything that’s possible, but often must go against what she knows to be true. As a result, innovation requires a combination of knowledge, skill, and courage.“
One path solves a problem the customer knows they have, and the other doesn't. Instead of asking a person what they want, observe them and give them something they didn't know they needed.
It's much harder. Apple is the world's most valuable company because it's more valuable. It changes industries permanently.

If you want to build superior products, use the iPhone of your industry.
How to Improve Your Taste
I. Work for a company that has taste.
People with the best taste in products, markets, and people are rewarded for building great companies. Tasteful people know quality even when they can't describe it. Taste isn't writable. It's feel-based.
Moving into a community that's already doing what you want to do may be the best way to develop entrepreneurial taste. Most company-building knowledge is tacit.
Joining a company you want to emulate allows you to learn its inner workings. It reveals internal patterns intuitively. Many successful founders come from successful companies.
Consumption determines taste. Excellence will refine you. This is why restauranteurs visit the world's best restaurants and serious painters visit Paris or New York. Joining a company with good taste is beneficial.
2. Possess a wide range of interests
“Edwin Land of Polaroid talked about the intersection of the humanities and science. I like that intersection. There’s something magical about that place… The reason Apple resonates with people is that there’s a deep current of humanity in our innovation. I think great artists and great engineers are similar, in that they both have a desire to express themselves.” — Steve Jobs
I recently discovered Edwin Land. Jobs modeled much of his career after Land's. It makes sense that Apple was inspired by Land.
A Triumph of Genius: Edwin Land, Polaroid, and the Kodak Patent War notes:
“Land was introverted in person, but supremely confident when he came to his ideas… Alongside his scientific passions, lay knowledge of art, music, and literature. He was a cultured person growing even more so as he got older, and his interests filtered into the ethos of Polaroid.”
Founders' philosophies shape companies. Jobs and Land were invested. It showed in the products their companies made. Different. His obsession was spreading Microsoft software worldwide. Microsoft's success is why their products are bland and boring.
Experience is important. It's probably why startups are built by generalists and scaled by specialists.
Jobs combined design, typography, storytelling, and product taste at Apple. Some of the best original Mac developers were poets and musicians. Edwin Land liked broad-minded people, according to his biography. Physicist-musicians or physicist-photographers.
Da Vinci was a master of art, engineering, architecture, anatomy, and more. He wrote and drew at the same desk. His genius is remembered centuries after his death. Da Vinci's statue would stand at the intersection of humanities and science.
We find incredibly creative people here. Superhumans. Designers, creators, and world-improvers. These are the people we need to navigate technology and lead world-changing companies. Generalists lead.

Micah Daigle
3 years ago
Facebook is going away. Here are two explanations for why it hasn't been replaced yet.
And tips for anyone trying.

We see the same story every few years.
BREAKING NEWS: [Platform X] launched a social network. With Facebook's reputation down, the new startup bets millions will switch.
Despite the excitement surrounding each new platform (Diaspora, Ello, Path, MeWe, Minds, Vero, etc.), no major exodus occurred.
Snapchat and TikTok attracted teens with fresh experiences (ephemeral messaging and rapid-fire videos). These features aren't Facebook, even if Facebook replicated them.
Facebook's core is simple: you publish items (typically text/images) and your friends (generally people you know IRL) can discuss them.
It's cool. Sometimes I don't want to, but sh*t. I like it.
Because, well, I like many folks I've met. I enjoy keeping in touch with them and their banter.
I dislike Facebook's corporation. I've been cautiously optimistic whenever a Facebook-killer surfaced.
None succeeded.
Why? Two causes, I think:
People couldn't switch quickly enough, which is reason #1
Your buddies make a social network social.
Facebook started in self-contained communities (college campuses) then grew outward. But a new platform can't.
If we're expected to leave Facebook, we want to know that most of our friends will too.
Most Facebook-killers had bottlenecks. You have to waitlist or jump through hoops (e.g. setting up a server).
Same outcome. Upload. Chirp.
After a week or two of silence, individuals returned to Facebook.
Reason #2: The fundamental experience was different.
Even when many of our friends joined in the first few weeks, it wasn't the same.
There were missing features or a different UX.
Want to reply with a meme? No photos in comments yet. (Trying!)
Want to tag a friend? Nope, sorry. 2019!
Want your friends to see your post? You must post to all your friends' servers. Good luck!
It's difficult to introduce a platform with 100% of the same features as one that's been there for 20 years, yet customers want a core experience.
If you can't, they'll depart.
The causes that led to the causes
Having worked on software teams for 14+ years, I'm not surprised by these challenges. They are a natural development of a few tech sector meta-problems:
Lean startup methodology
Silicon Valley worships lean startup. It's a way of developing software that involves testing a stripped-down version with a limited number of people before selecting what to build.
Billion people use Facebook's functions. They aren't tested. It must work right away*
*This may seem weird to software people, but it's how non-software works! You can't sell a car without wheels.
2. Creativity
Startup entrepreneurs build new things, not copies. I understand. Reinventing the wheel is boring.
We know what works. Different experiences raise adoption friction. Once millions have transferred, more features (and a friendlier UX) can be implemented.
3. Cost scaling
True. Building a product that can sustain hundreds of millions of users in weeks is expensive and complex.
Your lifeboats must have the same capacity as the ship you're evacuating. It's required.
4. Pure ideologies
People who work on Facebook-alternatives are (understandably) critical of Facebook.
They build an open-source, fully-distributed, data-portable, interface-customizable, offline-capable, censorship-proof platform.
Prioritizing these aims can prevent replicating the straightforward experience users expect. Github, not Facebook, is for techies only.
What about the business plan, though?
Facebook-killer attempts have followed three models.
Utilize VC funding to increase your user base, then monetize them later. (If you do this, you won't kill Facebook; instead, Facebook will become you.)
Users must pay to utilize it. (This causes a huge bottleneck and slows the required quick expansion, preventing it from seeming like a true social network.)
Make it a volunteer-run, open-source endeavor that is free. (This typically denotes that something is cumbersome, difficult to operate, and is only for techies.)
Wikipedia is a fourth way.
Wikipedia is one of the most popular websites and a charity. No ads. Donations support them.
A Facebook-killer managed by a good team may gather millions (from affluent contributors and the crowd) for their initial phase of development. Then it might sustain on regular donations, ethical transactions (e.g. fees on commerce, business sites, etc.), and government grants/subsidies (since it would essentially be a public utility).
When you're not aiming to make investors rich, it's remarkable how little money you need.
If you want to build a Facebook competitor, follow these tips:
Drop the lean startup philosophy. Wait until you have a finished product before launching. Build it, thoroughly test it for bugs, and then release it.
Delay innovating. Wait till millions of people have switched before introducing your great new features. Make it nearly identical for now.
Spend money climbing. Make sure that guests can arrive as soon as they are invited. Never keep them waiting. Make things easy for them.
Make it accessible to all. Even if doing so renders it less philosophically pure, it shouldn't require technical expertise to utilize.
Constitute a nonprofit. Additionally, develop community ownership structures. Profit maximization is not the only strategy for preserving valued assets.
Last thoughts
Nobody has killed Facebook, but Facebook is killing itself.
The startup is burying the newsfeed to become a TikTok clone. Meta itself seems to be ditching the platform for the metaverse.
I wish I was happy, but I'm not. I miss (understandably) removed friends' postings and remarks. It could be a ghost town in a few years. My dance moves aren't TikTok-worthy.
Who will lead? It's time to develop a social network for the people.
Greetings if you're working on it. I'm not a company founder, but I like to help hard-working folks.

Greg Lim
4 years ago
How I made $160,000 from non-fiction books
I've sold over 40,000 non-fiction books on Amazon and made over $160,000 in six years while writing on the side.
I have a full-time job and three young sons; I can't spend 40 hours a week writing. This article describes my journey.
I write mainly tech books:
Thanks to my readers, many wrote positive evaluations. Several are bestsellers.
A few have been adopted by universities as textbooks:
My books' passive income allows me more time with my family.
Knowing I could quit my job and write full time gave me more confidence. And I find purpose in my work (i am in christian ministry).
I'm always eager to write. When work is a dread or something bad happens, writing gives me energy. Writing isn't scary. In fact, I can’t stop myself from writing!
Writing has also established my tech authority. Universities use my books, as I've said. Traditional publishers have asked me to write books.
These mindsets helped me become a successful nonfiction author:
1. You don’t have to be an Authority
Yes, I have computer science experience. But I'm no expert on my topics. Before authoring "Beginning Node.js, Express & MongoDB," my most profitable book, I had no experience with those topics. Node was a new server-side technology for me. Would that stop me from writing a book? It can. I liked learning a new technology. So I read the top three Node books, took the top online courses, and put them into my own book (which makes me know more than 90 percent of people already).
I didn't have to worry about using too much jargon because I was learning as I wrote. An expert forgets a beginner's hardship.
"The fellow learner can aid more than the master since he knows less," says C.S. Lewis. The problem he must explain is recent. The expert has forgotten.”
2. Solve a micro-problem (Niching down)
I didn't set out to write a definitive handbook. I found a market with several challenges and wrote one book. Ex:
- Instead of web development, what about web development using Angular?
- Instead of Blockchain, what about Blockchain using Solidity and React?
- Instead of cooking recipes, how about a recipe for a specific kind of diet?
- Instead of Learning math, what about Learning Singapore Math?
3. Piggy Backing Trends
The above topics may still be a competitive market. E.g. Angular, React. To stand out, include the latest technologies or trends in your book. Learn iOS 15 instead of iOS programming. Instead of personal finance, what about personal finance with NFTs.
Even though you're a newbie author, your topic is well-known.
4. Publish short books
My books are known for being direct. Many people like this:
Your reader will appreciate you cutting out the fluff and getting to the good stuff. A reader can finish and review your book.
Second, short books are easier to write. Instead of creating a 500-page book for $50 (which few will buy), write a 100-page book that answers a subset of the problem and sell it for less. (You make less, but that's another subject). At least it got published instead of languishing. Less time spent creating a book means less time wasted if it fails. Write a small-bets book portfolio like Daniel Vassallo!
Third, it's $2.99-$9.99 on Amazon (gets 70 percent royalties for ebooks). Anything less receives 35% royalties. $9.99 books have 20,000–30,000 words. If you write more and charge more over $9.99, you get 35% royalties. Why not make it a $9.99 book?
(This is the ebook version.) Paperbacks cost more. Higher royalties allow for higher prices.
5. Validate book idea
Amazon will tell you if your book concept, title, and related phrases are popular. See? Check its best-sellers list.
150,000 is preferable. It sells 2–3 copies daily. Consider your rivals. Profitable niches have high demand and low competition.
Don't be afraid of competitive niches. First, it shows high demand. Secondly, what are the ways you can undercut the completion? Better book? Or cheaper option? There was lots of competition in my NodeJS book's area. None received 4.5 stars or more. I wrote a NodeJS book. Today, it's a best-selling Node book.
What’s Next
So long. Part II follows. Meanwhile, I will continue to write more books!
Follow my journey on Twitter.
This post is a summary. Read full article here
You might also like

Al Anany
3 years ago
Notion AI Might Destroy Grammarly and Jasper
The trick Notion could use is simply Facebook-ing the hell out of them.
*Time travel to fifteen years ago.* Future-Me: “Hey! What are you up to?” Old-Me: “I am proofreading an article. It’s taking a few hours, but I will be done soon.” Future-Me: “You know, in the future, you will be using a google chrome plugin called Grammarly that will help you easily proofread articles in half that time.” Old-Me: “What is… Google Chrome?” Future-Me: “Gosh…”
I love Grammarly. It’s one of those products that I personally feel the effects of. I mean, Space X is a great company. But I am not a rocket writing this article in space (or am I?)…
No, I’m not. So I don’t personally feel a connection to Space X. So, if a company collapse occurs in the morning, I might write about it. But I will have zero emotions regarding it.
Yet, if Grammarly fails tomorrow, I will feel 1% emotionally distressed. So looking at the title of this article, you’d realize that I am betting against them. This is how much I believe in the critical business model that’s taking over the world, the one of Notion.
Notion How frequently do you go through your notes?
Grammarly is everywhere, which helps its success. Grammarly is available when you update LinkedIn on Chrome. Grammarly prevents errors in Google Docs.
My internal concentration isn't apparent in the previous paragraph. Not Grammarly. I should have used Chrome to make a Google doc and LinkedIn update. Without this base, Grammarly will be useless.
So, welcome to this business essay.
Grammarly provides a solution.
Another issue is resolved by Jasper.
Your entire existence is supposed to be contained within Notion.
New Google Chrome is offline. It's an all-purpose notepad (in the near future.)
How should I start my blog? Enter it in Note.
an update on LinkedIn? If you mention it, it might be automatically uploaded there (with little help from another app.)
An advanced thesis? You can brainstorm it with your coworkers.
This ad sounds great! I won't cry if Notion dies tomorrow.
I'll reread the following passages to illustrate why I think Notion could kill Grammarly and Jasper.
Notion is a fantastic app that incubates your work.
Smartly, they began with note-taking.
Hopefully, your work will be on Notion. Grammarly and Jasper are still must-haves.
Grammarly will proofread your typing while Jasper helps with copywriting and AI picture development.
They're the best, therefore you'll need them. Correct? Nah.
Notion might bombard them with Facebook posts.
Notion: “Hi Grammarly, do you want to sell your product to us?” Grammarly: “Dude, we are more valuable than you are. We’ve even raised $400m, while you raised $342m. Our last valuation round put us at $13 billion, while yours put you at $10 billion. Go to hell.” Notion: “Okay, we’ll speak again in five years.”
Notion: “Jasper, wanna sell?” Jasper: “Nah, we’re deep into AI and the field. You can’t compete with our people.” Notion: “How about you either sell or you turn into a Snapchat case?” Jasper: “…”
Notion is your home. Grammarly is your neighbor. Your track is Jasper.
What if you grew enough vegetables in your backyard to avoid the supermarket? No more visits.
What if your home had a beautiful treadmill? You won't rush outside as much (I disagree with my own metaphor). (You get it.)
It's Facebooking. Instagram Stories reduced your Snapchat usage. Notion will reduce your need to use Grammarly.
The Final Piece of the AI Puzzle
Let's talk about Notion first, since you've probably read about it everywhere.
They raised $343 million, as I previously reported, and bought four businesses
According to Forbes, Notion will have more than 20 million users by 2022. The number of users is up from 4 million in 2020.
If raising $1.8 billion was impressive, FTX wouldn't have fallen.
This article compares the basic product to two others. Notion is a day-long app.
Notion has released Notion AI to support writers. It's early, so it's not as good as Jasper. Then-Jasper isn't now-Jasper. In five years, Notion AI will be different.
With hard work, they may construct a Jasper-like writing assistant. They have resources and users.
At this point, it's all speculation. Jasper's copywriting is top-notch. Grammarly's proofreading is top-notch. Businesses are constrained by user activities.
If Notion's future business movements are strategic, they might become a blue ocean shark (or get acquired by an unbelievable amount.)
I love business mental teasers, so tell me:
How do you feel? Are you a frequent Notion user?
Do you dispute my position? I enjoy hearing opposing viewpoints.
Ironically, I proofread this with Grammarly.

TheRedKnight
3 years ago
Say goodbye to Ponzi yields - A new era of decentralized perpetual
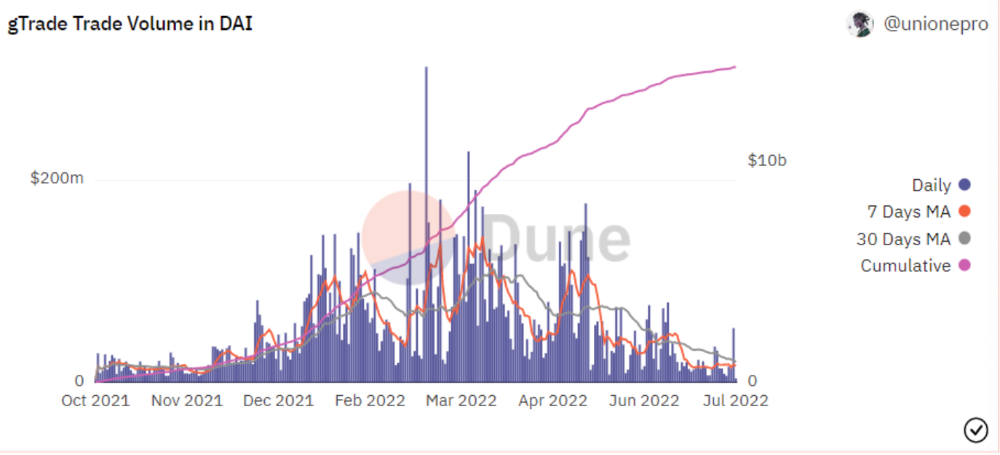
Decentralized perpetual may be the next crypto market boom; with tons of perpetual popping up, let's look at two protocols that offer organic, non-inflationary yields.
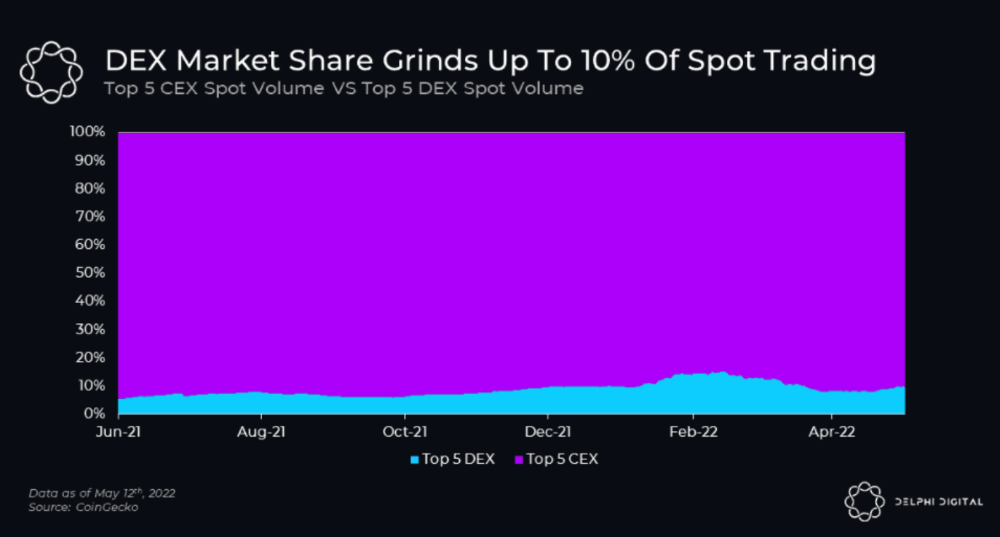
Decentralized derivatives exchanges' market share has increased tenfold in a year, but it's still 2% of CEXs'. DEXs have a long way to go before they can compete with centralized exchanges in speed, liquidity, user experience, and composability.
I'll cover gains.trade and GMX protocol in Polygon, Avalanche, and Arbitrum. Both protocols support leveraged perpetual crypto, stock, and Forex trading.
Why these protocols?
Decentralized GMX Gains protocol
Organic yield: path to sustainability
I've never trusted Defi's non-organic yields. Example: XYZ protocol. 20–75% of tokens may be set aside as farming rewards to provide liquidity, according to tokenomics.
Say you provide ETH-USDC liquidity. They advertise a 50% APR reward for this pair, 10% from trading fees and 40% from farming rewards. Only 10% is real, the rest is "Ponzi." The "real" reward is in protocol tokens.
Why keep this token? Governance voting or staking rewards are promoted services.
Most liquidity providers expect compensation for unused tokens. Basic psychological principles then? — Profit.
Nobody wants governance tokens. How many out of 100 care about the protocol's direction and will vote?
Staking increases your token's value. Currently, they're mostly non-liquid. If the protocol is compromised, you can't withdraw funds. Most people are sceptical of staking because of this.
"Free tokens," lack of use cases, and skepticism lead to tokens moving south. No farming reward protocols have lasted.
It may have shown strength in a bull market, but what about a bear market?
What is decentralized perpetual?
A perpetual contract is a type of futures contract that doesn't expire. So one can hold a position forever.
You can buy/sell any leveraged instruments (Long-Short) without expiration.
In centralized exchanges like Binance and coinbase, fees and revenue (liquidation) go to the exchanges, not users.
Users can provide liquidity that traders can use to leverage trade, and the revenue goes to liquidity providers.
Gains.trade and GMX protocol are perpetual trading platforms with a non-inflationary organic yield for liquidity providers.
GMX protocol
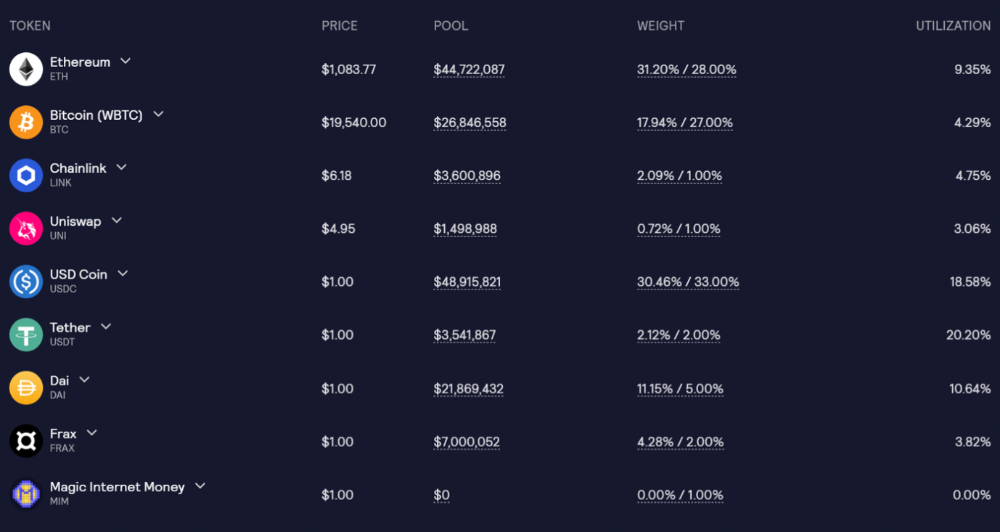
GMX is an Arbitrum and Avax protocol that rewards in ETH and Avax. GLP uses a fast oracle to borrow the "true price" from other trading venues, unlike a traditional AMM.
GLP and GMX are protocol tokens. GLP is used for leveraged trading, swapping, etc.
GLP is a basket of tokens, including ETH, BTC, AVAX, stablecoins, and UNI, LINK, and Stablecoins.
GLP composition on arbitrum
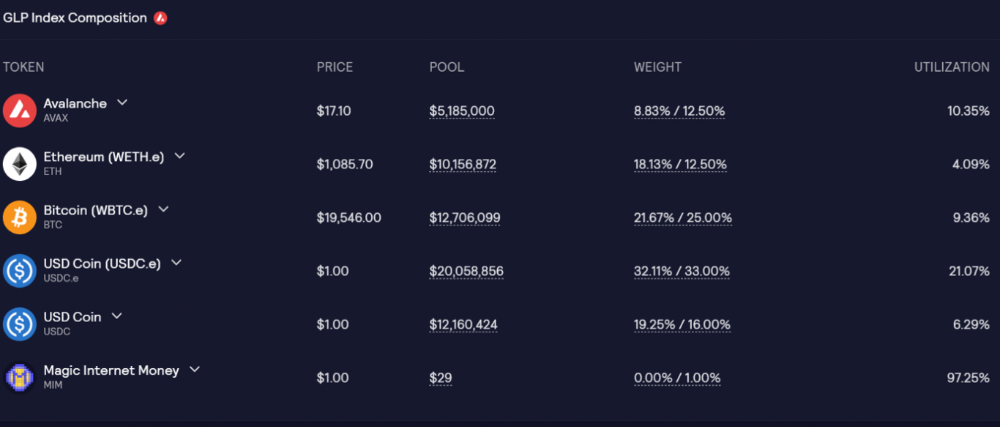
GLP composition on Avalanche
GLP token rebalances based on usage, providing liquidity without loss.
Protocol "runs" on Staking GLP. Depending on their chain, the protocol will reward users with ETH or AVAX. Current rewards are 22 percent (15.71 percent in ETH and the rest in escrowed GMX) and 21 percent (15.72 percent in AVAX and the rest in escrowed GMX). escGMX and ETH/AVAX percentages fluctuate.
Where is the yield coming from?
Swap fees, perpetual interest, and liquidations generate yield. 70% of fees go to GLP stakers, 30% to GMX. Organic yields aren't paid in inflationary farm tokens.
Escrowed GMX is vested GMX that unlocks in 365 days. To fully unlock GMX, you must farm the Escrowed GMX token for 365 days. That means less selling pressure for the GMX token.
GMX's status
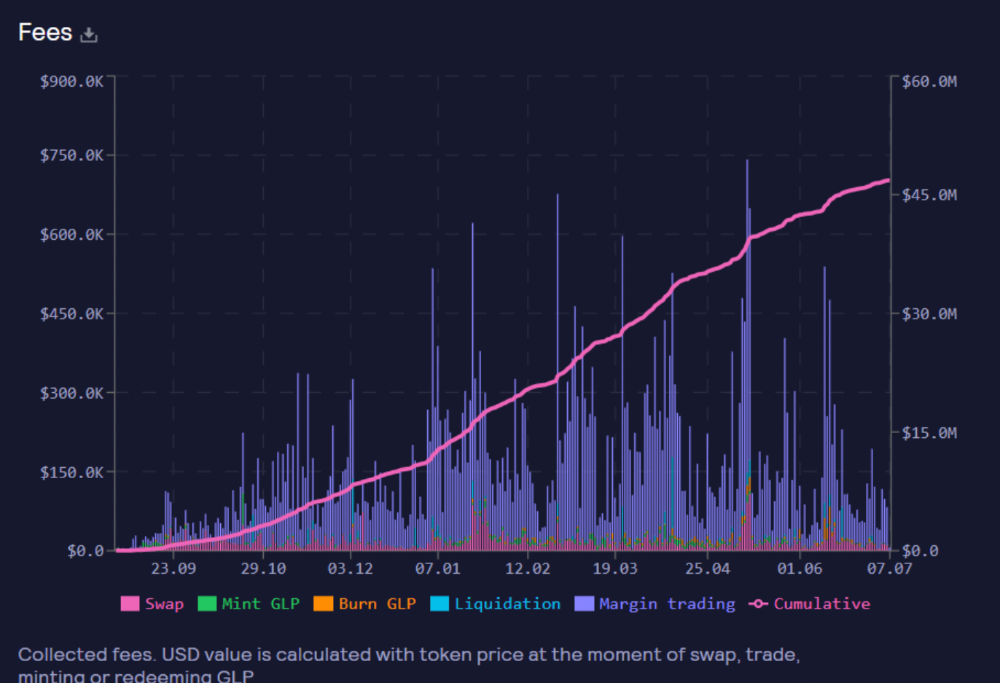
These are the fees in Arbitrum in the past 11 months by GMX.
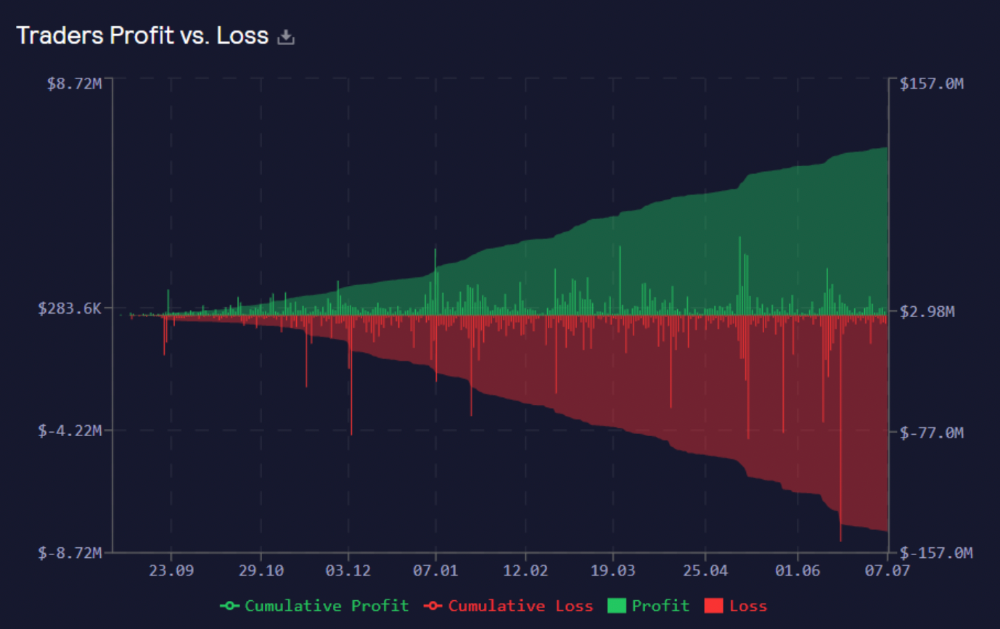
GMX works like a casino, which increases fees. Most fees come from Margin trading, which means most traders lose money; this money goes to the casino, or GLP stakers.
Strategies
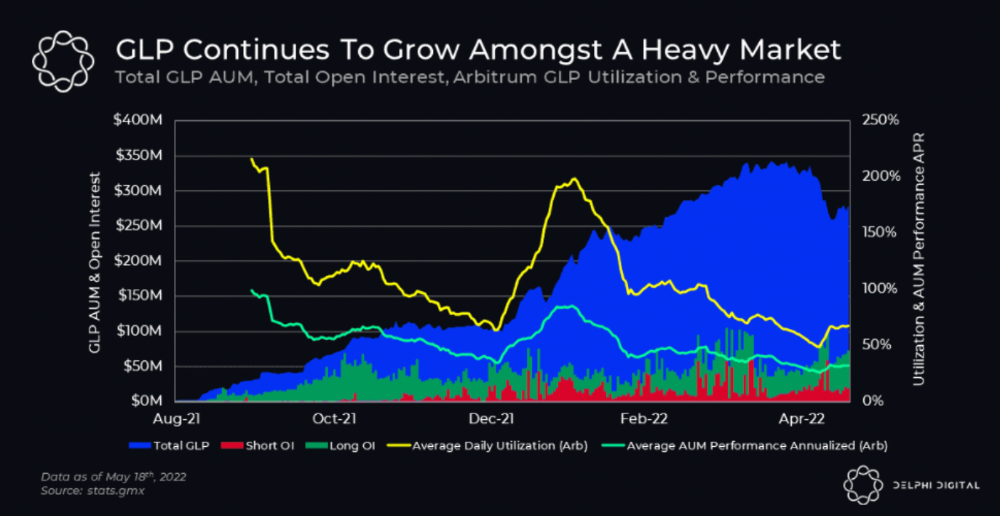
My personal strategy is to DCA into GLP when markets hit bottom and stake it; GLP will be less volatile with extra staking rewards.
GLP YoY return vs. naked buying
Let's say I invested $10,000 in BTC, AVAX, and ETH in January.
BTC price: 47665$
ETH price: 3760$
AVAX price: $145
Current prices
BTC $21,000 (Down 56 percent )
ETH $1233 (Down 67.2 percent )
AVAX $20.36 (Down 85.95 percent )
Your $10,000 investment is now worth around $3,000.
How about GLP? My initial investment is 50% stables and 50% other assets ( Assuming the coverage ratio for stables is 50 percent at that time)
Without GLP staking yield, your value is $6500.
Let's assume the average APR for GLP staking is 23%, or $1500. So 8000$ total. It's 50% safer than holding naked assets in a bear market.
In a bull market, naked assets are preferable to GLP.
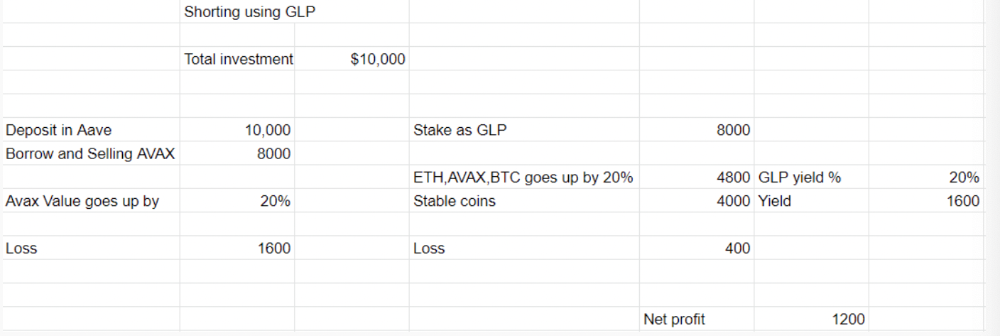
Short farming using GLP
Simple GLP short farming.
You use a stable asset as collateral to borrow AVAX. Sell it and buy GLP. Even if GLP rises, it won't rise as fast as AVAX, so we can get yields.
Let's do the maths
You deposit $10,000 USDT in Aave and borrow Avax. Say you borrow $8,000; you sell it, buy GLP, and risk 20%.
After a year, ETH, AVAX, and BTC rise 20%. GLP is $8800. $800 vanishes. 20% yields $1600. You're profitable. Shorting Avax costs $1600. (Assumptions-ETH, AVAX, BTC move the same, GLP yield is 20%. GLP has a 50:50 stablecoin/others ratio. Aave won't liquidate
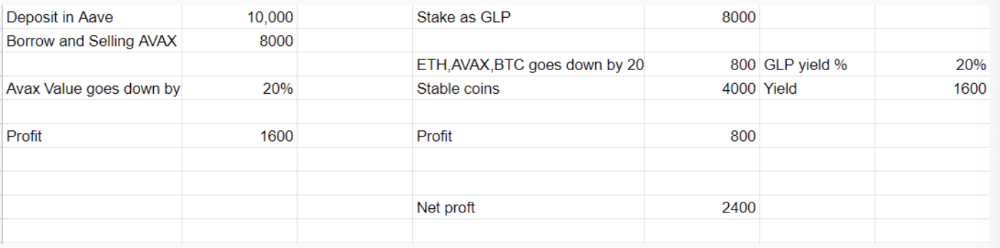
In naked Avax shorting, Avax falls 20% in a year. You'll make $1600. If you buy GLP and stake it using the sold Avax and BTC, ETH and Avax go down by 20% - your profit is 20%, but with the yield, your total gain is $2400.
Issues with GMX
GMX's historical funding rates are always net positive, so long always pays short. This makes long-term shorts less appealing.
Oracle price discovery isn't enough. This limitation doesn't affect Bitcoin and ETH, but it affects less liquid assets. Traders can buy and sell less liquid assets at a lower price than their actual cost as long as GMX exists.
As users must provide GLP liquidity, adding more assets to GMX will be difficult. Next iteration will have synthetic assets.
Gains Protocol
Best leveraged trading platform. Smart contract-based decentralized protocol. 46 crypto pairs can be leveraged 5–150x and 10 Forex pairs 5–1000x. $10 DAI @ 150x (min collateral x leverage pos size is $1500 DAI). No funding fees, no KYC, trade DAI from your wallet, keep funds.
DAI single-sided staking and the GNS-DAI pool are important parts of Gains trading. GNS-DAI stakers get 90% of trading fees and 100% swap fees. 10 percent of trading fees go to DAI stakers, which is currently 14 percent!
Trade volume
When a trader opens a trade, the leverage and profit are pulled from the DAI pool. If he loses, the protocol yield goes to the stakers.
If the trader's win rate is high and the DAI pool slowly depletes, the GNS token is minted and sold to refill DAI. Trader losses are used to burn GNS tokens. 25%+ of GNS is burned, making it deflationary.
Due to high leverage and volatility of crypto assets, most traders lose money and the protocol always wins, keeping GNS deflationary.
Gains uses a unique decentralized oracle for price feeds, which is better for leverage trading platforms. Let me explain.
Gains uses chainlink price oracles, not its own price feeds. Chainlink oracles only query centralized exchanges for price feeds every minute, which is unsuitable for high-precision trading.
Gains created a custom oracle that queries the eight chainlink nodes for the current price and, on average, for trade confirmation. This model eliminates every-second inquiries, which waste gas but are more efficient than chainlink's per-minute price.
This price oracle helps Gains open and close trades instantly, eliminate scam wicks, etc.
Other benefits include:
Stop-loss guarantee (open positions updated)
No scam wicks
Spot-pricing
Highest possible leverage
Fixed-spreads. During high volatility, a broker can increase the spread, which can hit your stop loss without the price moving.
Trade directly from your wallet and keep your funds.
>90% loss before liquidation (Some platforms liquidate as little as -50 percent)
KYC-free
Directly trade from wallet; keep funds safe
Further improvements
GNS-DAI liquidity providers fear the impermanent loss, so the protocol is migrating to its own liquidity and single staking GNS vaults. This allows users to stake GNS without permanent loss and obtain 90% DAI trading fees by staking. This starts in August.
Their upcoming improvements can be found here.
Gains constantly add new features and change pairs. It's an interesting protocol.
Conclusion
Next bull run, watch decentralized perpetual protocols. Effective tokenomics and non-inflationary yields may attract traders and liquidity providers. But still, there is a long way for them to develop, and I don't see them tackling the centralized exchanges any time soon until they fix their inherent problems and improve fast enough.
Read the full post here.

Quant Galore
3 years ago
I created BAW-IV Trading because I was short on money.
More retail traders means faster, more sophisticated, and more successful methods.
Tech specifications
Only requires a laptop and an internet connection.
We'll use OpenBB's research platform for data/analysis.
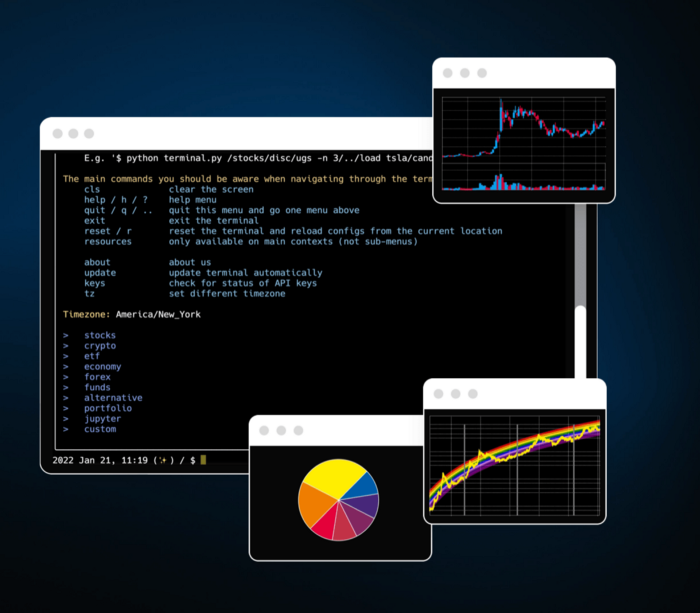
Pricing and execution on Options-Quant
Background
You don't need to know the arithmetic details to use this method.
Black-Scholes is a popular option pricing model. It's best for pricing European options. European options are only exercisable at expiration, unlike American options. American options are always exercisable.
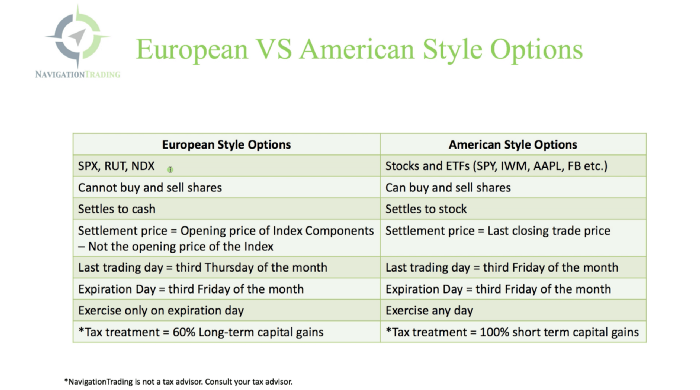
American options carry a premium to cover for the risk of early exercise. The Black-Scholes model doesn't account for this premium, hence it can't price genuine, traded American options.
Barone-Adesi-Whaley (BAW) model. BAW modifies Black-Scholes. It accounts for exercise risk premium and stock dividends. It adds the option's early exercise value to the Black-Scholes value.
The trader need not know the formulaic derivations of this model.
https://ir.nctu.edu.tw/bitstream/11536/14182/1/000264318900005.pdf
Strategy
This strategy targets implied volatility. First, we'll locate liquid options that expire within 30 days and have minimal implied volatility.
After selecting the option that meets the requirements, we price it to get the BAW implied volatility (we choose BAW because it's a more accurate Black-Scholes model). If estimated implied volatility is larger than market volatility, we'll capture the spread.
(Calculated IV — Market IV) = (Profit)
Some approaches to target implied volatility are pricey and inaccessible to individual investors. The best and most cost-effective alternative is to acquire a straddle and delta hedge. This may sound terrifying and pricey, but as shown below, it's much less so.
The Trade
First, we want to find our ideal option, so we use OpenBB terminal to screen for options that:
Have an IV at least 5% lower than the 20-day historical IV
Are no more than 5% out-of-the-money
Expire in less than 30 days
We query:
stocks/options/screen/set low_IV/scr --export Output.csv
This uses the screener function to screen for options that satisfy the above criteria, which we specify in the low IV preset (more on custom presets here). It then saves the matching results to a csv(Excel) file for viewing and analysis.
Stick to liquid names like SPY, AAPL, and QQQ since getting out of a position is just as crucial as getting in. Smaller, illiquid names have higher inefficiencies, which could restrict total profits.

We calculate IV using the BAWbisection model (the bisection is a method of calculating IV, more can be found here.) We price the IV first.
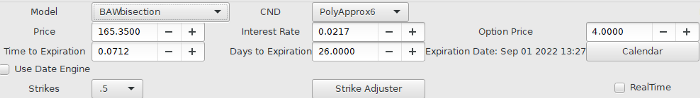
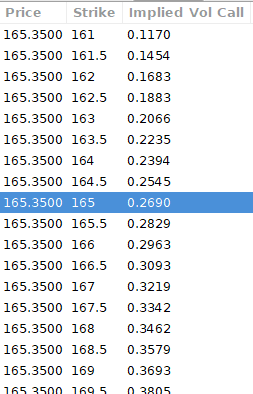
According to the BAW model, implied volatility at this level should be priced at 26.90%. When re-pricing the put, IV is 24.34%, up 3%.
Now it's evident. We must purchase the straddle (long the call and long the put) assuming the computed implied volatility is more appropriate and efficient than the market's. We just want to speculate on volatility, not price fluctuations, thus we delta hedge.
The Fun Starts
We buy both options for $7.65. (x100 multiplier). Initial delta is 2. For every dollar the stock price swings up or down, our position value moves $2.

We want delta to be 0 to avoid price vulnerability. A delta of 0 suggests our position's value won't change from underlying price changes. Being delta-hedged allows us to profit/lose from implied volatility. Shorting 2 shares makes us delta-neutral.
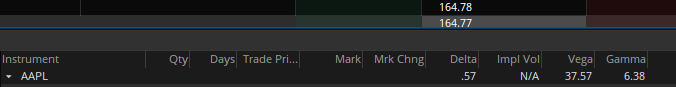
That's delta hedging. (Share price * shares traded) = $330.7 to become delta-neutral. You may have noted that delta is not truly 0.00. This is common since delta-hedging means getting as near to 0 as feasible, since it is rare for deltas to align at 0.00.
Now we're vulnerable to changes in Vega (and Gamma, but given we're dynamically hedging, it's not a big risk), or implied volatility. We wanted to gamble that the position's IV would climb by at least 2%, so we'll maintain it delta-hedged and watch IV.
Because the underlying moves continually, the option's delta moves continuously. A trader can short/long 5 AAPL shares at most. Paper trading lets you practice delta-hedging. Being quick-footed will help with this tactic.
Profit-Closing
As expected, implied volatility rose. By 10 minutes before market closure, the call's implied vol rose to 27% and the put's to 24%. This allowed us to sell the call for $4.95 and the put for $4.35, creating a profit of $165.

You may pull historical data to see how this trade performed. Note the implied volatility and pricing in the final options chain for August 5, 2022 (the position date).

Final Thoughts
Congratulations, that was a doozy. To reiterate, we identified tickers prone to increased implied volatility by screening OpenBB's low IV setting. We double-checked the IV by plugging the price into Options-BAW Quant's model. When volatility was off, we bought a straddle and delta-hedged it. Finally, implied volatility returned to a normal level, and we profited on the spread.
The retail trading space is very quickly catching up to that of institutions. Commissions and fees used to kill this method, but now they cost less than $5. Watching momentum, technical analysis, and now quantitative strategies evolve is intriguing.
I'm not linked with these sites and receive no financial benefit from my writing.
Tell me how your experience goes and how I helped; I love success tales.