

More on Web3 & Crypto

Modern Eremite
3 years ago
The complete, easy-to-understand guide to bitcoin
Introduction
Markets rely on knowledge.
The internet provided practically endless knowledge and wisdom. Humanity has never seen such leverage. Technology's progress drives us to adapt to a changing world, changing our routines and behaviors.
In a digital age, people may struggle to live in the analogue world of their upbringing. Can those who can't adapt change their lives? I won't answer. We should teach those who are willing to learn, nevertheless. Unravel the modern world's riddles and give them wisdom.
Adapt or die . Accept the future or remain behind.
This essay will help you comprehend Bitcoin better than most market participants and the general public. Let's dig into Bitcoin.
Join me.
Ascension
Bitcoin.org was registered in August 2008. Bitcoin whitepaper was published on 31 October 2008. The document intrigued and motivated people around the world, including technical engineers and sovereignty seekers. Since then, Bitcoin's whitepaper has been read and researched to comprehend its essential concept.
I recommend reading the whitepaper yourself. You'll be able to say you read the Bitcoin whitepaper instead of simply Googling "what is Bitcoin" and reading the fundamental definition without knowing the revolution's scope. The article links to Bitcoin's whitepaper. To avoid being overwhelmed by the whitepaper, read the following article first.
Bitcoin isn't the first peer-to-peer digital currency. Hashcash or Bit Gold were once popular cryptocurrencies. These two Bitcoin precursors failed to gain traction and produce the network effect needed for general adoption. After many struggles, Bitcoin emerged as the most successful cryptocurrency, leading the way for others.
Satoshi Nakamoto, an active bitcointalk.org user, created Bitcoin. Satoshi's identity remains unknown. Satoshi's last bitcointalk.org login was 12 December 2010. Since then, he's officially disappeared. Thus, conspiracies and riddles surround Bitcoin's creators. I've heard many various theories, some insane and others well-thought-out.
It's not about who created it; it's about knowing its potential. Since its start, Satoshi's legacy has changed the world and will continue to.
Block-by-block blockchain
Bitcoin is a distributed ledger. What's the meaning?
Everyone can view all blockchain transactions, but no one can undo or delete them.
Imagine you and your friends routinely eat out, but only one pays. You're careful with money and what others owe you. How can everyone access the info without it being changed?
You'll keep a notebook of your evening's transactions. Everyone will take a page home. If one of you changed the page's data, the group would notice and reject it. The majority will establish consensus and offer official facts.
Miners add a new Bitcoin block to the main blockchain every 10 minutes. The appended block contains miner-verified transactions. Now that the next block has been added, the network will receive the next set of user transactions.
Bitcoin Proof of Work—prove you earned it
Any firm needs hardworking personnel to expand and serve clients. Bitcoin isn't that different.
Bitcoin's Proof of Work consensus system needs individuals to validate and create new blocks and check for malicious actors. I'll discuss Bitcoin's blockchain consensus method.
Proof of Work helps Bitcoin reach network consensus. The network is checked and safeguarded by CPU, GPU, or ASIC Bitcoin-mining machines (Application-Specific Integrated Circuit).
Every 10 minutes, miners are rewarded in Bitcoin for securing and verifying the network. It's unlikely you'll finish the block. Miners build pools to increase their chances of winning by combining their processing power.
In the early days of Bitcoin, individual mining systems were more popular due to high maintenance costs and larger earnings prospects. Over time, people created larger and larger Bitcoin mining facilities that required a lot of space and sophisticated cooling systems to keep machines from overheating.
Proof of Work is a vital part of the Bitcoin network, as network security requires the processing power of devices purchased with fiat currency. Miners must invest in mining facilities, which creates a new business branch, mining facilities ownership. Bitcoin mining is a topic for a future article.
More mining, less reward
Bitcoin is usually scarce.
Why is it rare? It all comes down to 21,000,000 Bitcoins.
Were all Bitcoins mined? Nope. Bitcoin's supply grows until it hits 21 million coins. Initially, 50BTC each block was mined, and each block took 10 minutes. Around 2140, the last Bitcoin will be mined.
But 50BTC every 10 minutes does not give me the year 2140. Indeed careful reader. So important is Bitcoin's halving process.
What is halving?
The block reward is halved every 210,000 blocks, which takes around 4 years. The initial payout was 50BTC per block and has been decreased to 25BTC after 210,000 blocks. First halving occurred on November 28, 2012, when 10,500,000 BTC (50%) had been mined. As of April 2022, the block reward is 6.25BTC and will be lowered to 3.125BTC by 19 March 2024.
The halving method is tied to Bitcoin's hashrate. Here's what "hashrate" means.
What if we increased the number of miners and hashrate they provide to produce a block every 10 minutes? Wouldn't we manufacture blocks faster?
Every 10 minutes, blocks are generated with little asymmetry. Due to the built-in adaptive difficulty algorithm, the overall hashrate does not affect block production time. With increased hashrate, it's harder to construct a block. We can estimate when the next halving will occur because 10 minutes per block is fixed.
Building with nodes and blocks
For someone new to crypto, the unusual terms and words may be overwhelming. You'll also find everyday words that are easy to guess or have a vague idea of what they mean, how they work, and what they do. Consider blockchain technology.
Nodes and blocks: Think about that for a moment. What is your first idea?
The blockchain is a chain of validated blocks added to the main chain. What's a "block"? What's inside?
The block is another page in the blockchain book that has been filled with transaction information and accepted by the majority.
We won't go into detail about what each block includes and how it's built, as long as you understand its purpose.
What about nodes?
Nodes, along with miners, verify the blockchain's state independently. But why?
To create a full blockchain node, you must download the whole Bitcoin blockchain and check every transaction against Bitcoin's consensus criteria.
What's Bitcoin's size?
In April 2022, the Bitcoin blockchain was 389.72GB.
Bitcoin's blockchain has miners and node runners.
Let's revisit the US gold rush. Miners mine gold with their own power (physical and monetary resources) and are rewarded with gold (Bitcoin). All become richer with more gold, and so does the country.
Nodes are like sheriffs, ensuring everything is done according to consensus rules and that there are no rogue miners or network users.
Lost and held bitcoin
Does the Bitcoin exchange price match each coin's price? How many coins remain after 21,000,000? 21 million or less?
Common reason suggests a 21 million-coin supply.
What if I lost 1BTC from a cold wallet?
What if I saved 1000BTC on paper in 2010 and it was damaged?
What if I mined Bitcoin in 2010 and lost the keys?
Satoshi Nakamoto's coins? Since then, those coins haven't moved.
How many BTC are truly in circulation?
Many people are trying to answer this question, and you may discover a variety of studies and individual research on the topic. Be cautious of the findings because they can't be evaluated and the statistics are hazy guesses.
On the other hand, we have long-term investors who won't sell their Bitcoin or will sell little amounts to cover mining or living needs.
The price of Bitcoin is determined by supply and demand on exchanges using liquid BTC. How many BTC are left after subtracting lost and non-custodial BTC?
We have significantly less Bitcoin in circulation than you think, thus the price may not reflect demand if we knew the exact quantity of coins available.
True HODLers and diamond-hand investors won't sell you their coins, no matter the market.
What's UTXO?
Unspent (U) Transaction (TX) Output (O)
Imagine taking a $100 bill to a store. After choosing a drink and munchies, you walk to the checkout to pay. The cashier takes your $100 bill and gives you $25.50 in change. It's in your wallet.
Is it simply 100$? No way.
The $25.50 in your wallet is unrelated to the $100 bill you used. Your wallet's $25.50 is just bills and coins. Your wallet may contain these coins and bills:
2x 10$ 1x 10$
1x 5$ or 3x 5$
1x 0.50$ 2x 0.25$
Any combination of coins and bills can equal $25.50. You don't care, and I'd wager you've never ever considered it.
That is UTXO. Now, I'll detail the Bitcoin blockchain and how UTXO works, as it's crucial to know what coins you have in your (hopefully) cold wallet.
You purchased 1BTC. Is it all? No. UTXOs equal 1BTC. Then send BTC to a cold wallet. Say you pay 0.001BTC and send 0.999BTC to your cold wallet. Is it the 1BTC you got before? Well, yes and no. The UTXOs are the same or comparable as before, but the blockchain address has changed. It's like if you handed someone a wallet, they removed the coins needed for a network charge, then returned the rest of the coins and notes.
UTXO is a simple concept, but it's crucial to grasp how it works to comprehend dangers like dust attacks and how coins may be tracked.
Lightning Network: fast cash
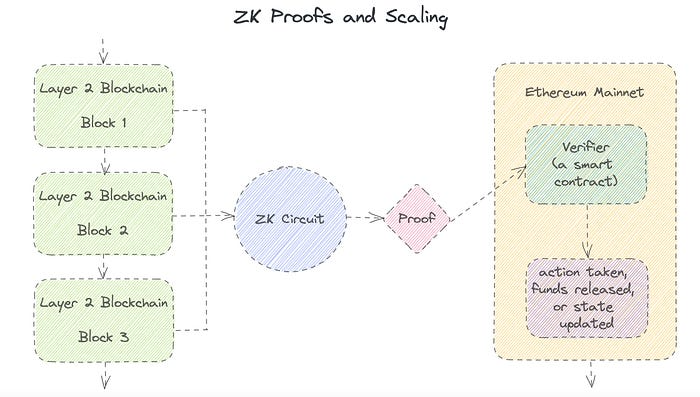
You've probably heard of "Layer 2 blockchain" projects.
What does it mean?
Layer 2 on a blockchain is an additional layer that increases the speed and quantity of transactions per minute and reduces transaction fees.
Imagine going to an obsolete bank to transfer money to another account and having to pay a charge and wait. You can transfer funds via your bank account or a mobile app without paying a fee, or the fee is low, and the cash appear nearly quickly. Layer 1 and 2 payment systems are different.
Layer 1 is not obsolete; it merely has more essential things to focus on, including providing the blockchain with new, validated blocks, whereas Layer 2 solutions strive to offer Layer 1 with previously processed and verified transactions. The primary blockchain, Bitcoin, will only receive the wallets' final state. All channel transactions until shutting and balancing are irrelevant to the main chain.
Layer 2 and the Lightning Network's goal are now clear. Most Layer 2 solutions on multiple blockchains are created as blockchains, however Lightning Network is not. Remember the following remark, as it best describes Lightning.
Lightning Network connects public and private Bitcoin wallets.
Opening a private channel with another wallet notifies just two parties. The creation and opening of a public channel tells the network that anyone can use it.
Why create a public Lightning Network channel?
Every transaction through your channel generates fees.
Money, if you don't know.
See who benefits when in doubt.
Anonymity, huh?
Bitcoin anonymity? Bitcoin's anonymity was utilized to launder money.
Well… You've heard similar stories. When you ask why or how it permits people to remain anonymous, the conversation ends as if it were just a story someone heard.
Bitcoin isn't private. Pseudonymous.
What if someone tracks your transactions and discovers your wallet address? Where is your anonymity then?
Bitcoin is like bulletproof glass storage; you can't take or change the money. If you dig and analyze the data, you can see what's inside.
Every online action leaves a trace, and traces may be tracked. People often forget this guideline.
A tool like that can help you observe what the major players, or whales, are doing with their coins when the market is uncertain. Many people spend time analyzing on-chain data. Worth it?
Ask yourself a question. What are the big players' options? Do you think they're letting you see their wallets for a small on-chain data fee?
Instead of short-term behaviors, focus on long-term trends.
More wallet transactions leave traces. Having nothing to conceal isn't a defect. Can it lead to regulating Bitcoin so every transaction is tracked like in banks today?
But wait. How can criminals pay out Bitcoin? They're doing it, aren't they?
Mixers can anonymize your coins, letting you to utilize them freely. This is not a guide on how to make your coins anonymous; it could do more harm than good if you don't know what you're doing.
Remember, being anonymous attracts greater attention.
Bitcoin isn't the only cryptocurrency we can use to buy things. Using cryptocurrency appropriately can provide usability and anonymity. Monero (XMR), Zcash (ZEC), and Litecoin (LTC) following the Mimblewimble upgrade are examples.
Summary
Congratulations! You've reached the conclusion of the article and learned about Bitcoin and cryptocurrency. You've entered the future.
You know what Bitcoin is, how its blockchain works, and why it's not anonymous. I bet you can explain Lightning Network and UTXO to your buddies.
Markets rely on knowledge. Prepare yourself for success before taking the first step. Let your expertise be your edge.
This article is a summary of this one.

Farhan Ali Khan
3 years ago
Introduction to Zero-Knowledge Proofs: The Art of Proving Without Revealing
Zero-Knowledge Proofs for Beginners
Published here originally.
Introduction
I Spy—did you play as a kid? One person chose a room object, and the other had to guess it by answering yes or no questions. I Spy was entertaining, but did you know it could teach you cryptography?
Zero Knowledge Proofs let you show your pal you know what they picked without exposing how. Math replaces electronics in this secret spy mission. Zero-knowledge proofs (ZKPs) are sophisticated cryptographic tools that allow one party to prove they have particular knowledge without revealing it. This proves identification and ownership, secures financial transactions, and more. This article explains zero-knowledge proofs and provides examples to help you comprehend this powerful technology.
What is a Proof of Zero Knowledge?
Zero-knowledge proofs prove a proposition is true without revealing any other information. This lets the prover show the verifier that they know a fact without revealing it. So, a zero-knowledge proof is like a magician's trick: the prover proves they know something without revealing how or what. Complex mathematical procedures create a proof the verifier can verify.
Want to find an easy way to test it out? Try out with tis awesome example! ZK Crush
Describe it as if I'm 5
Alex and Jack found a cave with a center entrance that only opens when someone knows the secret. Alex knows how to open the cave door and wants to show Jack without telling him.
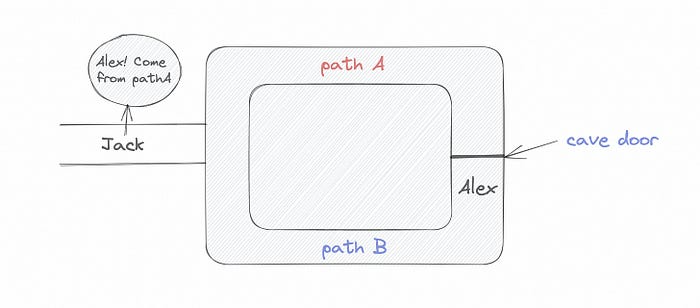
Alex and Jack name both pathways (let’s call them paths A and B).
In the first phase, Alex is already inside the cave and is free to select either path, in this case A or B.
As Alex made his decision, Jack entered the cave and asked him to exit from the B path.
Jack can confirm that Alex really does know the key to open the door because he came out for the B path and used it.
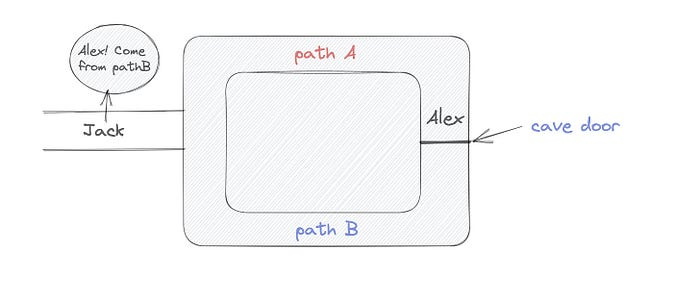
To conclude, Alex and Jack repeat:
Alex walks into the cave.
Alex follows a random route.
Jack walks into the cave.
Alex is asked to follow a random route by Jack.
Alex follows Jack's advice and heads back that way.
What is a Zero Knowledge Proof?
At a high level, the aim is to construct a secure and confidential conversation between the prover and the verifier, where the prover convinces the verifier that they have the requisite information without disclosing it. The prover and verifier exchange messages and calculate in each round of the dialogue.
The prover uses their knowledge to prove they have the information the verifier wants during these rounds. The verifier can verify the prover's truthfulness without learning more by checking the proof's mathematical statement or computation.
Zero knowledge proofs use advanced mathematical procedures and cryptography methods to secure communication. These methods ensure the evidence is authentic while preventing the prover from creating a phony proof or the verifier from extracting unnecessary information.
ZK proofs require examples to grasp. Before the examples, there are some preconditions.
Criteria for Proofs of Zero Knowledge
Completeness: If the proposition being proved is true, then an honest prover will persuade an honest verifier that it is true.
Soundness: If the proposition being proved is untrue, no dishonest prover can persuade a sincere verifier that it is true.
Zero-knowledge: The verifier only realizes that the proposition being proved is true. In other words, the proof only establishes the veracity of the proposition being supported and nothing more.
The zero-knowledge condition is crucial. Zero-knowledge proofs show only the secret's veracity. The verifier shouldn't know the secret's value or other details.
Example after example after example
To illustrate, take a zero-knowledge proof with several examples:
Initial Password Verification Example
You want to confirm you know a password or secret phrase without revealing it.
Use a zero-knowledge proof:
You and the verifier settle on a mathematical conundrum or issue, such as figuring out a big number's components.
The puzzle or problem is then solved using the hidden knowledge that you have learned. You may, for instance, utilize your understanding of the password to determine the components of a particular number.
You provide your answer to the verifier, who can assess its accuracy without knowing anything about your private data.
You go through this process several times with various riddles or issues to persuade the verifier that you actually are aware of the secret knowledge.
You solved the mathematical puzzles or problems, proving to the verifier that you know the hidden information. The proof is zero-knowledge since the verifier only sees puzzle solutions, not the secret information.
In this scenario, the mathematical challenge or problem represents the secret, and solving it proves you know it. The evidence does not expose the secret, and the verifier just learns that you know it.
My simple example meets the zero-knowledge proof conditions:
Completeness: If you actually know the hidden information, you will be able to solve the mathematical puzzles or problems, hence the proof is conclusive.
Soundness: The proof is sound because the verifier can use a publicly known algorithm to confirm that your answer to the mathematical conundrum or difficulty is accurate.
Zero-knowledge: The proof is zero-knowledge because all the verifier learns is that you are aware of the confidential information. Beyond the fact that you are aware of it, the verifier does not learn anything about the secret information itself, such as the password or the factors of the number. As a result, the proof does not provide any new insights into the secret.
Explanation #2: Toss a coin.
One coin is biased to come up heads more often than tails, while the other is fair (i.e., comes up heads and tails with equal probability). You know which coin is which, but you want to show a friend you can tell them apart without telling them.
Use a zero-knowledge proof:
One of the two coins is chosen at random, and you secretly flip it more than once.
You show your pal the following series of coin flips without revealing which coin you actually flipped.
Next, as one of the two coins is flipped in front of you, your friend asks you to tell which one it is.
Then, without revealing which coin is which, you can use your understanding of the secret order of coin flips to determine which coin your friend flipped.
To persuade your friend that you can actually differentiate between the coins, you repeat this process multiple times using various secret coin-flipping sequences.
In this example, the series of coin flips represents the knowledge of biased and fair coins. You can prove you know which coin is which without revealing which is biased or fair by employing a different secret sequence of coin flips for each round.
The evidence is zero-knowledge since your friend does not learn anything about which coin is biased and which is fair other than that you can tell them differently. The proof does not indicate which coin you flipped or how many times you flipped it.
The coin-flipping example meets zero-knowledge proof requirements:
Completeness: If you actually know which coin is biased and which is fair, you should be able to distinguish between them based on the order of coin flips, and your friend should be persuaded that you can.
Soundness: Your friend may confirm that you are correctly recognizing the coins by flipping one of them in front of you and validating your answer, thus the proof is sound in that regard. Because of this, your acquaintance can be sure that you are not just speculating or picking a coin at random.
Zero-knowledge: The argument is that your friend has no idea which coin is biased and which is fair beyond your ability to distinguish between them. Your friend is not made aware of the coin you used to make your decision or the order in which you flipped the coins. Consequently, except from letting you know which coin is biased and which is fair, the proof does not give any additional information about the coins themselves.
Figure out the prime number in Example #3.
You want to prove to a friend that you know their product n=pq without revealing p and q. Zero-knowledge proof?
Use a variant of the RSA algorithm. Method:
You determine a new number s = r2 mod n by computing a random number r.
You email your friend s and a declaration that you are aware of the values of p and q necessary for n to equal pq.
A random number (either 0 or 1) is selected by your friend and sent to you.
You send your friend r as evidence that you are aware of the values of p and q if e=0. You calculate and communicate your friend's s/r if e=1.
Without knowing the values of p and q, your friend can confirm that you know p and q (in the case where e=0) or that s/r is a legitimate square root of s mod n (in the situation where e=1).
This is a zero-knowledge proof since your friend learns nothing about p and q other than their product is n and your ability to verify it without exposing any other information. You can prove that you know p and q by sending r or by computing s/r and sending that instead (if e=1), and your friend can verify that you know p and q or that s/r is a valid square root of s mod n without learning anything else about their values. This meets the conditions of completeness, soundness, and zero-knowledge.
Zero-knowledge proofs satisfy the following:
Completeness: The prover can demonstrate this to the verifier by computing q = n/p and sending both p and q to the verifier. The prover also knows a prime number p and a factorization of n as p*q.
Soundness: Since it is impossible to identify any pair of numbers that correctly factorize n without being aware of its prime factors, the prover is unable to demonstrate knowledge of any p and q that do not do so.
Zero knowledge: The prover only admits that they are aware of a prime number p and its associated factor q, which is already known to the verifier. This is the extent of their knowledge of the prime factors of n. As a result, the prover does not provide any new details regarding n's prime factors.
Types of Proofs of Zero Knowledge
Each zero-knowledge proof has pros and cons. Most zero-knowledge proofs are:
Interactive Zero Knowledge Proofs: The prover and the verifier work together to establish the proof in this sort of zero-knowledge proof. The verifier disputes the prover's assertions after receiving a sequence of messages from the prover. When the evidence has been established, the prover will employ these new problems to generate additional responses.
Non-Interactive Zero Knowledge Proofs: For this kind of zero-knowledge proof, the prover and verifier just need to exchange a single message. Without further interaction between the two parties, the proof is established.
A statistical zero-knowledge proof is one in which the conclusion is reached with a high degree of probability but not with certainty. This indicates that there is a remote possibility that the proof is false, but that this possibility is so remote as to be unimportant.
Succinct Non-Interactive Argument of Knowledge (SNARKs): SNARKs are an extremely effective and scalable form of zero-knowledge proof. They are utilized in many different applications, such as machine learning, blockchain technology, and more. Similar to other zero-knowledge proof techniques, SNARKs enable one party—the prover—to demonstrate to another—the verifier—that they are aware of a specific piece of information without disclosing any more information about that information.
The main characteristic of SNARKs is their succinctness, which refers to the fact that the size of the proof is substantially smaller than the amount of the original data being proved. Because to its high efficiency and scalability, SNARKs can be used in a wide range of applications, such as machine learning, blockchain technology, and more.
Uses for Zero Knowledge Proofs
ZKP applications include:
Verifying Identity ZKPs can be used to verify your identity without disclosing any personal information. This has uses in access control, digital signatures, and online authentication.
Proof of Ownership ZKPs can be used to demonstrate ownership of a certain asset without divulging any details about the asset itself. This has uses for protecting intellectual property, managing supply chains, and owning digital assets.
Financial Exchanges Without disclosing any details about the transaction itself, ZKPs can be used to validate financial transactions. Cryptocurrency, internet payments, and other digital financial transactions can all use this.
By enabling parties to make calculations on the data without disclosing the data itself, Data Privacy ZKPs can be used to preserve the privacy of sensitive data. Applications for this can be found in the financial, healthcare, and other sectors that handle sensitive data.
By enabling voters to confirm that their vote was counted without disclosing how they voted, elections ZKPs can be used to ensure the integrity of elections. This is applicable to electronic voting, including internet voting.
Cryptography Modern cryptography's ZKPs are a potent instrument that enable secure communication and authentication. This can be used for encrypted messaging and other purposes in the business sector as well as for military and intelligence operations.
Proofs of Zero Knowledge and Compliance
Kubernetes and regulatory compliance use ZKPs in many ways. Examples:
Security for Kubernetes ZKPs offer a mechanism to authenticate nodes without disclosing any sensitive information, enhancing the security of Kubernetes clusters. ZKPs, for instance, can be used to verify, without disclosing the specifics of the program, that the nodes in a Kubernetes cluster are running permitted software.
Compliance Inspection Without disclosing any sensitive information, ZKPs can be used to demonstrate compliance with rules like the GDPR, HIPAA, and PCI DSS. ZKPs, for instance, can be used to demonstrate that data has been encrypted and stored securely without divulging the specifics of the mechanism employed for either encryption or storage.
Access Management Without disclosing any private data, ZKPs can be used to offer safe access control to Kubernetes resources. ZKPs can be used, for instance, to demonstrate that a user has the necessary permissions to access a particular Kubernetes resource without disclosing the details of those permissions.
Safe Data Exchange Without disclosing any sensitive information, ZKPs can be used to securely transmit data between Kubernetes clusters or between several businesses. ZKPs, for instance, can be used to demonstrate the sharing of a specific piece of data between two parties without disclosing the details of the data itself.
Kubernetes deployments audited Without disclosing the specifics of the deployment or the data being processed, ZKPs can be used to demonstrate that Kubernetes deployments are working as planned. This can be helpful for auditing purposes and for ensuring that Kubernetes deployments are operating as planned.
ZKPs preserve data and maintain regulatory compliance by letting parties prove things without revealing sensitive information. ZKPs will be used more in Kubernetes as it grows.

Amelie Carver
3 years ago
Web3 Needs More Writers to Educate Us About It
WRITE FOR THE WEB3
Why web3’s messaging is lost and how crypto winter is growing growth seeds
People interested in crypto, blockchain, and web3 typically read Bitcoin and Ethereum's white papers. It's a good idea. Documents produced for developers and academia aren't always the ideal resource for beginners.
Given the surge of extremely technical material and the number of fly-by-nights, rug pulls, and other scams, it's little wonder mainstream audiences regard the blockchain sector as an expensive sideshow act.
What's the solution?
Web3 needs more than just builders.
After joining TikTok, I followed Amy Suto of SutoScience. Amy switched from TV scriptwriting to IT copywriting years ago. She concentrates on web3 now. Decentralized autonomous organizations (DAOs) are seeking skilled copywriters for web3.
Amy has found that web3's basics are easy to grasp; you don't need technical knowledge. There's a paradigm shift in knowing the basics; be persistent and patient.
Apple is positioning itself as a data privacy advocate, leveraging web3's zero-trust ethos on data ownership.
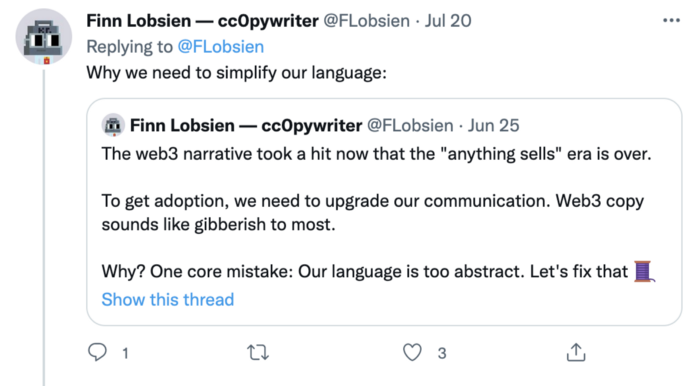
Finn Lobsien, who writes about web3 copywriting for the Mirror and Twitter, agrees: acronyms and abstractions won't do.
Web3 preached to the choir. Curious newcomers have only found whitepapers and scams when trying to learn why the community loves it. No wonder people resist education and buy-in.
Due to the gender gap in crypto (Crypto Bro is not just a stereotype), it attracts people singing to the choir or trying to cash in on the next big thing.
Last year, the industry was booming, so writing wasn't necessary. Now that the bear market has returned (for everyone, but especially web3), holding readers' attention is a valuable skill.
White papers and the Web3
Why does web3 rely so much on non-growth content?
Businesses must polish and improve their messaging moving into the 2022 recession. The 2021 tech boom provided such a sense of affluence and (unsustainable) growth that no one needed great marketing material. The market found them.
This was especially true for web3 and the first-time crypto believers. Obviously. If they knew which was good.
White papers help. White papers are highly technical texts that walk a reader through a product's details. How Does a White Paper Help Your Business and That White Paper Guy discuss them.
They're meant for knowledgeable readers. Investors and the technical (academic/developer) community read web3 white papers. White papers are used when a product is extremely technical or difficult to assist an informed reader to a conclusion. Web3 uses them most often for ICOs (initial coin offerings).
White papers for web3 education help newcomers learn about the web3 industry's components. It's like sending a first-grader to the Annotated Oxford English Dictionary to learn to read. It's a reference, not a learning tool, for words.
Newcomers can use platforms that teach the basics. These included Coinbase's Crypto Basics tutorials or Cryptochicks Academy, founded by the mother of Ethereum's inventor to get more women utilizing and working in crypto.
Discord and Web3 communities
Discord communities are web3's opposite. Discord communities involve personal communications and group involvement.
Online audience growth begins with community building. User personas prefer 1000 dedicated admirers over 1 million lukewarm followers, and the language is much more easygoing. Discord groups are renowned for phishing scams, compromised wallets, and incorrect information, especially since the crypto crisis.
White papers and Discord increase industry insularity. White papers are complicated, and Discord has a high risk threshold.
Web3 and writing ads
Copywriting is emotional, but white papers are logical. It uses the brain's quick-decision centers. It's meant to make the reader invest immediately.
Not bad. People think sales are sleazy, but they can spot the poor things.
Ethical copywriting helps you reach the correct audience. People who gain a following on Medium are likely to have copywriting training and a readership (or three) in mind when they publish. Tim Denning and Sinem Günel know how to identify a target audience and make them want to learn more.
In a fast-moving market, copywriting is less about long-form content like sales pages or blogs, but many organizations do. Instead, the copy is concise, individualized, and high-value. Tweets, email marketing, and IM apps (Discord, Telegram, Slack to a lesser extent) keep engagement high.
What does web3's messaging lack? As DAOs add stricter copyrighting, narrative and connecting tales seem to be missing.
Web3 is passionate about constructing the next internet. Now, they can connect their passion to a specific audience so newcomers understand why.
You might also like

Sad NoCoiner
3 years ago
Two Key Money Principles You Should Understand But Were Never Taught
Prudence is advised. Be debt-free. Be frugal. Spend less.
This advice sounds nice, but it rarely works.
Most people never learn these two money rules. Both approaches will impact how you see personal finance.
It may safeguard you from inflation or the inability to preserve money.
Let’s dive in.
#1: Making long-term debt your ally
High-interest debt hurts consumers. Many credit cards carry 25% yearly interest (or more), so always pay on time. Otherwise, you’re losing money.
Some low-interest debt is good. Especially when buying an appreciating asset with borrowed money.
Inflation helps you.
If you borrow $800,000 at 3% interest and invest it at 7%, you'll make $32,000 (4%).
As money loses value, fixed payments get cheaper. Your assets' value and cash flow rise.
The never-in-debt crowd doesn't know this. They lose money paying off mortgages and low-interest loans early when they could have bought assets instead.
#2: How To Buy Or Build Assets To Make Inflation Irrelevant
Dozens of studies demonstrate actual wage growth is static; $2.50 in 1964 was equivalent to $22.65 now.
These reports never give solutions unless they're selling gold.
But there is one.
Assets beat inflation.
$100 invested into the S&P 500 would have an inflation-adjusted return of 17,739.30%.
Likewise, you can build assets from nothing. Doing is easy and quick. The returns can boost your income by 10% or more.
The people who obsess over inflation inadvertently make the problem worse for themselves. They wait for The Big Crash to buy assets. Or they moan about debt clocks and spending bills instead of seeking a solution.
Conclusion
Being ultra-prudent is like playing golf with a putter to avoid hitting the ball into the water. Sure, you might not slice a drive into the pond. But, you aren’t going to play well either. Or have very much fun.
Money has rules.
Avoiding debt or investment risks will limit your rewards. Long-term, being too cautious hurts your finances.
Disclaimer: This article is for entertainment purposes only. It is not financial advice, always do your own research.

Startup Journal
3 years ago
The Top 14 Software Business Ideas That Are Sure To Succeed in 2023
Software can change any company.
Software is becoming essential. Everyone should consider how software affects their lives and others'.
Software on your phone, tablet, or computer offers many new options. We're experts in enough ways now.
Software Business Ideas will be popular by 2023.
ERP Programs
ERP software meets rising demand.
ERP solutions automate and monitor tasks that large organizations, businesses, and even schools would struggle to do manually.
ERP software could reach $49 billion by 2024.
CRM Program
CRM software is a must-have for any customer-focused business.
Having an open mind about your business services and products allows you to change platforms.
Another company may only want your CRM service.
Medical software
Healthcare facilities need reliable, easy-to-use software.
EHRs, MDDBs, E-Prescribing, and more are software options.
The global medical software market could reach $11 billion by 2025, and mobile medical apps may follow.
Presentation Software in the Cloud
SaaS presentation tools are great.
They're easy to use, comprehensive, and full of traditional Software features.
In today's cloud-based world, these solutions make life easier for people. We don't know about you, but we like it.
Software for Project Management
People began working remotely without signs or warnings before the 2020 COVID-19 pandemic.
Many organizations found it difficult to track projects and set deadlines.
With PMP software tools, teams can manage remote units and collaborate effectively.
App for Blockchain-Based Invoicing
This advanced billing and invoicing solution is for businesses and freelancers.
These blockchain-based apps can calculate taxes, manage debts, and manage transactions.
Intelligent contracts help blockchain track transactions more efficiently. It speeds up and improves invoice generation.
Software for Business Communications
Internal business messaging is tricky.
Top business software tools for communication can share files, collaborate on documents, host video conferences, and more.
Payroll Automation System
Software development also includes developing an automated payroll system.
These software systems reduce manual tasks for timely employee payments.
These tools help enterprise clients calculate total wages quickly, simplify tax calculations, improve record-keeping, and support better financial planning.
System for Detecting Data Leaks
Both businesses and individuals value data highly. Yahoo's data breach is dangerous because of this.
This area of software development can help people protect their data.
You can design an advanced data loss prevention system.
AI-based Retail System
AI-powered shopping systems are popular. The systems analyze customers' search and purchase patterns and store history and are equipped with a keyword database.
These systems offer many customers pre-loaded products.
AI-based shopping algorithms also help users make purchases.
Software for Detecting Plagiarism
Software can help ensure your projects are original and not plagiarized.
These tools detect plagiarized content that Google, media, and educational institutions don't like.
Software for Converting Audio to Text
Machine Learning converts speech to text automatically.
These programs can quickly transcribe cloud-based files.
Software for daily horoscopes
Daily and monthly horoscopes will continue to be popular.
Software platforms that can predict forecasts, calculate birth charts, and other astrology resources are good business ideas.
E-learning Programs
Traditional study methods are losing popularity as virtual schools proliferate and physical space shrinks.
Khan Academy online courses are the best way to keep learning.
Online education portals can boost your learning. If you want to start a tech startup, consider creating an e-learning program.
Conclusion
Software is booming. There's never been a better time to start a software development business, with so many people using computers and smartphones. This article lists eight business ideas for 2023. Consider these ideas if you're just starting out or looking to expand.

Ezra Reguerra
4 years ago
Yuga Labs’ Otherdeeds NFT mint triggers backlash from community
Unhappy community members accuse Yuga Labs of fraud, manipulation, and favoritism over Otherdeeds NFT mint.
Following the Otherdeeds NFT mint, disgruntled community members took to Twitter to criticize Yuga Labs' handling of the event.
Otherdeeds NFTs were a huge hit with the community, selling out almost instantly. Due to high demand, the launch increased Ethereum gas fees from 2.6 ETH to 5 ETH.
But the event displeased many people. Several users speculated that the mint was “planned to fail” so the group could advertise launching its own blockchain, as the team mentioned a chain migration in one tweet.
Others like Mark Beylin tweeted that he had "sold out" on all Ape-related NFT investments after Yuga Labs "revealed their true colors." Beylin also advised others to assume Yuga Labs' owners are “bad actors.”
Some users who failed to complete transactions claim they lost ETH. However, Yuga Labs promised to refund lost gas fees.
CryptoFinally, a Twitter user, claimed Yuga Labs gave BAYC members better land than non-members. Others who wanted to participate paid for shittier land, while BAYCS got the only worthwhile land.
The Otherdeed NFT drop also increased Ethereum's burn rate. Glassnode and Data Always reported nearly 70,000 ETH burned on mint day.