

Economics & Investing

Sofien Kaabar, CFA
3 years ago
Innovative Trading Methods: The Catapult Indicator
Python Volatility-Based Catapult Indicator
As a catapult, this technical indicator uses three systems: Volatility (the fulcrum), Momentum (the propeller), and a Directional Filter (Acting as the support). The goal is to get a signal that predicts volatility acceleration and direction based on historical patterns. We want to know when the market will move. and where. This indicator outperforms standard indicators.
Knowledge must be accessible to everyone. This is why my new publications Contrarian Trading Strategies in Python and Trend Following Strategies in Python now include free PDF copies of my first three books (Therefore, purchasing one of the new books gets you 4 books in total). GitHub-hosted advanced indications and techniques are in the two new books above.
The Foundation: Volatility
The Catapult predicts significant changes with the 21-period Relative Volatility Index.
The Average True Range, Mean Absolute Deviation, and Standard Deviation all assess volatility. Standard Deviation will construct the Relative Volatility Index.
Standard Deviation is the most basic volatility. It underpins descriptive statistics and technical indicators like Bollinger Bands. Before calculating Standard Deviation, let's define Variance.
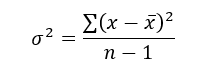
Variance is the squared deviations from the mean (a dispersion measure). We take the square deviations to compel the distance from the mean to be non-negative, then we take the square root to make the measure have the same units as the mean, comparing apples to apples (mean to standard deviation standard deviation). Variance formula:
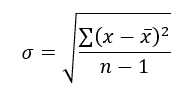
As stated, standard deviation is:
# The function to add a number of columns inside an array
def adder(Data, times):

    for i in range(1, times + 1):

        new_col = np.zeros((len(Data), 1), dtype = float)
        Data = np.append(Data, new_col, axis = 1)

    return Data

# The function to delete a number of columns starting from an index
def deleter(Data, index, times):

    for i in range(1, times + 1):

        Data = np.delete(Data, index, axis = 1)

    return Data

# The function to delete a number of rows from the beginning
def jump(Data, jump):

    Data = Data[jump:, ]

    return Data

# Example of adding 3 empty columns to an array
my_ohlc_array = adder(my_ohlc_array, 3)

# Example of deleting the 2 columns after the column indexed at 3
my_ohlc_array = deleter(my_ohlc_array, 3, 2)

# Example of deleting the first 20 rows
my_ohlc_array = jump(my_ohlc_array, 20)

# Remember, OHLC is an abbreviation of Open, High, Low, and Close and it refers to the standard historical data file

def volatility(Data, lookback, what, where):

  for i in range(len(Data)):

     try:

        Data[i, where] = (Data[i - lookback + 1:i + 1, what].std())
     except IndexError:
        pass

  return Data
The RSI is the most popular momentum indicator, and for good reason—it excels in range markets. Its 0–100 range simplifies interpretation. Fame boosts its potential.
The more traders and portfolio managers look at the RSI, the more people will react to its signals, pushing market prices. Technical Analysis is self-fulfilling, therefore this theory is obvious yet unproven.
RSI is determined simply. Start with one-period pricing discrepancies. We must remove each closing price from the previous one. We then divide the smoothed average of positive differences by the smoothed average of negative differences. The RSI algorithm converts the Relative Strength from the last calculation into a value between 0 and 100.
def ma(Data, lookback, close, where):

    Data = adder(Data, 1)

    for i in range(len(Data)):

            try:
                Data[i, where] = (Data[i - lookback + 1:i + 1, close].mean())

            except IndexError:
                pass

    # Cleaning
    Data = jump(Data, lookback)

    return Data
def ema(Data, alpha, lookback, what, where):

    alpha = alpha / (lookback + 1.0)
    beta  = 1 - alpha

    # First value is a simple SMA
    Data = ma(Data, lookback, what, where)

    # Calculating first EMA
    Data[lookback + 1, where] = (Data[lookback + 1, what] * alpha) + (Data[lookback, where] * beta)

    # Calculating the rest of EMA
    for i in range(lookback + 2, len(Data)):
            try:
                Data[i, where] = (Data[i, what] * alpha) + (Data[i - 1, where] * beta)

            except IndexError:
                pass

    return Datadef rsi(Data, lookback, close, where, width = 1, genre = 'Smoothed'):

    # Adding a few columns
    Data = adder(Data, 7)

    # Calculating Differences
    for i in range(len(Data)):

        Data[i, where] = Data[i, close] - Data[i - width, close]

    # Calculating the Up and Down absolute values
    for i in range(len(Data)):

        if Data[i, where] > 0:

            Data[i, where + 1] = Data[i, where]

        elif Data[i, where] < 0:

            Data[i, where + 2] = abs(Data[i, where])

    # Calculating the Smoothed Moving Average on Up and Down
    absolute values

    lookback = (lookback * 2) - 1 # From exponential to smoothed
    Data = ema(Data, 2, lookback, where + 1, where + 3)
    Data = ema(Data, 2, lookback, where + 2, where + 4)

    # Calculating the Relative Strength
    Data[:, where + 5] = Data[:, where + 3] / Data[:, where + 4]

    # Calculate the Relative Strength Index
    Data[:, where + 6] = (100 - (100 / (1 + Data[:, where + 5])))

    # Cleaning
    Data = deleter(Data, where, 6)
    Data = jump(Data, lookback)

    return Data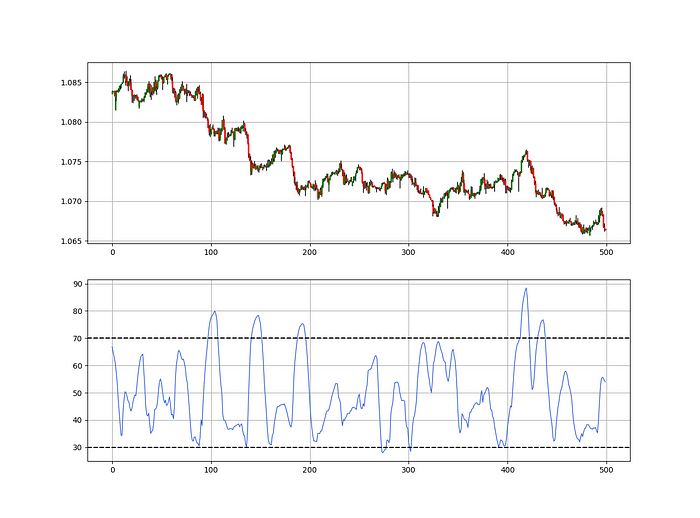
def relative_volatility_index(Data, lookback, close, where):

    # Calculating Volatility
    Data = volatility(Data, lookback, close, where)

    # Calculating the RSI on Volatility
    Data = rsi(Data, lookback, where, where + 1)

    # Cleaning
    Data = deleter(Data, where, 1)

    return Data
The Arm Section: Speed
The Catapult predicts momentum direction using the 14-period Relative Strength Index.
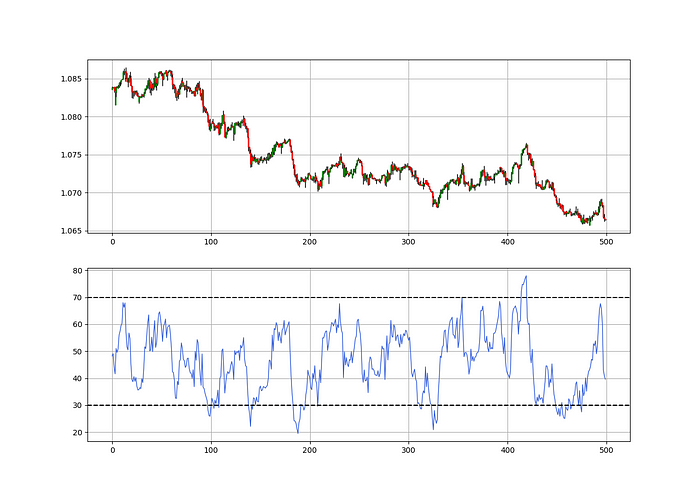
As a reminder, the RSI ranges from 0 to 100. Two levels give contrarian signals:
A positive response is anticipated when the market is deemed to have gone too far down at the oversold level 30, which is 30.
When the market is deemed to have gone up too much, at overbought level 70, a bearish reaction is to be expected.
Comparing the RSI to 50 is another intriguing use. RSI above 50 indicates bullish momentum, while below 50 indicates negative momentum.
The direction-finding filter in the frame
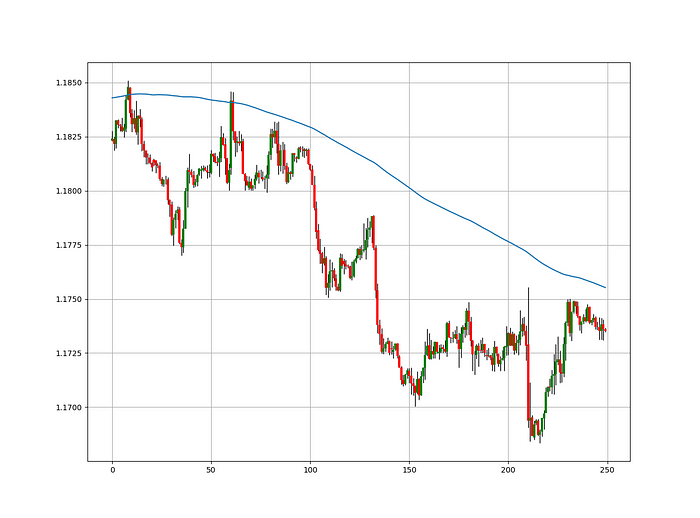
The Catapult's directional filter uses the 200-period simple moving average to keep us trending. This keeps us sane and increases our odds.
Moving averages confirm and ride trends. Its simplicity and track record of delivering value to analysis make them the most popular technical indicator. They help us locate support and resistance, stops and targets, and the trend. Its versatility makes them essential trading tools.
This is the plain mean, employed in statistics and everywhere else in life. Simply divide the number of observations by their total values. Mathematically, it's:
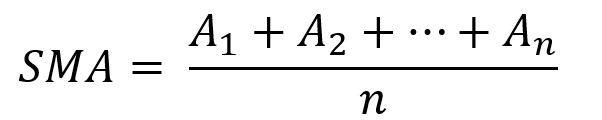
We defined the moving average function above. Create the Catapult indication now.
Indicator of the Catapult
The indicator is a healthy mix of the three indicators:
The first trigger will be provided by the 21-period Relative Volatility Index, which indicates that there will now be above average volatility and, as a result, it is possible for a directional shift.
If the reading is above 50, the move is likely bullish, and if it is below 50, the move is likely bearish, according to the 14-period Relative Strength Index, which indicates the likelihood of the direction of the move.
The likelihood of the move's direction will be strengthened by the 200-period simple moving average. When the market is above the 200-period moving average, we can infer that bullish pressure is there and that the upward trend will likely continue. Similar to this, if the market falls below the 200-period moving average, we recognize that there is negative pressure and that the downside is quite likely to continue.
lookback_rvi = 21
lookback_rsi = 14
lookback_ma = 200
my_data = ma(my_data, lookback_ma, 3, 4)
my_data = rsi(my_data, lookback_rsi, 3, 5)
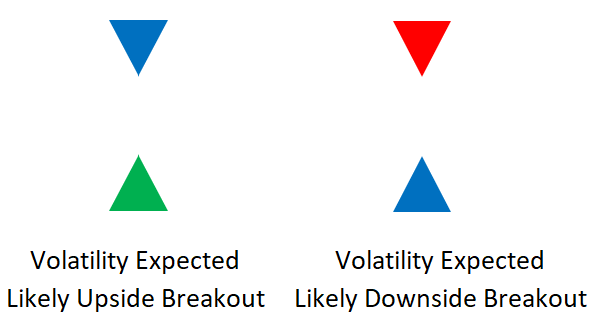
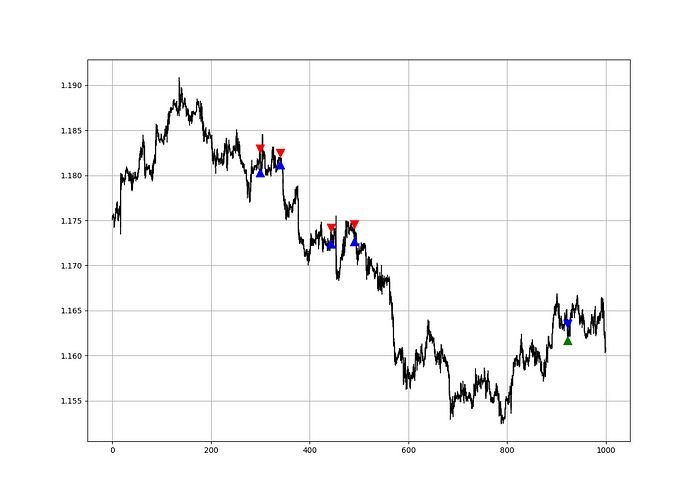
my_data = relative_volatility_index(my_data, lookback_rvi, 3, 6)Two-handled overlay indicator Catapult. The first exhibits blue and green arrows for a buy signal, and the second shows blue and red for a sell signal.
The chart below shows recent EURUSD hourly values.
def signal(Data, rvi_col, signal):

    Data = adder(Data, 10)

    for i in range(len(Data)):

        if Data[i,     rvi_col] < 30 and \
           Data[i - 1, rvi_col] > 30 and \
           Data[i - 2, rvi_col] > 30 and \
           Data[i - 3, rvi_col] > 30 and \
           Data[i - 4, rvi_col] > 30 and \
           Data[i - 5, rvi_col] > 30:

               Data[i, signal] = 1

    return Data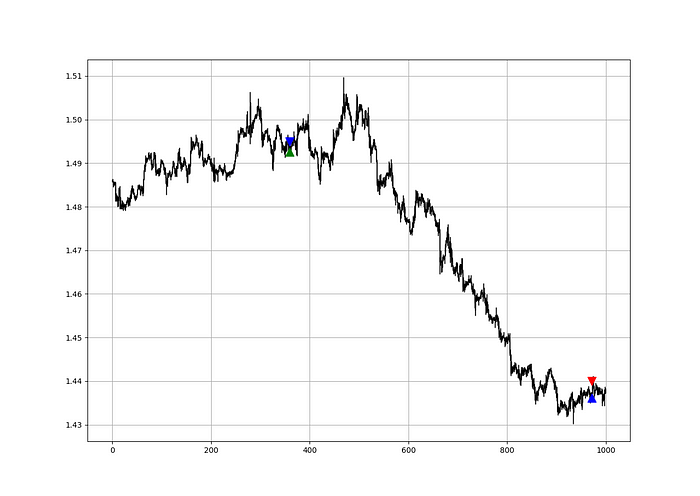
Signals are straightforward. The indicator can be utilized with other methods.
my_data = signal(my_data, 6, 7)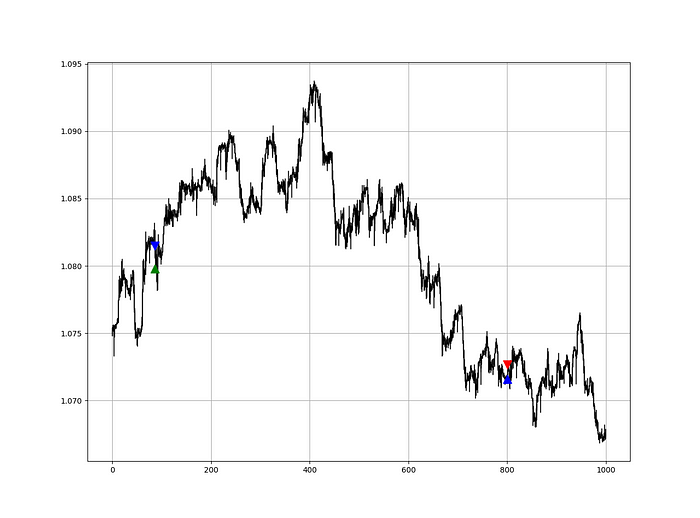
Lumiwealth shows how to develop all kinds of algorithms. I recommend their hands-on courses in algorithmic trading, blockchain, and machine learning.
Summary
To conclude, my goal is to contribute to objective technical analysis, which promotes more transparent methods and strategies that must be back-tested before implementation. Technical analysis will lose its reputation as subjective and unscientific.
After you find a trading method or approach, follow these steps:
Put emotions aside and adopt an analytical perspective.
Test it in the past in conditions and simulations taken from real life.
Try improving it and performing a forward test if you notice any possibility.
Transaction charges and any slippage simulation should always be included in your tests.
Risk management and position sizing should always be included in your tests.
After checking the aforementioned, monitor the plan because market dynamics may change and render it unprofitable.

Cody Collins
3 years ago
The direction of the economy is as follows.
What quarterly bank earnings reveal

Big banks know the economy best. Unless we’re talking about a housing crisis in 2007…
Banks are crucial to the U.S. economy. The Fed, communities, and investments exchange money.
An economy depends on money flow. Banks' views on the economy can affect their decision-making.
Most large banks released quarterly earnings and forward guidance last week. Others were pessimistic about the future.
What Makes Banks Confident
Bank of America's profit decreased 30% year-over-year, but they're optimistic about the economy. Comparatively, they're bullish.
Who banks serve affects what they see. Bank of America supports customers.
They think consumers' future is bright. They believe this for many reasons.
The average customer has decent credit, unless the system is flawed. Bank of America's new credit card and mortgage borrowers averaged 771. New-car loan and home equity borrower averages were 791 and 797.
2008's housing crisis affected people with scores below 620.
Bank of America and the economy benefit from a robust consumer. Major problems can be avoided if individuals maintain spending.
Reasons Other Banks Are Less Confident
Spending requires income. Many companies, mostly in the computer industry, have announced they will slow or freeze hiring. Layoffs are frequently an indication of poor times ahead.
BOA is positive, but investment banks are bearish.
Jamie Dimon, CEO of JPMorgan, outlined various difficulties our economy could confront.
But geopolitical tension, high inflation, waning consumer confidence, the uncertainty about how high rates have to go and the never-before-seen quantitative tightening and their effects on global liquidity, combined with the war in Ukraine and its harmful effect on global energy and food prices are very likely to have negative consequences on the global economy sometime down the road.
That's more headwinds than tailwinds.
JPMorgan, which helps with mergers and IPOs, is less enthusiastic due to these concerns. Incoming headwinds signal drying liquidity, they say. Less business will be done.
Final Reflections
I don't think we're done. Yes, stocks are up 10% from a month ago. It's a long way from old highs.
I don't think the stock market is a strong economic indicator.
Many executives foresee a 2023 recession. According to the traditional definition, we may be in a recession when Q2 GDP statistics are released next week.
Regardless of criteria, I predict the economy will have a terrible year.
Weekly layoffs are announced. Inflation persists. Will prices return to 2020 levels if inflation cools? Perhaps. Still expensive energy. Ukraine's war has global repercussions.
I predict BOA's next quarter earnings won't be as bullish about the consumer's strength.

Cory Doctorow
3 years ago
The current inflation is unique.
New Stiglitz just dropped.

Here's the inflation story everyone believes (warning: it's false): America gave the poor too much money during the recession, and now the economy is awash with free money, which made them so rich they're refusing to work, meaning the economy isn't making anything. Prices are soaring due to increased cash and missing labor.
Lawrence Summers says there's only one answer. We must impoverish the poor: raise interest rates, cause a recession, and eliminate millions of jobs, until the poor are stripped of their underserved fortunes and return to work.
https://pluralistic.net/2021/11/20/quiet-part-out-loud/#profiteering
This is nonsense. Countries around the world suffered inflation during and after lockdowns, whether they gave out humanitarian money to keep people from starvation. America has slightly greater inflation than other OECD countries, but it's not due to big relief packages.
The Causes of and Responses to Today's Inflation, a Roosevelt Institute report by Nobel-winning economist Joseph Stiglitz and macroeconomist Regmi Ira, debunks this bogus inflation story and offers a more credible explanation for inflation.
https://rooseveltinstitute.org/wp-content/uploads/2022/12/RI CausesofandResponsestoTodaysInflation Report 202212.pdf
Sharp interest rate hikes exacerbate the slump and increase inflation, the authors argue. They compare monetary policy inflation cures to medieval bloodletting, where doctors repeated the same treatment until the patient recovered (for which they received credit) or died (which was more likely).
Let's discuss bloodletting. Inflation hawks warn of the wage price spiral, when inflation rises and powerful workers bargain for higher pay, driving up expenses, prices, and wages. This is the fairy-tale narrative of the 1970s, and it's true except that OPEC's embargo drove up oil prices, which produced inflation. Oh well.
Let's be generous to seventies-haunted inflation hawks and say we're worried about a wage-price spiral. Fantastic! No. Real wages are 2.3% lower than they were in Oct 2021 after peaking in June at 4.8%.
Why did America's powerful workers take a paycut rather than demand inflation-based pay? Weak unions, globalization, economic developments.
Workers don't expect inflation to rise, so they're not requesting inflationary hikes. Inflationary expectations have remained moderate, consistent with our data interpretation.
https://www.newyorkfed.org/microeconomics/sce#/
Neither are workers. Working people see surplus savings as wealth and spend it gradually over their lives, despite rising demand. People may have saved money by staying in during the lockdown, but they don't eat out every night to make up for it. Instead, they keep those savings as precautionary balances. This is why the economy is lagging.
People don't buy non-traded goods with pandemic savings (basically, imports). Imports don't multiply like domestic purchases. If you buy a loaf of bread from the corner baker for $1 and they spend it at the tavern across the street, that dollar generates $3 in economic activity. Spending a dollar on foreign goods leaves the country and any multiplier effect happens there, not in the US.
Only marginally higher wages. The ECI is up 1.6% from 2019. Almost all gains went to the 25% lowest-paid Americans. Contrary to the inflation worry about too much savings, these workers don't make enough to save, even post-pandemic.
Recreation and transit spending are at or below pre-pandemic levels. Higher food and hotel prices (which doesn’t mean we’re buying more food than we were in 2019, just that it costs more).
What causes inflation if not greedy workers, free money, and high demand? The most expensive domestic goods produce the biggest revenues for their manufacturers. They charge you more without paying their workers or suppliers more.
The largest price-gougers are funneling their earnings to rich people who store it offshore through stock buybacks and dividends. A $1 billion stock buyback doesn't buy $1 billion in bread.
Five factors influence US inflation today:
I. Price rises for energy and food
II. shifts in consumer tastes
III. supply interruptions (mainly autos);
IV. increased rents (due to telecommuting);
V. monopoly (AKA price-gouging).
None can be remedied by raising interest rates or laying off workers.
Russia's invasion of Ukraine, omicron, and China's Zero Covid policy all disrupted the flow of food, energy, and production inputs. The price went higher because we made less.
After Russia invaded Ukraine, oil prices spiked, and sanctions made it worse. But that was February. By October, oil prices had returned to pre-pandemic, 2015 levels attributable to global economic adjustments, including a shift to renewables. Every new renewable installation reduces oil consumption and affects oil prices.
High food prices have a simple solution. The US and EU have bribed farmers not to produce for 50 years. If the war continues, this program may end, and food prices may decline.
Demand changes. We want different things than in 2019, not more. During the lockdown, people substituted goods. Half of the US toilet-paper supply in 2019 was on commercial-sized rolls. This is created from different mills and stock than our toilet paper.
Lockdown pushed toilet paper demand to residential rolls, causing shortages (the TP hoarding story was just another pandemic urban legend). Because supermarket stores don't have accounts with commercial paper distributors, ordering from languishing stores was difficult. Kleenex and paper towel substitutions caused greater shortages.
All that drove increased costs in numerous product categories, and there were more cases. These increases are transient, caused by supply chain inefficiencies that are resolving.
Demand for frontline staff saw a one-time repricing of pay, which is being recouped as we speak.
Illnesses. Brittle, hollowed-out global supply chains aggravated this. The constant pursuit of cheap labor and minimal regulation by monopolies that dominate most sectors means things are manufactured in far-flung locations. Financialization means any surplus capital assets were sold off years ago, leaving firms with little production slack. After the epidemic, several of these systems took years to restart.
Automobiles are to blame. Financialization and monopolization consolidated microchip and auto production in Taiwan and China. When the lockdowns came, these worldwide corporations cancelled their chip orders, and when they placed fresh orders, they were at the back of the line.
That drove up car prices, which is why the US has slightly higher inflation than other wealthy countries: the economy is car-centric. Automobile prices account for 9% of the CPI. France: 3.6%
Rent shocks and telecommuting. After the epidemic, many professionals moved to exurbs, small towns, and the countryside to work from home. As commercial properties were vacated, it was impractical to adapt them for residential use due to planning restrictions. Addressing these restrictions will cut rent prices more than raising inflation rates, which halts housing construction.
Statistical mirages cause some rent inflation. The CPI estimates what homeowners would pay to rent their properties. When rents rise in your neighborhood, the CPI believes you're spending more on rent even if you have a 30-year fixed-rate mortgage.
Market dominance. Almost every area of the US economy is dominated by monopolies, whose CEOs disclose on investor calls that they use inflation scares to jack up prices and make record profits.
https://pluralistic.net/2022/02/02/its-the-economy-stupid/#overinflated
Long-term profit margins are rising. Markups averaged 26% from 1960-1980. 2021: 72%. Market concentration explains 81% of markup increases (e.g. monopolization). Profit margins reach a 70-year high in 2022. These elements interact. Monopolies thin out their sectors, making them brittle and sensitive to shocks.
If we're worried about a shrinking workforce, there are more humanitarian and sensible solutions than causing a recession and mass unemployment. Instead, we may boost US production capacity by easing workers' entry into the workforce.
https://pluralistic.net/2022/06/01/factories-to-condos-pipeline/#stuff-not-money
US female workforce participation ranks towards the bottom of developed countries. Many women can't afford to work due to America's lack of daycare, low earnings, and bad working conditions in female-dominated fields. If America doesn't have enough workers, childcare subsidies and minimum wages can help.
By contrast, driving the country into recession with interest-rate hikes will reduce employment, and the last recruited (women, minorities) are the first fired and the last to be rehired. Forcing America into recession won't enhance its capacity to create what its people want; it will degrade it permanently.
Nothing the Fed does can stop price hikes from international markets, lack of supply chain investment, COVID-19 disruptions, climate change, the Ukraine war, or market power. They can worsen it. When supply problems generate inflation, raising interest rates decreases investments that can remedy shortages.
Increasing interest rates won't cut rents since landlords pass on the expenses and high rates restrict investment in new dwellings where tenants could escape the costs.
Fixing the supply fixes supply-side inflation. Increase renewables investment (as the Inflation Reduction Act does). Monopolies can be busted (as the IRA does). Reshore key goods (as the CHIPS Act does). Better pay and child care attract employees.
Windfall taxes can claw back price-gouging corporations' monopoly earnings.
https://pluralistic.net/2022/03/15/sanctions-financing/#soak-the-rich
In 2008, we ruled out fiscal solutions (bailouts for debtors) and turned to monetary policy (bank bailouts). This preserved the economy but increased inequality and eroded public trust.
Monetary policy won't help. Even monetary policy enthusiasts recognize an 18-month lag between action and result. That suggests monetary tightening is unnecessary. Like the medieval bloodletter, central bankers whose interest rate hikes don't work swiftly may do more of the same, bringing the economy to its knees.
Interest rates must rise. Zero-percent interest fueled foolish speculation and financialization. Increasing rates will stop this. Increasing interest rates will destroy the economy and dampen inflation.
Then what? All recent evidence indicate to inflation decreasing on its own, as the authors argue. Supply side difficulties are finally being overcome, evidence shows. Energy and food prices are showing considerable mean reversion, which is disinflationary.
The authors don't recommend doing nothing. Best case scenario, they argue, is that the Fed won't keep raising interest rates until morale improves.

Desiree Peralta
3 years ago
How to Use the 2023 Recession to Grow Your Wealth Exponentially
This season's three best money moves.

“Millionaires are made in recessions.” — Time Capital
We're in a serious downturn, whether or not we're in a recession.
97% of business owners are decreasing costs by more than 10%, and all markets are down 30%.
If you know what you're doing and analyze the markets correctly, this is your chance to become a millionaire.
In any recession, there are always excellent possibilities to seize. Real estate, crypto, stocks, enterprises, etc.
What you do with your money could influence your future riches.
This article analyzes the three key markets, their circumstances for 2023, and how to profit from them.
Ways to make money on the stock market.
If you're conservative like me, you should invest in an index fund. Most of these funds are down 10-30% of ATH:
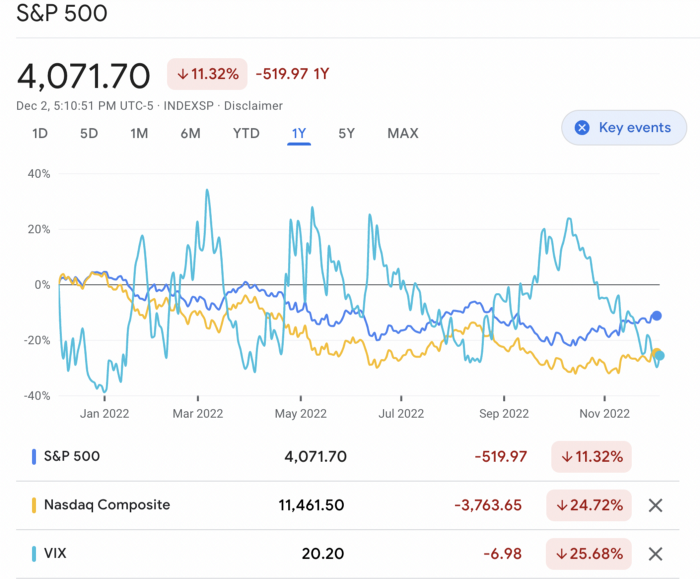
In earlier recessions, most money index funds lost 20%. After this downturn, they grew and passed the ATH in subsequent months.
Now is the greatest moment to invest in index funds to grow your money in a low-risk approach and make 20%.
If you want to be risky but wise, pick companies that will get better next year but are struggling now.
Even while we can't be 100% confident of a company's future performance, we know some are strong and will have a fantastic year.
Microsoft (down 22%), JPMorgan Chase (15.6%), Amazon (45%), and Disney (33.8%).
These firms give dividends, so you can earn passively while you wait.
So I consider that a good strategy to make wealth in the current stock market is to create two portfolios: one based on index funds to earn 10% to 20% profit when the corrections end, and the other based on individual stocks of popular and strong companies to earn 20%-30% return and dividends while you wait.
How to profit from the downturn in the real estate industry.
With rising mortgage rates, it's the worst moment to buy a home if you don't want to be eaten by banks. In the U.S., interest rates are double what they were three years ago, so buying now looks foolish.
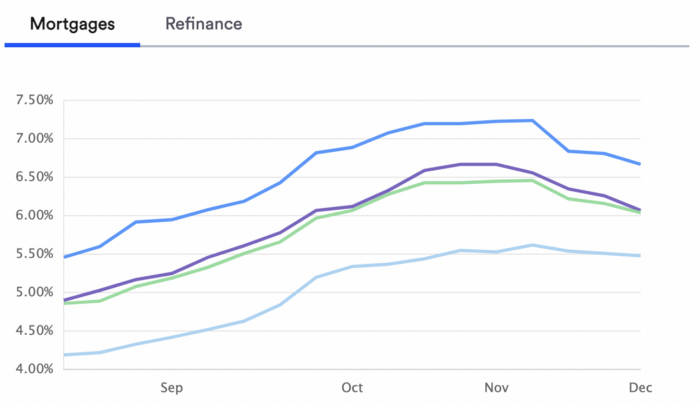
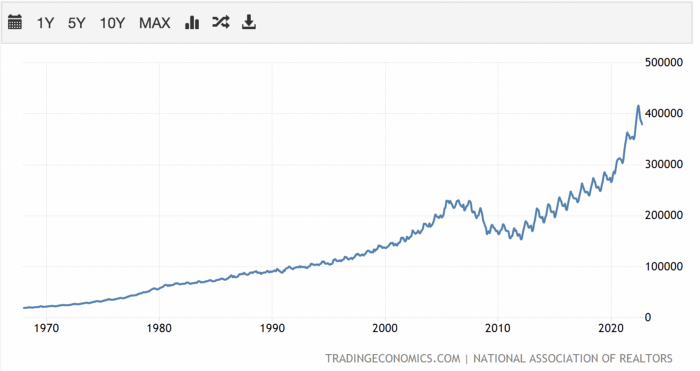
Due to these rates, property prices are falling, but that won't last long since individuals will take advantage.
According to historical data, now is the ideal moment to buy a house for the next five years and perhaps forever.
If you can buy a house, do it. You can refinance the interest at a lower rate with acceptable credit, but not the house price.
Take advantage of the housing market prices now because you won't find a decent deal when rates normalize.
How to profit from the cryptocurrency market.
This is the riskiest market to tackle right now, but it could offer the most opportunities if done appropriately.
The most powerful cryptocurrencies are down more than 60% from last year: $68,990 for BTC and $4,865 for ETH.
If you focus on those two coins, you can make 30%-60% without waiting for them to return to their ATH, and they're low enough to be a solid investment.
I don't encourage trying other altcoins because the crypto market is in crisis and you can lose everything if you're greedy.
Still, the main Cryptos are a good investment provided you store them in an external wallet and follow financial gurus' security advice.
Last thoughts
We can't anticipate a recession until it ends. We can't forecast a market or asset's lowest point, therefore waiting makes little sense.
If you want to develop your wealth, assess the money prospects on all the marketplaces and initiate long-term trades.
Many millionaires are made during recessions because they don't fear negative figures and use them to scale their money.

Sylvain Saurel
3 years ago
A student trader from the United States made $110 million in one month and rose to prominence on Wall Street.
Genius or lucky?

From the title, you might think I'm selling advertising for a financial influencer, a dubious trading site, or a training organization to attract clients. I'm suspicious. Better safe than sorry.
But not here.
Jake Freeman, 20, made $110 million in a month, according to the Financial Times. At 18, he ran for president. He made his name in markets, not politics. Two years later, he's Wall Street's prince. Interview requests flood the prodigy.
Jake Freeman bought 5 million Bed Bath & Beyond Group shares for $5.5 in July 2022 and sold them for $27 a month later. He thought the stock might double. Since speculation died down, he sold well. The stock fell 40.5% to 11 dollars on Friday, 19 August 2022. On August 22, 2022, it fell 16% to $9.
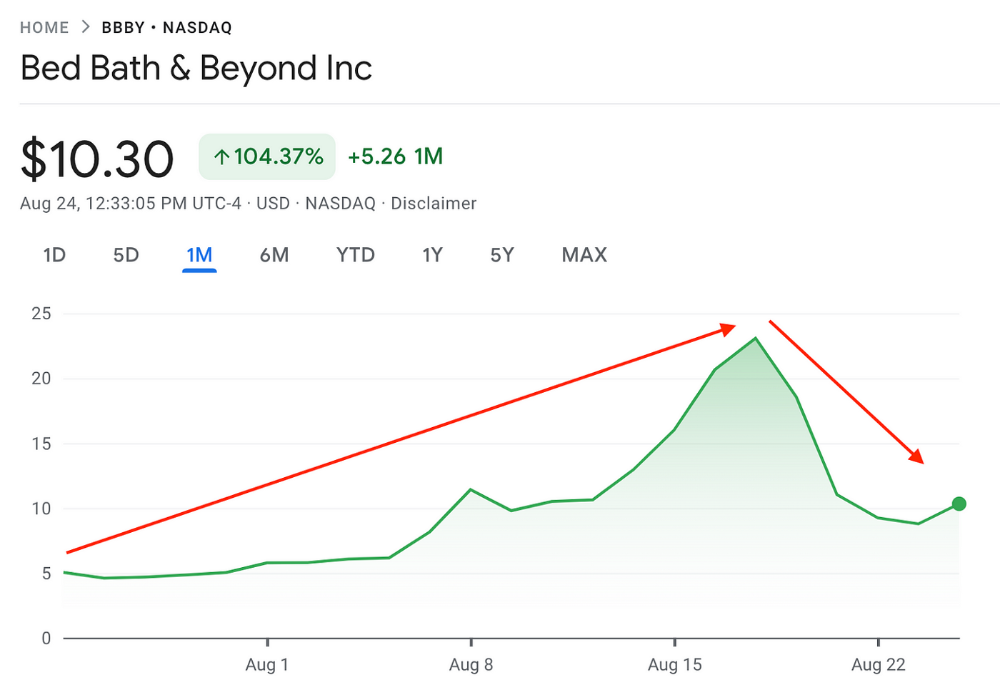
Smallholders have been buying the stock for weeks and will lose heavily if it falls further. Bed Bath & Beyond is the second most popular stock after Foot Locker, ahead of GameStop and Apple.
Jake Freeman earned $110 million thanks to a significant stock market flurry.
Online broker customers aren't the only ones with jitters. By June 2022, Ken Griffin's Citadel and Stephen Mandel's Lone Pine Capital held nearly a third of the company's capital. Did big managers sell before the stock plummeted?
Recent stock movements (derivatives) and rumors could prompt a SEC investigation.
Jake Freeman wrote to the board of directors after his investment to call for a turnaround, given the company's persistent problems and short sellers. The bathroom and kitchen products distribution group's stock soared in July 2022 due to renewed buying by private speculators, who made it one of their meme stocks with AMC and GameStop.
Second-quarter 2022 results and financial health worsened. He didn't celebrate his miraculous operation in a nightclub. He told a British newspaper, "I'm shocked." His parents dined in New York. He returned to Los Angeles to study math and economics.
Jake Freeman founded Freeman Capital Management with his savings and $25 million from family, friends, and acquaintances. They are the ones who are entitled to the $110 million he raised in one month. Will his investors pocket and withdraw all or part of their profits or will they trust the young prodigy for new stunts on Wall Street?
His operation should attract new clients. Well-known hedge funds may hire him.
Jake Freeman didn't listen to gurus or former traders. At 17, he interned at a quantitative finance and derivatives hedge fund, Volaris. At 13, he began investing with his pharmaceutical executive uncle. All countries have increased their Google searches for the young trader in the last week.
Naturally, his success has inspired resentment.
His success stirs jealousy, and he's attacked on social media. On Reddit, people who lost money on Bed Bath & Beyond, Jake Freeman's fortune, are mourning.
Several conspiracy theories circulate about him, including that he doesn't exist or is working for a Taiwanese amusement park.
If all 20 million American students had the same trading skills, they would have generated $1.46 trillion. Jake Freeman is unique. Apprentice traders' careers are often short, disillusioning, and tragic.
Two years ago, 20-year-old Robinhood client Alexander Kearns committed suicide after losing $750,000 trading options. Great traders start young. Michael Platt of BlueCrest invested in British stocks at age 12 under his grandmother's supervision and made a £30,000 fortune. Paul Tudor Jones started trading before he turned 18 with his uncle. Warren Buffett, at age 10, was discussing investments with Goldman Sachs' head. Oracle of Omaha tells all.