


More on Technology

Ben "The Hosk" Hosking
3 years ago
The Yellow Cat Test Is Typically Failed by Software Developers.
Believe what you see, what people say

It’s sad that we never get trained to leave assumptions behind. - Sebastian Thrun
Many problems in software development are not because of code but because developers create the wrong software. This isn't rare because software is emergent and most individuals only realize what they want after it's built.
Inquisitive developers who pass the yellow cat test can improve the process.
Carpenters measure twice and cut the wood once. Developers are rarely so careful.
The Yellow Cat Test
Game of Thrones made dragons cool again, so I am reading The Game of Thrones book.
The yellow cat exam is from Syrio Forel, Arya Stark's fencing instructor.
Syrio tells Arya he'll strike left when fencing. He hits her after she dodges left. Arya says “you lied”. Syrio says his words lied, but his eyes and arm told the truth.
Arya learns how Syrio became Bravos' first sword.
“On the day I am speaking of, the first sword was newly dead, and the Sealord sent for me. Many bravos had come to him, and as many had been sent away, none could say why. When I came into his presence, he was seated, and in his lap was a fat yellow cat. He told me that one of his captains had brought the beast to him, from an island beyond the sunrise. ‘Have you ever seen her like?’ he asked of me.
“And to him I said, ‘Each night in the alleys of Braavos I see a thousand like him,’ and the Sealord laughed, and that day I was named the first sword.”
Arya screwed up her face. “I don’t understand.”
Syrio clicked his teeth together. “The cat was an ordinary cat, no more. The others expected a fabulous beast, so that is what they saw. How large it was, they said. It was no larger than any other cat, only fat from indolence, for the Sealord fed it from his own table. What curious small ears, they said. Its ears had been chewed away in kitten fights. And it was plainly a tomcat, yet the Sealord said ‘her,’ and that is what the others saw. Are you hearing?” Reddit discussion.
Development teams should not believe what they are told.
We created an appointment booking system. We thought it was an appointment-booking system. Later, we realized the software's purpose was to book the right people for appointments and discourage the unneeded ones.
The first 3 months of the project had half-correct requirements and software understanding.
Open your eyes
“Open your eyes is all that is needed. The heart lies and the head plays tricks with us, but the eyes see true. Look with your eyes, hear with your ears. Taste with your mouth. Smell with your nose. Feel with your skin. Then comes the thinking afterwards, and in that way, knowing the truth” Syrio Ferel
We must see what exists, not what individuals tell the development team or how developers think the software should work. Initial criteria cover 50/70% and change.
Developers build assumptions problems by assuming how software should work. Developers must quickly explain assumptions.
When a development team's assumptions are inaccurate, they must alter the code, DevOps, documentation, and tests.
It’s always faster and easier to fix requirements before code is written.
First-draft requirements can be based on old software. Development teams must grasp corporate goals and consider needs from many angles.
Testers help rethink requirements. They look at how software requirements shouldn't operate.
Technical features and benefits might misdirect software projects.
The initiatives that focused on technological possibilities developed hard-to-use software that needed extensive rewriting following user testing.
Software development
High-level criteria are different from detailed ones.
The interpretation of words determines their meaning.
Presentations are lofty, upbeat, and prejudiced.
People's perceptions may be unclear, incorrect, or just based on one perspective (half the story)
Developers can be misled by requirements, circumstances, people, plans, diagrams, designs, documentation, and many other things.
Developers receive misinformation, misunderstandings, and wrong assumptions. The development team must avoid building software with erroneous specifications.
Once code and software are written, the development team changes and fixes them.
Developers create software with incomplete information, they need to fill in the blanks to create the complete picture.
Conclusion
Yellow cats are often inaccurate when communicating requirements.
Before writing code, clarify requirements, assumptions, etc.
Everyone will pressure the development team to generate code rapidly, but this will slow down development.
Code changes are harder than requirements.

Nitin Sharma
3 years ago
The result of my side-hustle blog post with ChatGPT is remarkable.
It's free now.

Most content writers—including me—write about side hustles because they do well.
I wrote several articles on a profitable programming side hustle.
Later, I learnt about AI content-generating platforms like Jasper.ai and Copy.ai, which I thought were terrible because they required subscriptions and had bad content. Even I dislike automatic online posting.
Since ChatGPT is becoming more popular, I tried it. It's free now.
Note: I wasn’t compensated to write this piece by this tool. In other words, I don’t receive any payment from their founders. There is no affiliate link, and right now it is free to use. Also, ChatGPT can do a lot more than what I ever did.
Begin.
OpenAI account registration requires visiting the website (if you don’t have one). Just write anything into the chatbot and get a response.
First, I wrote about the top 10 2023 side businesses.
This came in seconds.
2023 is shaping up to be a year of growth and opportunity for entrepreneurs and side hustlers. With the rise of remote work and the growing gig economy, there are many income streams to consider launching in the coming year. Here are the top 10 income streams to launch in 2023:
Virtual Assistant — The demand for virtual assistants is on the rise as more businesses move online. As a virtual assistant, you can offer administrative, technical, or creative services to clients remotely.
Online Tutoring — If you have expertise in a particular subject, consider becoming an online tutor. There are many platforms that connect tutors with students looking for help with their studies.
Freelance Writing — If you have a knack for writing, consider becoming a freelance writer. You can offer your services to businesses, bloggers, and individuals looking for content for their websites or social media platforms.
Graphic Design — If you have a talent for design, consider starting a graphic design side hustle. You can create logos, banners, and other visual content for businesses and individuals.
Social Media Management — Many businesses are looking for help with managing their social media accounts. As a social media manager, you can help businesses create and execute social media strategies to reach their target audience.
Dropshipping — Dropshipping is a business model where you sell products without actually holding any inventory. You can partner with suppliers and ship the products directly to the customer on behalf of the business.
Pet Sitting — If you love animals, consider starting a pet-sitting side hustle. You can offer your services to pet owners who need someone to take care of their pets while they are away.
Home Cleaning — With busy schedules, many people are looking for help with cleaning their homes. As a home cleaning service provider, you can offer your services to help keep homes tidy and organized.
Event Planning — If you have a talent for organization and planning, consider starting an event planning side hustle. You can offer your services to help plan and execute events for businesses and individuals.
Online Teaching — With the rise of online education, there is a growing demand for online teachers. If you have expertise in a particular subject, consider becoming an online teacher and offer your services to students looking for personalized instruction.
In conclusion, 2023 is shaping up to be a great year for launching new income streams. Whether you are looking to start a virtual assistant business, become an online tutor, or offer home cleaning services, there are many opportunities to turn your skills and expertise into a profitable side hustle.
Better than most online side hustle posts, right?
Write about the top 10 programming side hustles to start in 2023.
I got this.
If you are a programmer looking to start a side hustle, 2023 is the perfect time to launch your own business. With the growing demand for software and app development, there are many opportunities for programmers to turn their skills into a profitable side hustle. Here are the top 10 programming side hustles to start in 2023:
App Development — With the rise of smartphones and tablets, there is a growing demand for app development. You can offer your services to businesses and individuals looking to create custom apps for their needs.
Website Development — Many businesses and individuals are looking for help with creating and maintaining their websites. As a website developer, you can offer your services to help design, build, and manage websites for your clients.
Software Development — If you have expertise in a particular programming language, consider starting a software development side hustle. You can offer your services to businesses and individuals looking to create custom software solutions for their needs.
Game Development — The gaming industry is thriving, and there is a growing demand for game development. If you have experience in game development, you can offer your services to businesses and individuals looking to create custom games.
Data Analysis — With the rise of big data, there is a growing demand for data analysts. As a data analyst, you can offer your services to businesses and individuals looking to make sense of their data and gain insights from it.
Machine Learning — Machine learning is a rapidly growing field, and there is a growing demand for machine learning experts. If you have experience in machine learning, you can offer your services to businesses and individuals looking to develop custom machine learning solutions.
Cloud Computing — With the rise of cloud computing, there is a growing demand for cloud experts. If you have experience in cloud computing, you can offer your services to businesses and individuals looking to migrate their applications and data to the cloud.
Blockchain Development — Blockchain technology is gaining popularity, and there is a growing demand for blockchain developers. If you have experience in blockchain development, you can offer your services to businesses and individuals looking to develop custom blockchain solutions.
Artificial Intelligence — Artificial intelligence is a rapidly growing field, and there is a growing demand for AI experts. If you have experience in artificial intelligence, you can offer your services to businesses and individuals looking to develop custom AI solutions.
Virtual Reality — Virtual reality is an exciting and emerging technology, and there is a growing demand for VR developers. If you have experience in VR development, you can offer your services to businesses and individuals looking to create custom VR experiences.
In conclusion, 2023 is a great time to start a programming side hustle. Whether you are interested in app development, website development, or machine learning, there are many opportunities for programmers to turn their skills into a profitable business.
These two blogs show that AI can simplify blog authoring.
I asked some tough programming questions, and most were suitable.
The content may occasionally not be what we want, but it will almost always be very helpful to you.
Enjoy.

Sukhad Anand
3 years ago
How Do Discord's Trillions Of Messages Get Indexed?
They depend heavily on open source..

Discord users send billions of messages daily. Users wish to search these messages. How do we index these to search by message keywords?
Let’s find out.
Discord utilizes Elasticsearch. Elasticsearch is a free, open search engine for textual, numerical, geographical, structured, and unstructured data. Apache Lucene powers Elasticsearch.
How does elastic search store data? It stores it as numerous key-value pairs in JSON documents.
How does elastic search index? Elastic search's index is inverted. An inverted index lists every unique word in every page and where it appears.
4. Elasticsearch indexes documents and generates an inverted index to make data searchable in near real-time. The index API adds or updates JSON documents in a given index.
Let's examine how discord uses Elastic Search. Elasticsearch prefers bulk indexing. Discord couldn't index real-time messages. You can't search posted messages. You want outdated messages.
6. Let's check what bulk indexing requires.
1. A temporary queue for incoming communications.
2. Indexer workers that index messages into elastic search.
Discord's queue is Celery. The queue is open-source. Elastic search won't run on a single server. It's clustered. Where should a message go? Where?
8. A shard allocator decides where to put the message. Nevertheless. Shattered? A shard combines elastic search and index on. So, these two form a shard which is used as a unit by discord. The elastic search itself has some shards. But this is different, so don’t get confused.
Now, the final part is service discovery — to discover the elastic search clusters and the hosts within that cluster. This, they do with the help of etcd another open source tool.
A great thing to notice here is that discord relies heavily on open source systems and their base implementations which is very different from a lot of other products.
You might also like
INTΞGRITY team
3 years ago
Terms of Service
Effective: August 31, 2022
These Terms of Service ("Terms") govern your access to and use of INTΞGRITY’s (or "we") websites, mobile applications, and other online products and services (collectively, the "Services"). By clicking your assent (e.g. "Continue," "Sign-in," or "Sign-up") or by utilizing our Services, you consent to these Terms, including the mandatory arbitration provision and class action waiver in the Resolving Disputes; Binding Arbitration Section.
Our Privacy Policy describes how we gather and utilize your information, while our Rules detail your duties when utilizing our Services. You agree to be bound by these Terms and our Rules by utilizing our Services. Please refer to our Privacy Statement for details on how we collect, utilize, disclose, and otherwise manage your information.
Please contact us at hello@int3grity.com if you have any queries regarding these Terms or our Services.
Account Details and Responsibilities
You are responsible for your use of the Services and any content you contribute, including compliance with all relevant laws. The Services may host content that is protected by the intellectual property rights of third parties. Please do not copy, post, download, or distribute content without permission.
You must adhere to our Rules when using the Services.
To use any or all of our services, you may need to register for an account. Contribute to the protection of your account. Protect your account's password, and maintain accurate account details. We advise you not to share your password with anyone else.
If you are accepting these Terms and using the Services on behalf of someone else (such as another person or entity), you confirm that you are allowed to do so, and the words "you" or "your" in these Terms refer to that other person or entity.
You must be at least 13 years old to access our services.
If you use the Services to access, collect, or otherwise utilize the personal information of other INTΞGRITY users ("Personal Information"), you agree to comply with all applicable laws. You also undertake not to sell any Personal Information, where "sell" has the meaning ascribed to it by relevant legislation.
For Personal Information you provide to us (as a Newsletter Editor, for example), you represent and warrant that you have lawfully collected the Personal Information and that you or a third party have provided all required notices and obtained all required consents prior to collecting the Personal Information. You further represent and warrant that INTΞGRITY’s use of such Personal Information in accordance with the purposes for which you provided the Personal Information will not violate, misappropriate, or infringe any rights of a third party (including intellectual property rights or privacy rights) or cause us to violate any applicable laws.
The Services' User Content
INTΞGRITY may monitor your conduct and material for compliance with these Terms and our Rules, and reserves the right to remove any content that violates these guidelines.
INTΞGRITY maintains the right to remove or disable content that is accused to violate the intellectual property rights of others, as well as to cancel the accounts of repeat infringers. We respond to notifications of alleged copyright violations if they comply with the law; please report such notices using our Copyright Policy.
Ownership and Rights
You maintain ownership of all content that you submit, upload, or display on or through the Services.
By submitting, posting, or displaying content on or through the Services, unless otherwise agreed in writing, you grant INTΞGRITY a nonexclusive, royalty-free, worldwide, fully paid, and sublicensable license to use, reproduce, modify, adapt, publish, translate, create derivative works from, distribute, publicly perform and display your content and any name, username or likeness provided in connection with your content in all media formats and distribution methods now known or later developed.
INTΞGRITY requires this license because you are the owner of your material, and INTΞGRITY cannot show it across its multiple platforms (mobile, online) without your consent.
This type of license is also required for content distribution throughout our Services. For example, you may publish a piece on INTΞGRITY. It is duplicated as versions on both our website and app, and distributed to many locations on INTΞGRITY, including the homepage and reading lists. A tweak could be that we display a fragment of your work as a preview (rather than the entire post), with attribution. An example of a derivative work might be a list of top authors or quotations on INTΞGRITY that includes chunks of your article, again with full attribution. This license solely applies to our Services and does not grant us permissions outside of our Services.
So long as you comply with these Terms, INTΞGRITY grants you a limited, non-exclusive, personal, and non-transferable license to access and utilize our Services.
Copyright, trademark, and other United States and international laws protect the Services. These Terms do not grant you any right, title, or interest in the Services, the material posted by other users on the Services, or INTΞGRITY’s trademarks, logos, or other brand characteristics.
In addition to the content you submit, post, or display on our Services, we appreciate your feedback, which may include your thoughts, ideas, and suggestions regarding our Services. This input may be used for any reason at our sole discretion and without obligation to you. We may treat your comments as non-confidential.
We reserve the right, at our sole discretion, to discontinue the Services or any of its features. In addition, we reserve the right to impose limits on use and storage, and to remove or restrict the distribution of content on the Services.
Termination
You are allowed to terminate your use of our services at any time. We have the right to stop or cancel your use of the Services with or without notice.
Moving and Processing Information
To enable us to deliver our Services, you accept that we may handle, transfer, and retain information about you in the United States and other countries, where you may not enjoy the same rights and protections as you do under local law.
Indemnification
To the maximum extent permitted by applicable law, you will indemnify, defend, and hold harmless INTΞGRITY, and our officers, directors, agents, partners, and employees (collectively, the "INTΞGRITY Parties"), from and against any losses, liabilities, claims, demands, damages, expenses or costs ("Claims") arising out of or relating to your violation, misappropriation, or infringement of any rights of another (including intellectual property rights or privacy rights). You undertake to promptly notify INTΞGRITY Parties of any third-party Claims, to assist INTΞGRITY Parties in fighting such Claims, and to pay any fees, charges, and expenses connected with defending such Claims (including attorneys' fees). You further agree that, at INTΞGRITY’s sole discretion, the INTΞGRITY Parties will govern the defense or settlement of any third-party Claims.
Disclaimers — Services Provided "As Is"
INTΞGRITY strives to provide you with excellent Services, but there are certain things we cannot guarantee. Utilization of our services is at your own risk. You acknowledge that our Services and any content uploaded or shared by users on the Services are given "as is" and "as available" without explicit or implied warranties of any kind, including warranties of merchantability, fitness for a particular purpose, title, and non-infringement. In addition, INTΞGRITY does not represent or promise that our Services are accurate, comprehensive, dependable, up-to-date, or error-free. No advice or information gained from INTΞGRITY or via the Services shall create any warranty or representation unless expressly set forth in this section. INTΞGRITY may provide information on third-party products, services, activities, or events, or we may permit third parties to make their material and information accessible via our Services (collectively, "Third-Party Content"). We neither control nor endorse any Third-Party Content, nor do we make any claims or warranties about it. Accessing and utilizing Third-Party Content is at your own risk. The disclaimers in this section may not apply to you if they are prohibited in your location.
Limitation of Liability
We do not exclude or limit our obligation to you where it would be unlawful to do so; this includes any liability for the gross negligence, fraud, or willful misconduct of INTΞGRITY or the other INTΞGRITY Parties in providing the Services. In jurisdictions where the foregoing exclusions are not permitted, our liability to you is limited to losses and damages that are reasonably foreseeable as a result of our failure to exercise reasonable care and skill or breach of contract with you. This paragraph does not impact consumer rights that cannot be waived or limited by contract.
In jurisdictions that permit liability exclusions or limits, INTΞGRITY and INTΞGRITY Parties will not be liable for:
(a) Any indirect, consequential, exemplary, incidental, punitive, or extraordinary damages, or any loss of use, data, or profits, based on any legal theory, even if INTΞGRITY or the other INTΞGRITY Parties were advised of the potential of such damages.
(b) Except for the types of liability we cannot limit by law (as described in this section), we limit the total liability of INTΞGRITY and the other INTΞGRITY Parties for any claim arising out of or related to these Terms or our Services, regardless of the form of action, to $100.00 USD.
Arbitration; Resolution of Disputes
We intend to address your concerns without filing a formal lawsuit. Before making a claim against INTΞGRITY, you agree to contact us and attempt to resolve the dispute informally by emailing hello@int3grity.com or by sending certified mail to INTΞGRITY, P.O. JOY, 479 Jessie St, San Francisco, CA 94103. The notice must (a) contain your name, address, email address, and telephone number; (b) identify the nature and grounds of the claim; and (c) detail the relief requested. Our notice to you will be sent to the email address linked with your online account and will contain the information specified in the preceding section. Any party may commence a formal procedure if we are unable to reach a resolution within thirty (30) days of the date of any notice.
Please read the following section carefully because it compels you to arbitrate certain claims and disputes with INTΞGRITY and limits the method in which you can seek redress from us, unless you opt out of arbitration by following the steps provided below. This arbitration provision does not permit class or representative lawsuits or arbitrations. In addition, arbitration prohibits you from filing a lawsuit or having a jury trial.
(a) Absence of Representative Actions You and INTΞGRITY agree that any dispute arising out of or relating to these Terms or our Services is personal to you and INTΞGRITY and will be resolved entirely via individual action, and not by class arbitration, class action, or other representative procedure.
(b) Dispute Arbitration. Except for small claims disputes in which you or INTΞGRITY seeks to bring an individual action in small claims court located in the county where you reside and disputes in which you or INTΞGRITY seeks injunctive or other equitable relief for the alleged infringement or misappropriation of intellectual property, you and INTΞGRITY waive your rights to a jury trial and to have any other dispute arising out of or relating to these Terms or our Services, including claims related to privity of contract, decided by a jury. All Disputes submitted to JAMS shall be decided by confidential, binding arbitration before a single arbitrator. If you are a consumer, you may choose to have the arbitration in your county of residence. A "consumer" is a person who uses the Services for personal, family, or household purposes for the purposes of this provision. You and INTΞGRITY agree that Disputes shall be resolved using the JAMS Streamlined Arbitration Rules and Procedures ("JAMS Rules"). The latest version of the JAMS Rules is accessible on the JAMS website and is incorporated herein by reference. Either you accept and agree that you have read and comprehended the JAMS Rules or you forfeit your right to read the JAMS Rules and any claim that the JAMS Rules are unreasonable or should not apply for any reason.
(c) You and INTΞGRITY agree that these Terms affect interstate commerce and that the enforceability of this provision is subject to the Federal Arbitration Act, 9 U.S.C. 1 et seq. (the "FAA"), to the maximum extent permissible by applicable law. As limited by the FAA, these Terms, and the JAMS Rules, the arbitrator will have sole authority to make all procedural and substantive judgments regarding any Dispute, and to grant any remedy that would otherwise be available in court, including the authority to determine arbitrability. The arbitrator may only conduct an individual arbitration and may not consolidate the claims of more than one party, preside over any sort of class or representative procedure, or preside over any proceeding involving more than one party.
d) The arbitration will permit the discovery or exchange of nonconfidential information pertinent to the Dispute. The arbitrator, INTΞGRITY, and you will maintain the confidentiality of all arbitration proceedings, judgments, and awards, as well as any information gathered, prepared, or presented for the purposes of the arbitration or relating to the Dispute(s) therein. Unless the law specifies otherwise, the arbitrator will have the right to make decisions that protect confidentiality. The duty of confidentiality does not apply where disclosure is required to prepare for or conduct the arbitration hearing on the merits, in connection with a court application for a preliminary remedy, in connection with a judicial challenge to an arbitration award or its enforcement, or where disclosure is otherwise required by law or judicial decision.
e) You and INTΞGRITY agree that for any arbitration you begin, you will pay the filing fee (up to $250 if you are a consumer) and INTΞGRITY will pay the remaining JAMS fees and costs. INTΞGRITY will pay all JAMS fees and costs for any and all arbitrations it initiates. You and INTΞGRITY agree that the state and federal courts of California and the United States located in San Francisco have exclusive jurisdiction over any appeals and the implementation of an arbitration award.
(f) Any Dispute must be filed within one year after the relevant claim arose; otherwise, the Dispute is permanently barred, meaning that neither you nor INTΞGRITY will be able to assert the claim.
(g) You have the right to opt-out of binding arbitration within 30 days of the date you initially accepted the terms of this section by sending an email to hello@int3grity.com. For the opt-out notification to be effective, it must include your full name and address and clearly explain your intent to opt out of binding arbitration. By declining binding arbitration, you consent to the resolution of Disputes in accordance with "Governing Law and Venue" below.
(h) If any portion of this section is found to be unenforceable or unlawful for any reason: (1) the unenforceable or unlawful provision shall be severed from these Terms; (2) the severance of the unenforceable or unlawful provision shall have no effect whatsoever on the remainder of this section or the parties' ability to compel arbitration of any remaining claims on an individual basis pursuant to this section; and (3) to the extent that any claims must therefore proceed on an individual basis, the parties agree to arbitrate those claims on an individual basis. In addition, if it is determined that any portion of this section prohibits an individual claim seeking public injunctive relief, that provision will be null and void to the extent that such relief may be sought outside of arbitration, and the balance of this section will be enforceable.
Statute and Location
These Terms and any dispute that may arise between you and INTΞGRITY are governed by California law, excluding its conflict of law provisions. Any issue between the parties that is not arbitrable or cannot be heard in small claims court will be determined by the state or federal courts of California and the United States, sitting in San Francisco, California.
Some nations have regulations that require agreements to be controlled by the consumer's country's laws. These statutes are not overridden by this paragraph.
Amendments
Periodically, we may make modifications to these Terms. If we make modifications, we will notify you by sending an email to the address connected with your account, providing an in-product message, or amending the date at the top of these Terms. Unless we specify otherwise in our notification, the modified Terms will take effect immediately, and your continued use of our Services after we issue such notice indicates your acceptance of the changes. If you do not accept the updated Terms, you must cease using our services.
Severability
If any section or portion of a provision of these Terms is determined to be unlawful, void, or unenforceable, that provision or part of the provision shall be deemed severable from these Terms and shall not affect the validity and enforceability of the other terms.
Miscellaneous INTΞGRITY’s omission to assert or enforce any right or term of these Terms is not a waiver of such right or provision. These Terms and the terms and policies specified in the Other Terms and Policies that May Apply to You Section constitute the complete agreement between the parties pertaining to the subject matter hereof and supersede all prior agreements, statements, and understandings between the parties. The section headings in these Terms are for convenience only and have no legal or contractual significance. The use of the word "including" shall be taken to mean "including without limitation." Unless otherwise specified, these Terms are intended solely for the benefit of the parties and are not intended to confer third-party beneficiary rights on any other person or entity. You consent to the use of electronic means for our communications and transactions.

Mangu Solutions
3 years ago
Growing a New App to $15K/mo in 6 Months [SaaS Case Study]
Discover How We Used Facebook Ads to Grow a New Mobile App from $0 to $15K MRR in Just 6 Months and Our Strategy to Hit $100K a Month.
Our client introduced a mobile app for Poshmark resellers in December and wanted as many to experience it and subscribe to the monthly plan.
An Error We Committed
We initiated a Facebook ad campaign with a "awareness" goal, not "installs." This sent them to a landing page that linked to the iPhone App Store and Android Play Store. Smart, right?
We got some installs, but we couldn't tell how many came from the ad versus organic/other channels because the objective we chose only reported landing page clicks, not app installs.
We didn't know which interest groups/audiences had the best cost per install (CPI) to optimize and scale our budget.
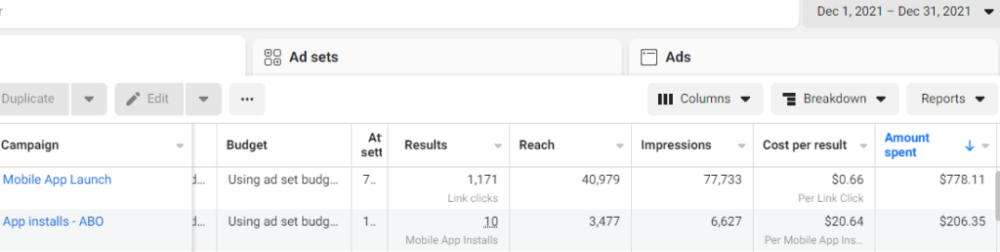
After spending $700 without adequate data (installs and trials report), we stopped the campaign and worked with our client's app developer to set up app events tracking.
This allowed us to create an installs campaign and track installs, trials, and purchases (in some cases).
Finding a Successful Audience
Once we knew what ad sets brought in what installs at what cost, we began optimizing and testing other interest groups and audiences, growing the profitable low CPI ones and eliminating the high CPI ones.
We did all our audience testing using an ABO campaign (Ad Set Budget Optimization), spending $10 to $30 on each ad set for three days and optimizing afterward. All ad sets under $30 were moved to a CBO campaign (Campaign Budget Optimization).
We let Facebook's AI decide how much to spend on each ad set, usually the one most likely to convert at the lowest cost.
If the CBO campaign maintains a nice CPI, we keep increasing the budget by $50 every few days or duplicating it sometimes in order to double the budget. This is how we've scaled to $400/day profitably.
Finding Successful Creatives
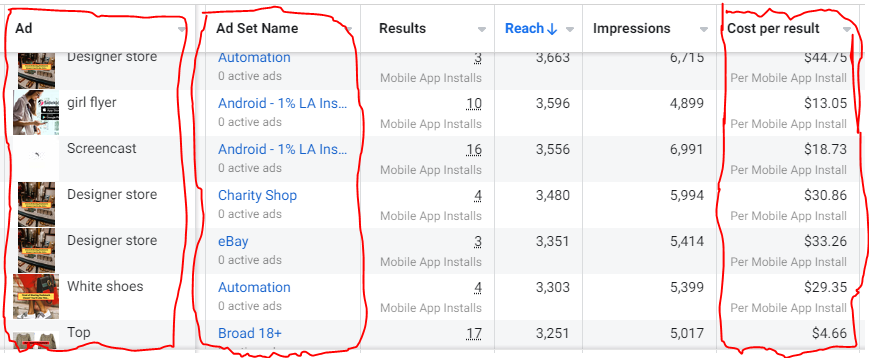
Per campaign, we tested 2-6 images/videos. Same ad copy and CTA. There was no clear winner because some images did better with some interest groups.
The image above with mail packages, for example, got us a cheap CPI of $9.71 from our Goodwill Stores interest group but, a high $48 CPI from our lookalike audience. Once we had statistically significant data, we turned off the high-cost ad.
New marketers who are just discovering A/B testing may assume it's black and white — winner and loser. However, Facebook ads' machine learning and reporting has gotten so sophisticated that it's hard to call a creative a flat-out loser, but rather a 'bad fit' for some audiences, and perfect for others.
You can see how each creative performs across age groups and optimize.
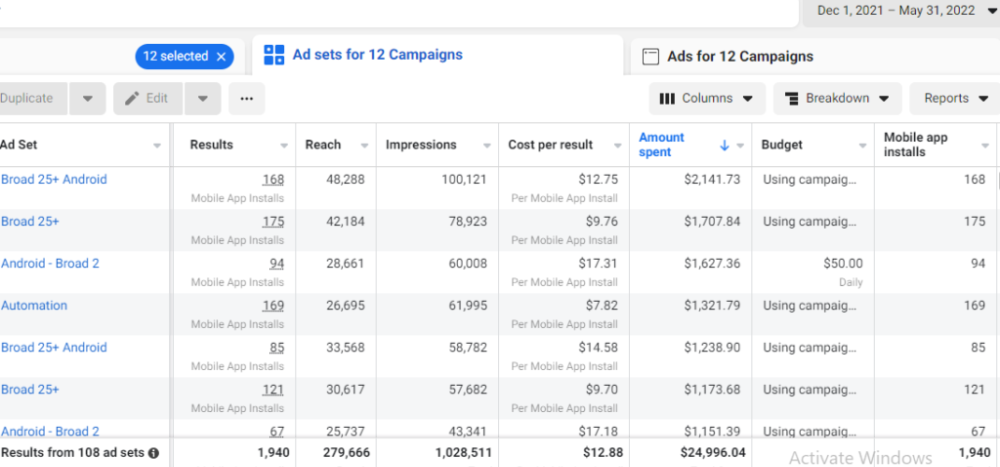
How Many Installs Did It Take Us to Earn $15K Per Month?
Six months after paying $25K, we got 1,940 app installs, 681 free trials, and 522 $30 monthly subscriptions. 522 * $30 gives us $15,660 in monthly recurring revenue (MRR).
Next, what? $100K per month
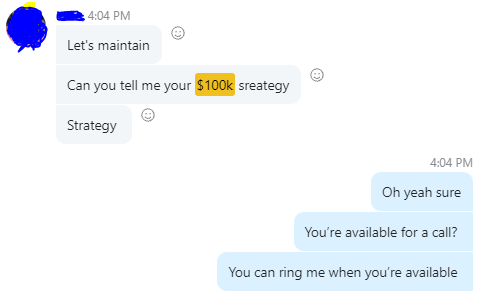
The conversation above is with the app's owner. We got on a 30-minute call where I shared how I plan to get the app to be making $100K a month like I’ve done for other businesses.
Reverse Engineering $100K
Formula:
For $100K/month, we need 3,334 people to pay $30/month. 522 people pay that. We need 2,812 more paid users.
522 paid users from 1,940 installs is a 27% conversion rate. To hit $100K/month, we need 10,415 more installs. Assuming...
With a $400 daily ad spend, we average 40 installs per day. This means that if everything stays the same, it would take us 260 days (around 9 months) to get to $100K a month (MRR).
Conclusion
You must market your goods to reach your income objective (without waiting forever). Paid ads is the way to go if you hate knocking on doors or irritating friends and family (who aren’t scalable anyways).
You must also test and optimize different angles, audiences, interest groups, and creatives.

Alexandra Walker-Jones
3 years ago
These are the 15 foods you should eat daily and why.
Research on preventing disease, extending life, and caring for your body from the inside out

Grapefruit and pomegranates aren't on the list, so ignore that. Mostly, I enjoyed the visual, but those fruits are healthful, too.
15 (or 17 if you consider the photo) different foods a day sounds like a lot. If you're not used to it — it is.
These lists don't aim for perfection. Instead, use this article and the science below to eat more of these foods. If you can eat 5 foods one day and 5 the next, you're doing well. This list should be customized to your requirements and preferences.
“Every time you eat or drink, you are either feeding disease or fighting it” -Heather Morgan.
The 15 Foods That You Should Consume Daily and Why:
1. Dark/Red Berries
(blueberries, blackberries, acai, goji, cherries, strawberries, raspberries)
The 2010 Global Burden of Disease Study is the greatest definitive analysis of death and disease risk factors in history. They found the primary cause of both death, disability, and disease inside the United States was diet.
Not eating enough fruit, and specifically berries, was one of the best predictors of disease (1).
What's special about berries? It's their color! Berries have the most antioxidants of any fruit, second only to spices. The American Cancer Society found that those who ate the most berries were less likely to die of cardiovascular disease.
2. Beans
Soybeans, black beans, kidney beans, lentils, split peas, chickpeas.
Beans are one of the most important predictors of survival in older people, according to global research (2).
For every 20 grams (2 tablespoons) of beans consumed daily, the risk of death is reduced by 8%.
Soybeans and soy foods are high in phytoestrogen, which reduces breast and prostate cancer risks. Phytoestrogen blocks the receptors' access to true estrogen, mitigating the effects of weight gain, dairy (high in estrogen), and hormonal fluctuations (3).
3. Nuts
(almonds, walnuts, pecans, pistachios, Brazil nuts, cashews, hazelnuts, macadamia nuts)
Eating a handful of nuts every day reduces the risk of chronic diseases like heart disease and diabetes. Nuts also reduce oxidation, blood sugar, and LDL (bad) cholesterol, improving arterial function (4).
Despite their high-fat content, studies have linked daily nut consumption to a slimmer waistline and a lower risk of obesity (5).
4. Flaxseed
(milled flaxseed)
2013 research found that ground flaxseed had one of the strongest anti-hypertensive effects of any food. A few tablespoons (added to a smoothie or baked goods) lowered blood pressure and stroke risk 23 times more than daily aerobic exercise (6).
Flax shouldn't replace exercise, but its nutritional punch is worth adding to your diet.
5. Other seeds
(chia seeds, hemp seeds, pumpkin seeds, sesame seeds, fennel seeds)
Seeds are high in fiber and omega-3 fats and can be added to most dishes without being noticed.
When eaten with or after a meal, chia seeds moderate blood sugar and reduce inflammatory chemicals in the blood (7). Overall, a great daily addition.
6. Dates
Dates are one of the world's highest sugar foods, with 80% sugar by weight. Pure cake frosting is 60%, maple syrup is 66%, and cotton-candy jelly beans are 70%.
Despite their high sugar content, dates have a low glycemic index, meaning they don't affect blood sugar levels dramatically. They also improve triglyceride and antioxidant stress levels (8).
Dates are a great source of energy and contain high levels of dietary fiber and polyphenols, making 3-10 dates a great way to fight disease, support gut health with prebiotics, and satisfy a sweet tooth (9).
7. Cruciferous Veggies
(broccoli, Brussel sprouts, horseradish, kale, cauliflower, cabbage, boy choy, arugula, radishes, turnip greens)
Cruciferous vegetables contain an active ingredient that makes them disease-fighting powerhouses. Sulforaphane protects our brain, eyesight, against free radicals and environmental hazards, and treats and prevents cancer (10).
Unless you eat raw cruciferous vegetables daily, you won't get enough sulforaphane (and thus, its protective nutritional benefits). Cooking destroys the enzyme needed to create this super-compound.
If you chop broccoli, cauliflower, or turnip greens and let them sit for 45 minutes before cooking them, the enzyme will have had enough time to work its sulforaphane magic, allowing the vegetables to retain the same nutritional value as if eaten raw. Crazy, right? For more on this, see What Chopping Your Vegetables Has to Do with Fighting Cancer.
8. Whole grains
(barley, brown rice, quinoa, oats, millet, popcorn, whole-wheat pasta, wild rice)
Whole-grains are one of the healthiest ways to consume your daily carbs and help maintain healthy gut flora.
This happens when fibre is broken down in the colon and starts a chain reaction, releasing beneficial substances into the bloodstream and reducing the risk of Type 2 Diabetes and inflammation (11).
9. Spices
(turmeric, cumin, cinnamon, ginger, saffron, cloves, cardamom, chili powder, nutmeg, coriander)
7% of a person's cells will have DNA damage. This damage is caused by tiny breaks in our DNA caused by factors like free-radical exposure.
Free radicals cause mutations that damage lipids, proteins, and DNA, increasing the risk of disease and cancer. Free radicals are unavoidable because they result from cellular metabolism, but they can be avoided by consuming anti-oxidant and detoxifying foods.
Including spices and herbs like rosemary or ginger in our diet may cut DNA damage by 25%. Yes, this damage can be improved through diet. Turmeric worked better at a lower dose (just a pinch, daily). For maximum free-radical fighting (and anti-inflammatory) effectiveness, use 1.5 tablespoons of similar spices (12).
10. Leafy greens
(spinach, collard greens, lettuce, other salad greens, swiss chard)
Studies show that people who eat more leafy greens perform better on cognitive tests and slow brain aging by a year or two (13).
As we age, blood flow to the brain drops due to a decrease in nitric oxide, which prevents blood vessels from dilatation. Daily consumption of nitrate-rich vegetables like spinach and swiss chard may prevent dementia and Alzheimer's.
11. Fermented foods
(sauerkraut, tempeh, kombucha, plant-based kefir)
Miso, kimchi, and sauerkraut contain probiotics that support gut microbiome.
Probiotics balance the good and bad bacteria in our bodies and offer other benefits. Fermenting fruits and vegetables increases their antioxidant and vitamin content, preventing disease in multiple ways (14).
12. Sea vegetables
(seaweed, nori, dulse flakes)
A population study found that eating one sheet of nori seaweed per day may cut breast cancer risk by more than half (15).
Seaweed and sea vegetables may help moderate estrogen levels in the metabolism, reducing cancer and disease risk.
Sea vegetables make up 30% of the world's edible plants and contain unique phytonutrients. A teaspoon of these super sea-foods on your dinner will help fight disease from the inside out.
13. Water
I'm less concerned about whether you consider water food than whether you drink enough. If this list were ranked by what single item led to the best health outcomes, water would be first.
Research shows that people who drink 5 or more glasses of water per day have a 50% lower risk of dying from heart disease than those who drink 2 or less (16).
Drinking enough water boosts energy, improves skin, mental health, and digestion, and reduces the risk of various health issues, including obesity.
14. Tea
All tea consumption is linked to a lower risk of stroke, heart disease, and early death, with green tea leading for antioxidant content and immediate health benefits.
Green tea leaves may also be able to interfere with each stage of cancer formation, from the growth of the first mutated cell to the spread and progression of cancer in the body. Green tea is a quick and easy way to support your long-term and short-term health (17).
15. Supplemental B12 vitamin
B12, or cobalamin, is a vitamin responsible for cell metabolism. Not getting enough B12 can have serious consequences.
Historically, eating vegetables from untreated soil helped humans maintain their vitamin B12 levels. Due to modern sanitization, our farming soil lacks B12.
B12 is often cited as a problem only for vegetarians and vegans (as animals we eat are given B12 supplements before slaughter), but recent studies have found that plant-based eaters have lower B12 deficiency rates than any other diet (18).
Article Sources: