


More on Entrepreneurship/Creators

Thomas Tcheudjio
3 years ago
If you don't crush these 3 metrics, skip the Series A.
I recently wrote about getting VCs excited about Marketplace start-ups. SaaS founders became envious!
Understanding how people wire tens of millions is the only Series A hack I recommend.
Few people understand the intellectual process behind investing.
VC is risk management.
Series A-focused VCs must cover two risks.
1. Market risk
You need a large market to cross a threshold beyond which you can build defensibilities. Series A VCs underwrite market risk.
They must see you have reached product-market fit (PMF) in a large total addressable market (TAM).
2. Execution risk
When evaluating your growth engine's blitzscaling ability, execution risk arises.
When investors remove operational uncertainty, they profit.
Series A VCs like businesses with derisked revenue streams. Don't raise unless you have a predictable model, pipeline, and growth.
Please beat these 3 metrics before Series A:
Achieve $1.5m ARR in 12-24 months (Market risk)
Above 100% Net Dollar Retention. (Market danger)
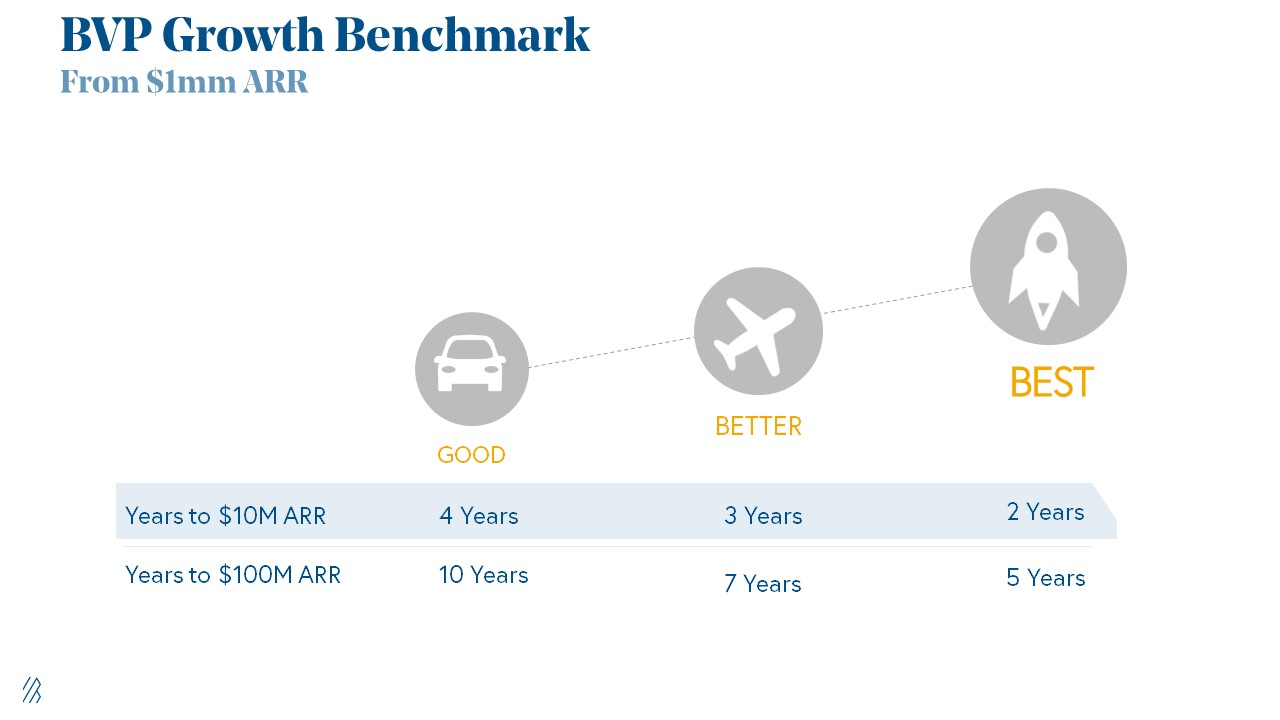
Lead Velocity Rate supporting $10m ARR in 2–4 years (Execution risk)
Hit the 3 and you'll raise $10M in 4 months. Discussing 2/3 may take 6–7 months.
If none, don't bother raising and focus on becoming a capital-efficient business (Topics for other posts).
Let's examine these 3 metrics for the brave ones.
1. Lead Velocity Rate supporting €$10m ARR in 2 to 4 years
Last because it's the least discussed. LVR is the most reliable data when evaluating a growth engine, in my opinion.
SaaS allows you to see the future.
Monthly Sales and Sales Pipelines, two predictive KPIs, have poor data quality. Both are lagging indicators, and minor changes can cause huge modeling differences.
Analysts and Associates will trash your forecasts if they're based only on Monthly Sales and Sales Pipeline.
LVR, defined as month-over-month growth in qualified leads, is rock-solid. There's no lag. You can See The Future if you use Qualified Leads and a consistent formula and process to qualify them.
With this metric in your hand, scaling your company turns into an execution play on which VCs are able to perform calculations risk.
2. Above-100% Net Dollar Retention.
Net Dollar Retention is a better-known SaaS health metric than LVR.
Net Dollar Retention measures a SaaS company's ability to retain and upsell customers. Ask what $1 of net new customer spend will be worth in years n+1, n+2, etc.
Depending on the business model, SaaS businesses can increase their share of customers' wallets by increasing users, selling them more products in SaaS-enabled marketplaces, other add-ons, and renewing them at higher price tiers.
If a SaaS company's annualized Net Dollar Retention is less than 75%, there's a problem with the business.
Slack's ARR chart (below) shows how powerful Net Retention is. Layer chart shows how existing customer revenue grows. Slack's S1 shows 171% Net Dollar Retention for 2017–2019.

Slack S-1
3. $1.5m ARR in the last 12-24 months.
According to Point 9, $0.5m-4m in ARR is needed to raise a $5–12m Series A round.
Target at least what you raised in Pre-Seed/Seed. If you've raised $1.5m since launch, don't raise before $1.5m ARR.
Capital efficiency has returned since Covid19. After raising $2m since inception, it's harder to raise $1m in ARR.

P9's 2016-2021 SaaS Funding Napkin
In summary, less than 1% of companies VCs meet get funded. These metrics can help you win.
If there’s demand for it, I’ll do one on direct-to-consumer.
Cheers!

DC Palter
3 years ago
Is Venture Capital a Good Fit for Your Startup?
5 VC investment criteria
I reviewed 200 startup business concepts last week. Brainache.
The enterprises sold various goods and services. The concepts were achingly similar: give us money, we'll produce a product, then get more to expand. No different from daily plans and pitches.
Most of those 200 plans sounded plausible. But 10% looked venture-worthy. 90% of startups need alternatives to venture finance.
With the success of VC-backed businesses and the growth of venture funds, a common misperception is that investors would fund any decent company idea. Finding investors that believe in the firm and founders is the key to funding.
Incorrect. Venture capital needs investing in certain enterprises. If your startup doesn't match the model, as most early-stage startups don't, you can revise your business plan or locate another source of capital.
Before spending six months pitching angels and VCs, make sure your startup fits these criteria.
Likely to generate $100 million in sales
First, I check the income predictions in a pitch deck. If it doesn't display $100M, don't bother.
The math doesn't work for venture financing in smaller businesses.
Say a fund invests $1 million in a startup valued at $5 million that is later acquired for $20 million. That's a win everyone should celebrate. Most VCs don't care.
Consider a $100M fund. The fund must reach $360M in 7 years with a 20% return. Only 20-30 investments are possible. 90% of the investments will fail, hence the 23 winners must return $100M-$200M apiece. $15M isn't worth the work.
Angel investors and tiny funds use the same ideas as venture funds, but their smaller scale affects the calculations. If a company can support its growth through exit on less than $2M in angel financing, it must have $25M in revenues before large companies will consider acquiring it.
Aiming for Hypergrowth
A startup's size isn't enough. It must expand fast.
Developing a great business takes time. Complex technology must be constructed and tested, a nationwide expansion must be built, or production procedures must go from lab to pilot to factories. These can be enormous, world-changing corporations, but venture investment is difficult.
The normal 10-year venture fund life. Investments are made during first 3–4 years.. 610 years pass between investment and fund dissolution. Funds need their investments to exit within 5 years, 7 at the most, therefore add a safety margin.
Longer exit times reduce ROI. A 2-fold return in a year is excellent. Loss at 2x in 7 years.
Lastly, VCs must prove success to raise their next capital. The 2nd fund is raised from 1st fund portfolio increases. Third fund is raised using 1st fund's cash return. Fund managers must raise new money quickly to keep their jobs.
Branding or technology that is protected
No big firm will buy a startup at a high price if they can produce a competing product for less. Their development teams, consumer base, and sales and marketing channels are large. Who needs you?
Patents, specialist knowledge, or brand name are the only answers. The acquirer buys this, not the thing.
I've heard of several promising startups. It's not a decent investment if there's no exit strategy.
A company that installs EV charging stations in apartments and shopping areas is an example. It's profitable, repeatable, and big. A terrific company. Not a startup.
This building company's operations aren't secret. No technology to protect, no special information competitors can't figure out, no go-to brand name. Despite the immense possibilities, a large construction company would be better off starting their own.
Most venture businesses build products, not services. Services can be profitable but hard to safeguard.
Probable purchase at high multiple
Once a software business proves its value, acquiring it is easy. Pharma and medtech firms have given up on their own research and instead acquire startups after regulatory permission. Many startups, especially in specialized areas, have this weakness.
That doesn't mean any lucrative $25M-plus business won't be acquired. In many businesses, the venture model requires a high exit premium.
A startup invents a new glue. 3M, BASF, Henkel, and others may buy them. Adding more adhesive to their catalogs won't boost commerce. They won't compete to buy the business. They'll only buy a startup at a profitable price. The acquisition price represents a moderate EBITDA multiple.
The company's $100M revenue presumably yields $10m in profits (assuming they’ve reached profitability at all). A $30M-$50M transaction is likely. Not terrible, but not what venture investors want after investing $25M to create a plant and develop the business.
Private equity buys profitable companies for a moderate profit multiple. It's a good exit for entrepreneurs, but not for investors seeking 10x or more what PE firms pay. If a startup offers private equity as an exit, the conversation is over.
Constructed for purchase
The startup wants a high-multiple exit. Unless the company targets $1B in revenue and does an IPO, exit means acquisition.
If they're constructing the business for acquisition or themselves, founders must decide.
If you want an indefinitely-running business, I applaud you. We need more long-term founders. Most successful organizations are founded around consumer demands, not venture capital's urge to grow fast and exit. Not venture funding.
if you don't match the venture model, what to do
VC funds moonshots. The 10% that succeed are extraordinary. Not every firm is a rocketship, and launching the wrong startup into space, even with money, will explode.
But just because your startup won't make $100M in 5 years doesn't mean it's a bad business. Most successful companies don't follow this model. It's not venture capital-friendly.
Although venture capital gets the most attention due to a few spectacular triumphs (and disasters), it's not the only or even most typical option to fund a firm.
Other ways to support your startup:
Personal and family resources, such as credit cards, second mortgages, and lines of credit
bootstrapping off of sales
government funding and honors
Private equity & project financing
collaborating with a big business
Including a business partner
Before pitching angels and VCs, be sure your startup qualifies. If so, include them in your pitch.

Sanjay Priyadarshi
3 years ago
Using Ruby code, a programmer created a $48,000,000,000 product that Elon Musk admired.
Unexpected Success

Shopify CEO and co-founder Tobias Lutke. Shopify is worth $48 billion.
World-renowned entrepreneur Tobi
Tobi never expected his first online snowboard business to become a multimillion-dollar software corporation.
Tobi founded Shopify to establish a 20-person company.
The publicly traded corporation employs over 10,000 people.
Here's Tobi Lutke's incredible story.
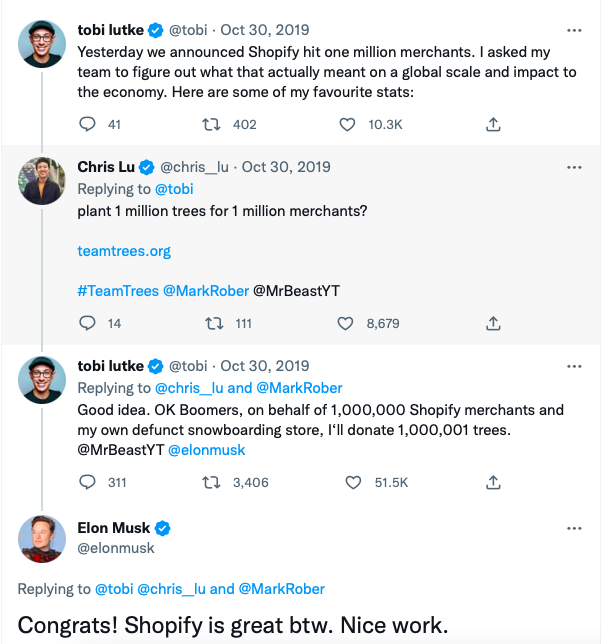
Elon Musk tweeted his admiration for the Shopify creator.
30-October-2019.
Musk praised Shopify founder Tobi Lutke on Twitter.
Happened:
Explore this programmer's journey.
What difficulties did Tobi experience as a young child?
Germany raised Tobi.
Tobi's parents realized he was smart but had trouble learning as a toddler.
Tobi was learning disabled.
Tobi struggled with school tests.
Tobi's learning impairments were undiagnosed.
Tobi struggled to read as a dyslexic.
Tobi also found school boring.
Germany's curriculum didn't inspire Tobi's curiosity.
“The curriculum in Germany was taught like here are all the solutions you might find useful later in life, spending very little time talking about the problem…If I don’t understand the problem I’m trying to solve, it’s very hard for me to learn about a solution to a problem.”
Studying computer programming
After tenth grade, Tobi decided school wasn't for him and joined a German apprenticeship program.
This curriculum taught Tobi software engineering.
He was an apprentice in a small Siemens subsidiary team.
Tobi worked with rebellious Siemens employees.
Team members impressed Tobi.
Tobi joined the team for this reason.
Tobi was pleased to get paid to write programming all day.
His life could not have been better.
Devoted to snowboarding
Tobi loved snowboarding.
He drove 5 hours to ski at his folks' house.
His friends traveled to the US to snowboard when he was older.
However, the cheap dollar conversion rate led them to Canada.
2000.
Tobi originally decided to snowboard instead than ski.
Snowboarding captivated him in Canada.
On the trip to Canada, Tobi encounters his wife.
Tobi meets his wife Fiona McKean on his first Canadian ski trip.
They maintained in touch after the trip.
Fiona moved to Germany after graduating.
Tobi was a startup coder.
Fiona found work in Germany.
Her work included editing, writing, and academics.
“We lived together for 10 months and then she told me that she need to go back for the master's program.”
With Fiona, Tobi immigrated to Canada.
Fiona invites Tobi.
Tobi agreed to move to Canada.
Programming helped Tobi move in with his girlfriend.
Tobi was an excellent programmer, therefore what he did in Germany could be done anywhere.
He worked remotely for his German employer in Canada.
Tobi struggled with remote work.
Due to poor communication.
No slack, so he used email.
Programmers had trouble emailing.
Tobi's startup was developing a browser.
After the dot-com crash, individuals left that startup.
It ended.
Tobi didn't intend to work for any major corporations.
Tobi left his startup.
He believed he had important skills for any huge corporation.
He refused to join a huge corporation.
Because of Siemens.
Tobi learned to write professional code and about himself while working at Siemens in Germany.
Siemens culture was odd.
Employees were distrustful.
Siemens' rigorous dress code implies that the corporation doesn't trust employees' attire.
It wasn't Tobi's place.
“There was so much bad with it that it just felt wrong…20-year-old Tobi would not have a career there.”
Focused only on snowboarding
Tobi lived in Ottawa with his girlfriend.
Canada is frigid in winter.
Ottawa's winters last.
Almost half a year.
Tobi wanted to do something worthwhile now.
So he snowboarded.
Tobi began snowboarding seriously.
He sought every snowboarding knowledge.
He researched the greatest snowboarding gear first.
He created big spreadsheets for snowboard-making technologies.
Tobi grew interested in selling snowboards while researching.
He intended to sell snowboards online.
He had no choice but to start his own company.
A small local company offered Tobi a job.
Interested.
He must sign papers to join the local company.
He needed a work permit when he signed the documents.
Tobi had no work permit.
He was allowed to stay in Canada while applying for permanent residency.
“I wasn’t illegal in the country, but my state didn’t give me a work permit. I talked to a lawyer and he told me it’s going to take a while until I get a permanent residency.”
Tobi's lawyer told him he cannot get a work visa without permanent residence.
His lawyer said something else intriguing.
Tobis lawyer advised him to start a business.
Tobi declined this local company's job offer because of this.
Tobi considered opening an internet store with his technical skills.
He sold snowboards online.
“I was thinking of setting up an online store software because I figured that would exist and use it as a way to sell snowboards…make money while snowboarding and hopefully have a good life.”
What brought Tobi and his co-founder together, and how did he support Tobi?
Tobi lived with his girlfriend's parents.
In Ottawa, Tobi encounters Scott Lake.
Scott was Tobis girlfriend's family friend and worked for Tobi's future employer.
Scott and Tobi snowboarded.
Tobi pitched Scott his snowboard sales software idea.
Scott liked the idea.
They planned a business together.
“I was looking after the technology and Scott was dealing with the business side…It was Scott who ended up developing relationships with vendors and doing all the business set-up.”
Issues they ran into when attempting to launch their business online
Neither could afford a long-term lease.
That prompted their online business idea.
They would open a store.
Tobi anticipated opening an internet store in a week.
Tobi seeks open-source software.
Most existing software was pricey.
Tobi and Scott couldn't afford pricey software.
“In 2004, I was sitting in front of my computer absolutely stunned realising that we hadn’t figured out how to create software for online stores.”
They required software to:
to upload snowboard images to the website.
people to look up the types of snowboards that were offered on the website. There must be a search feature in the software.
Online users transmit payments, and the merchant must receive them.
notifying vendors of the recently received order.
No online selling software existed at the time.
Online credit card payments were difficult.
How did they advance the software while keeping expenses down?
Tobi and Scott needed money to start selling snowboards.
Tobi and Scott funded their firm with savings.
“We both put money into the company…I think the capital we had was around CAD 20,000(Canadian Dollars).”
Despite investing their savings.
They minimized costs.
They tried to conserve.
No office rental.
They worked in several coffee shops.
Tobi lived rent-free at his girlfriend's parents.
He installed software in coffee cafes.
How were the software issues handled?
Tobi found no online snowboard sales software.
Two choices remained:
Change your mind and try something else.
Use his programming expertise to produce something that will aid in the expansion of this company.
Tobi knew he was the sole programmer working on such a project from the start.
“I had this realisation that I’m going to be the only programmer who has ever worked on this, so I don’t have to choose something that lots of people know. I can choose just the best tool for the job…There is been this programming language called Ruby which I just absolutely loved ”
Ruby was open-source and only had Japanese documentation.
Latin is the source code.
Tobi used Ruby twice.
He assumed he could pick the tool this time.
Why not build with Ruby?
How did they find their first time operating a business?
Tobi writes applications in Ruby.
He wrote the initial software version in 2.5 months.
Tobi and Scott founded Snowdevil to sell snowboards.
Tobi coded for 16 hours a day.
His lifestyle was unhealthy.
He enjoyed pizza and coke.
“I would never recommend this to anyone, but at the time there was nothing more interesting to me in the world.”
Their initial purchase and encounter with it
Tobi worked in cafes then.
“I was working in a coffee shop at this time and I remember everything about that day…At some time, while I was writing the software, I had to type the email that the software would send to tell me about the order.”
Tobi recalls everything.
He checked the order on his laptop at the coffee shop.
Pennsylvanian ordered snowboard.
Tobi walked home and called Scott. Tobi told Scott their first order.
They loved the order.
How were people made aware about Snowdevil?
2004 was very different.
Tobi and Scott attempted simple website advertising.
Google AdWords was new.
Ad clicks cost 20 cents.
Online snowboard stores were scarce at the time.
Google ads propelled the snowdevil brand.
Snowdevil prospered.
They swiftly recouped their original investment in the snowboard business because to its high profit margin.
Tobi and Scott struggled with inventories.
“Snowboards had really good profit margins…Our biggest problem was keeping inventory and getting it back…We were out of stock all the time.”
Selling snowboards returned their investment and saved them money.
They did not appoint a business manager.
They accomplished everything alone.
Sales dipped in the spring, but something magical happened.
Spring sales plummeted.
They considered stocking different boards.
They naturally wanted to add boards and grow the business.
However, magic occurred.
Tobi coded and improved software while running Snowdevil.
He modified software constantly. He wanted speedier software.
He experimented to make the software more resilient.
Tobi received emails requesting the Snowdevil license.
They intended to create something similar.
“I didn’t stop programming, I was just like Ok now let me try things, let me make it faster and try different approaches…Increasingly I got people sending me emails and asking me If I would like to licence snowdevil to them. People wanted to start something similar.”
Software or skateboards, your choice
Scott and Tobi had to choose a hobby in 2005.
They might sell alternative boards or use software.
The software was a no-brainer from demand.
Daniel Weinand is invited to join Tobi's business.
Tobis German best friend is Daniel.
Tobi and Scott chose to use the software.
Tobi and Scott kept the software service.
Tobi called Daniel to invite him to Canada to collaborate.
Scott and Tobi had quit snowboarding until then.
How was Shopify launched, and whence did the name come from?
The three chose Shopify.
Named from two words.
First:
Shop
Final part:
Simplify
Shopify
Shopify's crew has always had one goal:
creating software that would make it simple and easy for people to launch online storefronts.
Launched Shopify after raising money for the first time.
Shopify began fundraising in 2005.
First, they borrowed from family and friends.
They needed roughly $200k to run the company efficiently.
$200k was a lot then.
When questioned why they require so much money. Tobi told them to trust him with their goals. The team raised seed money from family and friends.
Shopify.com has a landing page. A demo of their goal was on the landing page.
In 2006, Shopify had about 4,000 emails.
Shopify rented an Ottawa office.
“We sent a blast of emails…Some people signed up just to try it out, which was exciting.”
How things developed after Scott left the company
Shopify co-founder Scott Lake left in 2008.
Scott was CEO.
“He(Scott) realized at some point that where the software industry was going, most of the people who were the CEOs were actually the highly technical person on the founding team.”
Scott leaving the company worried Tobi.
Tobis worried about finding a new CEO.
To Tobi:
A great VC will have the network to identify the perfect CEO for your firm.
Tobi started visiting Silicon Valley to meet with venture capitalists to recruit a CEO.
Initially visiting Silicon Valley
Tobi came to Silicon Valley to start a 20-person company.
This company creates eCommerce store software.
Tobi never wanted a big corporation. He desired a fulfilling existence.
“I stayed in a hostel in the Bay Area. I had one roommate who was also a computer programmer. I bought a bicycle on Craiglist. I was there for a week, but ended up staying two and a half weeks.”
Tobi arrived unprepared.
When venture capitalists asked him business questions.
He answered few queries.
Tobi didn't comprehend VC meetings' terminology.
He wrote the terms down and looked them up.
Some were fascinated after he couldn't answer all these queries.
“I ended up getting the kind of term sheets people dream about…All the offers were conditional on moving our company to Silicon Valley.”
Canada received Tobi.
He wanted to consult his team before deciding. Shopify had five employees at the time.
2008.
A global recession greeted Tobi in Canada. The recession hurt the market.
His term sheets were useless.
The economic downturn in the world provided Shopify with a fantastic opportunity.
The global recession caused significant job losses.
Fired employees had several ideas.
They wanted online stores.
Entrepreneurship was desired. They wanted to quit work.
People took risks and tried new things during the global slump.
Shopify subscribers skyrocketed during the recession.
“In 2009, the company reached neutral cash flow for the first time…We were in a position to think about long-term investments, such as infrastructure projects.”
Then, Tobi Lutke became CEO.
How did Tobi perform as the company's CEO?
“I wasn’t good. My team was very patient with me, but I had a lot to learn…It’s a very subtle job.”
2009–2010.
Tobi limited the company's potential.
He deliberately restrained company growth.
Tobi had one costly problem:
Whether Shopify is a venture or a lifestyle business.
The company's annual revenue approached $1 million.
Tobi battled with the firm and himself despite good revenue.
His wife was supportive, but the responsibility was crushing him.
“It’s a crushing responsibility…People had families and kids…I just couldn’t believe what was going on…My father-in-law gave me money to cover the payroll and it was his life-saving.”
Throughout this trip, everyone supported Tobi.
They believed it.
$7 million in donations received
Tobi couldn't decide if this was a lifestyle or a business.
Shopify struggled with marketing then.
Later, Tobi tried 5 marketing methods.
He told himself that if any marketing method greatly increased their growth, he would call it a venture, otherwise a lifestyle.
The Shopify crew brainstormed and voted on marketing concepts.
Tested.
“Every single idea worked…We did Adwords, published a book on the concept, sponsored a podcast and all the ones we tracked worked.”
To Silicon Valley once more
Shopify marketing concepts worked once.
Tobi returned to Silicon Valley to pitch investors.
He raised $7 million, valuing Shopify at $25 million.
All investors had board seats.
“I find it very helpful…I always had a fantastic relationship with everyone who’s invested in my company…I told them straight that I am not going to pretend I know things, I want you to help me.”
Tobi developed skills via running Shopify.
Shopify had 20 employees.
Leaving his wife's parents' home
Tobi left his wife's parents in 2014.
Tobi had a child.
Shopify has 80,000 customers and 300 staff in 2013.
Public offering in 2015
Shopify investors went public in 2015.
Shopify powers 4.1 million e-Commerce sites.
Shopify stores are 65% US-based.
It is currently valued at $48 billion.
You might also like

Simon Egersand
3 years ago
Working from home for more than two years has taught me a lot.
Since the pandemic, I've worked from home. It’s been +2 years (wow, time flies!) now, and during this time I’ve learned a lot. My 4 remote work lessons.
I work in a remote distributed team. This team setting shaped my experience and teachings.
Isolation ("I miss my coworkers")
The most obvious point. I miss going out with my coworkers for coffee, weekend chats, or just company while I work. I miss being able to go to someone's desk and ask for help. On a remote world, I must organize a meeting, share my screen, and avoid talking over each other in Zoom - sigh!
Social interaction is more vital for my health than I believed.
Online socializing stinks
My company used to come together every Friday to play Exploding Kittens, have food and beer, and bond over non-work things.
Different today. Every Friday afternoon is for fun, but it's not the same. People with screen weariness miss meetings, which makes sense. Sometimes you're too busy on Slack to enjoy yourself.
We laugh in meetings, but it's not the same as face-to-face.
Digital social activities can't replace real-world ones
Improved Work-Life Balance, if You Let It
At the outset of the pandemic, I recognized I needed to take better care of myself to survive. After not leaving my apartment for a few days and feeling miserable, I decided to walk before work every day. This turned into a passion for exercise, and today I run or go to the gym before work. I use my commute time for healthful activities.
Working from home makes it easier to keep working after hours. I sometimes forget the time and find myself writing coding at dinnertime. I said, "One more test." This is a disadvantage, therefore I keep my office schedule.
Spend your commute time properly and keep to your office schedule.
Remote Pair Programming Is Hard
As a software developer, I regularly write code. My team sometimes uses pair programming to write code collaboratively. One person writes code while another watches, comments, and asks questions. I won't list them all here.
Internet pairing is difficult. My team struggles with this. Even with Tuple, it's challenging. I lose attention when I get a notification or check my computer.
I miss a pen and paper to rapidly sketch down my thoughts for a colleague or a whiteboard for spirited talks with others. Best answers are found through experience.
Real-life pair programming beats the best remote pair programming tools.
Lessons Learned
Here are 4 lessons I've learned working remotely for 2 years.
-
Socializing is more vital to my health than I anticipated.
-
Digital social activities can't replace in-person ones.
-
Spend your commute time properly and keep your office schedule.
-
Real-life pair programming beats the best remote tools.
Conclusion
Our era is fascinating. Remote labor has existed for years, but software companies have just recently had to adapt. Companies who don't offer remote work will lose talent, in my opinion.
We're still figuring out the finest software development approaches, programming language features, and communication methods since the 1960s. I can't wait to see what advancements assist us go into remote work.
I'll certainly work remotely in the next years, so I'm interested to see what I've learnt from this post then.
This post is a summary of this one.

Alexander Nguyen
3 years ago
How can you bargain for $300,000 at Google?
Don’t give a number

Google pays its software engineers generously. While many of their employees are competent, they disregard a critical skill to maximize their pay.
Negotiation.
If Google employees have never negotiated, they're as helpless as anyone else.
In this piece, I'll reveal a compensation negotiation tip that will set you apart.
The Fallacy of Negotiating
How do you negotiate your salary? “Just give them a number twice the amount you really want”. - Someplace on the internet
Above is typical negotiation advice. If you ask for more than you want, the recruiter may meet you halfway.
It seems logical and great, but here's why you shouldn't follow that advice.
Haitian hostage rescue
In 1977, an official's aunt was kidnapped in Haiti. The kidnappers demanded $150,000 for the aunt's life. It seems reasonable until you realize why kidnappers want $150,000.
FBI detective and negotiator Chris Voss researched why they demanded so much.
“So they could party through the weekend”
When he realized their ransom was for partying, he offered $4,751 and a CD stereo. Criminals freed the aunt.
These thieves gave 31.57x their estimated amount and got a fraction. You shouldn't trust these thieves to negotiate your compensation.
What happened?
Negotiating your offer and Haiti
This narrative teaches you how to negotiate with a large number.
You can and will be talked down.
If a recruiter asks your wage expectation and you offer double, be ready to explain why.
If you can't justify your request, you may be offered less. The recruiter will notice and talk you down.
Reasonably,
a tiny bit more than the present amount you earn
a small premium over an alternative offer
a little less than the role's allotted amount
Real-World Illustration

Recruiter: What’s your expected salary? Candidate: (I know the role is usually $100,000) $200,000 Recruiter: How much are you compensated in your current role? Candidate: $90,000 Recruiter: We’d be excited to offer you $95,000 for your experiences for the role.
So Why Do They Even Ask?
Recruiters ask for a number to negotiate a lower one. Asking yourself limits you.
You'll rarely get more than you asked for, and your request can be lowered.
The takeaway from all of this is to never give an expected compensation.
Tell them you haven't thought about it when you applied.

Sam Hickmann
3 years ago
Token taxonomy: Utility vs Security vs NFT
Let's examine the differences between the three main token types and their functions.
As Ethereum grew, the term "token" became a catch-all term for all assets built on the Ethereum blockchain. However, different tokens were grouped based on their applications and features, causing some confusion. Let's examine the modification of three main token types: security, utility, and non-fungible.
Utility tokens
They provide a specific utility benefit (or a number of such). A utility token is similar to a casino chip, a table game ticket, or a voucher. Depending on the terms of issuing, they can be earned and used in various ways. A utility token is a type of token that represents a tool or mechanism required to use the application in question. Like a service, a utility token's price is determined by supply and demand. Tokens can also be used as a bonus or reward mechanism in decentralized systems: for example, if you like someone's work, give them an upvote and they get a certain number of tokens. This is a way for authors or creators to earn money indirectly.
The most common way to use a utility token is to pay with them instead of cash for discounted goods or services.
Utility tokens are the most widely used by blockchain companies. Most cryptocurrency exchanges accept fees in native utility tokens.
Utility tokens can also be used as a reward. Companies tokenize their loyalty programs so that points can be bought and sold on blockchain exchanges. These tokens are widely used in decentralized companies as a bonus system. You can use utility tokens to reward creators for their contributions to a platform, for example. It also allows members to exchange tokens for specific bonuses and rewards on your site.
Unlike security tokens, which are subject to legal restrictions, utility tokens can be freely traded.
Security tokens
Security tokens are essentially traditional securities like shares, bonds, and investment fund units in a crypto token form.
The key distinction is that security tokens are typically issued by private firms (rather than public companies) that are not listed on stock exchanges and in which you can not invest right now. Banks and large venture funds used to be the only sources of funding. A person could only invest in private firms if they had millions of dollars in their bank account. Privately issued security tokens outperform traditional public stocks in terms of yield. Private markets grew 50% faster than public markets over the last decade, according to McKinsey Private Equity Research.
A security token is a crypto token whose value is derived from an external asset or company. So it is governed as security (read about the Howey test further in this article). That is, an ownership token derives its value from the company's valuation, assets on the balance sheet, or dividends paid to token holders.
Why are Security Tokens Important?
Cryptocurrency is a lucrative investment. Choosing from thousands of crypto assets can mean the difference between millionaire and bankrupt. Without security tokens, crypto investing becomes riskier and generating long-term profits becomes difficult. These tokens have lower risk than other cryptocurrencies because they are backed by real assets or business cash flows. So having them helps to diversify a portfolio and preserve the return on investment in riskier assets.
Security tokens open up new funding avenues for businesses. As a result, investors can invest in high-profit businesses that are not listed on the stock exchange.
The distinction between utility and security tokens isn't as clear as it seems. However, this increases the risk for token issuers, especially in the USA. The Howey test is the main pillar regulating judicial precedent in this area.
What is a Howey Test?
An "investment contract" is determined by the Howey Test, a lawsuit settled by the US Supreme Court. If it does, it's a security and must be disclosed and registered under the Securities Act of 1933 and the Securities Exchange Act of 1934.
If the SEC decides that a cryptocurrency token is a security, a slew of issues arise. In practice, this ensures that the SEC will decide when a token can be offered to US investors and if the project is required to file a registration statement with the SEC.
Due to the Howey test's extensive wording, most utility tokens will be classified as securities, even if not intended to be. Because of these restrictions, most ICOs are not available to US investors. When asked about ICOs in 2018, then-SEC Chairman Jay Clayton said they were securities. The given statement adds to the risk. If a company issues utility tokens without registering them as securities, the regulator may impose huge fines or even criminal charges.
What other documents regulate tokens?
Securities Act (1993) or Securities Exchange Act (1934) in the USA; MiFID directive and Prospectus Regulation in the EU. These laws require registering the placement of security tokens, limiting their transfer, but protecting investors.
Utility tokens have much less regulation. The Howey test determines whether a given utility token is a security. Tokens recognized as securities are now regulated as such. Having a legal opinion that your token isn't makes the implementation process much easier. Most countries don't have strict regulations regarding utility tokens except KYC (Know Your Client) and AML (Anti Money-Laundering).
As cryptocurrency and blockchain technologies evolve, more countries create UT regulations. If your company is based in the US, be aware of the Howey test and the Bank Secrecy Act. It classifies UTs and their issuance as money transmission services in most states, necessitating a license and strict regulations. Due to high regulatory demands, UT issuers try to avoid the United States as a whole. A new law separating utility tokens from bank secrecy act will be introduced in the near future, giving hope to American issuers.
The rest of the world has much simpler rules requiring issuers to create basic investor disclosures. For example, the latest European legislation (MiCA) allows businesses to issue utility tokens without regulator approval. They must also prepare a paper with all the necessary information for the investors.
A payment token is a utility token that is used to make a payment. They may be subject to electronic money laws.
Because non-fungible tokens are a new instrument, there is no regulating paper yet. However, if the NFT is fractionalized, the smaller tokens acquired may be seen as securities.
NFT Tokens
Collectible tokens are also known as non-fungible tokens. Their distinctive feature is that they denote unique items such as artwork, merch, or ranks. Unlike utility tokens, which are fungible, meaning that two of the same tokens are identical, NFTs represent a unit of possession that is strictly one of a kind. In a way, NFTs are like baseball cards, each one unique and valuable.
As for today, the most recognizable NFT function is to preserve the fact of possession. Owning an NFT with a particular gif, meme, or sketch does not transfer the intellectual right to the possessor, but is analogous to owning an original painting signed by the author.
Collectible tokens can also be used as digital souvenirs, so to say. Businesses can improve their brand image by issuing their own branded NFTs, which represent ranks or achievements within the corporate ecosystem. Gamifying business ecosystems would allow people to connect with a brand and feel part of a community.
Which type of tokens is right for you as a business to raise capital?
For most businesses, it's best to raise capital with security tokens by selling existing shares to global investors. Utility tokens aren't meant to increase in value over time, so leave them for gamification and community engagement. In a blockchain-based business, however, a utility token is often the lifeblood of the operation, and its appreciation potential is directly linked to the company's growth. You can issue multiple tokens at once, rather than just one type. It exposes you to various investors and maximizes the use of digital assets.
Which tokens should I buy?
There are no universally best tokens. Their volatility, industry, and risk-reward profile vary. This means evaluating tokens in relation to your overall portfolio and personal preferences: what industries do you understand best, what excites you, how do you approach taxes, and what is your planning horizon? To build a balanced portfolio, you need to know these factors.
Conclusion
The three most common types of tokens today are security, utility, and NFT. Security tokens represent stocks, mutual funds, and bonds. Utility tokens can be perceived as an inside-product "currency" or "ignition key" that grants you access to goods and services or empowers with other perks. NFTs are unique collectible units that identify you as the owner of something.