


A Warm Welcome to Web3 and the Future of the Internet
Let's take a look back at the internet's history and see where we're going — and why.
Tim Berners Lee had a problem. He was at CERN, the world's largest particle physics factory, at the time. The institute's stated goal was to study the simplest particles with the most sophisticated scientific instruments. The institute completed the LEP Tunnel in 1988, a 27 kilometer ring. This was Europe's largest civil engineering project (to study smaller particles — electrons).
The problem Tim Berners Lee found was information loss, not particle physics. CERN employed a thousand people in 1989. Due to team size and complexity, people often struggled to recall past project information. While these obstacles could be overcome, high turnover was nearly impossible. Berners Lee addressed the issue in a proposal titled ‘Information Management'.
When a typical stay is two years, data is constantly lost. The introduction of new people takes a lot of time from them and others before they understand what is going on. An emergency situation may require a detective investigation to recover technical details of past projects. Often, the data is recorded but cannot be found. — Information Management: A Proposal
He had an idea. Create an information management system that allowed users to access data in a decentralized manner using a new technology called ‘hypertext'.
To quote Berners Lee, his proposal was “vague but exciting...”. The paper eventually evolved into the internet we know today. Here are three popular W3C standards used by billions of people today:
(credit: CERN)
HTML (Hypertext Markup)
A web formatting language.
URI (Unique Resource Identifier)
Each web resource has its own “address”. Known as ‘a URL'.
HTTP (Hypertext Transfer Protocol)
Retrieves linked resources from across the web.
These technologies underpin all computer work. They were the seeds of our quest to reorganize information, a task as fruitful as particle physics.
Tim Berners-Lee would probably think the three decades from 1989 to 2018 were eventful. He'd be amazed by the billions, the inspiring, the novel. Unlocking innovation at CERN through ‘Information Management'.
The fictional character would probably need a drink, walk, and a few deep breaths to fully grasp the internet's impact. He'd be surprised to see a few big names in the mix.
Then he'd say, "Something's wrong here."
We should review the web's history before going there. Was it a success after Berners Lee made it public? Web1 and Web2: What is it about what we are doing now that so many believe we need a new one, web3?
Per Outlier Ventures' Jamie Burke:
Web 1.0 was read-only.
Web 2.0 was the writable
Web 3.0 is a direct-write web.
Let's explore.
Web1: The Read-Only Web
Web1 was the digital age. We put our books, research, and lives ‘online'. The web made information retrieval easier than any filing cabinet ever. Massive amounts of data were stored online. Encyclopedias, medical records, and entire libraries were put away into floppy disks and hard drives.
In 2015, the web had around 305,500,000,000 pages of content (280 million copies of Atlas Shrugged).
Initially, one didn't expect to contribute much to this database. Web1 was an online version of the real world, but not yet a new way of using the invention.
One gets the impression that the web has been underutilized by historians if all we can say about it is that it has become a giant global fax machine. — Daniel Cohen, The Web's Second Decade (2004)
That doesn't mean developers weren't building. The web was being advanced by great minds. Web2 was born as technology advanced.
Web2: Read-Write Web
Remember when you clicked something on a website and the whole page refreshed? Is it too early to call the mid-2000s ‘the good old days'?
Browsers improved gradually, then suddenly. AJAX calls augmented CGI scripts, and applications began sending data back and forth without disrupting the entire web page. One button to ‘digg' a post (see below). Web experiences blossomed.
In 2006, Digg was the most active ‘Web 2.0' site. (Photo: Ethereum Foundation Taylor Gerring)
Interaction was the focus of new applications. Posting, upvoting, hearting, pinning, tweeting, liking, commenting, and clapping became a lexicon of their own. It exploded in 2004. Easy ways to ‘write' on the internet grew, and continue to grow.
Facebook became a Web2 icon, where users created trillions of rows of data. Google and Amazon moved from Web1 to Web2 by better understanding users and building products and services that met their needs.
Business models based on Software-as-a-Service and then managing consumer data within them for a fee have exploded.
Web2 Emerging Issues
Unbelievably, an intriguing dilemma arose. When creating this read-write web, a non-trivial question skirted underneath the covers. Who owns it all?
You have no control over [Web 2] online SaaS. People didn't realize this because SaaS was so new. People have realized this is the real issue in recent years.
Even if these organizations have good intentions, their incentive is not on the users' side.
“You are not their customer, therefore you are their product,” they say. With Laura Shin, Vitalik Buterin, Unchained
A good plot line emerges. Many amazing, world-changing software products quietly lost users' data control.
For example: Facebook owns much of your social graph data. Even if you hate Facebook, you can't leave without giving up that data. There is no ‘export' or ‘exit'. The platform owns ownership.
While many companies can pull data on you, you cannot do so.
On the surface, this isn't an issue. These companies use my data better than I do! A complex group of stakeholders, each with their own goals. One is maximizing shareholder value for public companies. Tim Berners-Lee (and others) dislike the incentives created.
“Show me the incentive and I will show you the outcome.” — Berkshire Hathaway's CEO
It's easy to see what the read-write web has allowed in retrospect. We've been given the keys to create content instead of just consume it. On Facebook and Twitter, anyone with a laptop and internet can participate. But the engagement isn't ours. Platforms own themselves.
Web3: The ‘Unmediated’ Read-Write Web
Tim Berners Lee proposed a decade ago that ‘linked data' could solve the internet's data problem.
However, until recently, the same principles that allowed the Web of documents to thrive were not applied to data...
The Web of Data also allows for new domain-specific applications. Unlike Web 2.0 mashups, Linked Data applications work with an unbound global data space. As new data sources appear on the Web, they can provide more complete answers.
At around the same time as linked data research began, Satoshi Nakamoto created Bitcoin. After ten years, it appears that Berners Lee's ideas ‘link' spiritually with cryptocurrencies.
What should Web 3 do?
Here are some quick predictions for the web's future.
Users' data:
Users own information and provide it to corporations, businesses, or services that will benefit them.
Defying censorship:
No government, company, or institution should control your access to information (1, 2, 3)
Connect users and platforms:
Create symbiotic rather than competitive relationships between users and platform creators.
Open networks:
“First, the cryptonetwork-participant contract is enforced in open source code. Their voices and exits are used to keep them in check.” Dixon, Chris (4)
Global interactivity:
Transacting value, information, or assets with anyone with internet access, anywhere, at low cost
Self-determination:
Giving you the ability to own, see, and understand your entire digital identity.
Not pull, push:
‘Push' your data to trusted sources instead of ‘pulling' it from others.
Where Does This Leave Us?
Change incentives, change the world. Nick Babalola
People believe web3 can help build a better, fairer system. This is not the same as equal pay or outcomes, but more equal opportunity.
It should be noted that some of these advantages have been discussed previously. Will the changes work? Will they make a difference? These unanswered questions are technical, economic, political, and philosophical. Unintended consequences are likely.
We hope Web3 is a more democratic web. And we think incentives help the user. If there’s one thing that’s on our side, it’s that open has always beaten closed, given a long enough timescale.
We are at the start.
More on Web3 & Crypto

Alex Bentley
3 years ago
Why Bill Gates thinks Bitcoin, crypto, and NFTs are foolish
Microsoft co-founder Bill Gates assesses digital assets while the bull is caged.

Bill Gates is well-respected.
Reasonably. He co-founded and led Microsoft during its 1980s and 1990s revolution.
After leaving Microsoft, Bill Gates pursued other interests. He and his wife founded one of the world's largest philanthropic organizations, Bill & Melinda Gates Foundation. He also supports immunizations, population control, and other global health programs.
When Gates criticized Bitcoin, cryptocurrencies, and NFTs, it made news.
Bill Gates said at the 58th Munich Security Conference...
“You have an asset class that’s 100% based on some sort of greater fool theory that somebody’s going to pay more for it than I do.”
Gates means digital assets. Like many bitcoin critics, he says digital coins and tokens are speculative.
And he's not alone. Financial experts have dubbed Bitcoin and other digital assets a "bubble" for a decade.
Gates also made fun of Bored Ape Yacht Club and NFTs, saying, "Obviously pricey digital photographs of monkeys will help the world."
Why does Bill Gates dislike digital assets?
According to Gates' latest comments, Bitcoin, cryptos, and NFTs aren't good ways to hold value.
Bill Gates is a better investor than Elon Musk.
“I’m used to asset classes, like a farm where they have output, or like a company where they make products,” Gates said.
The Guardian claimed in April 2021 that Bill and Melinda Gates owned the most U.S. farms. Over 242,000 acres of farmland.
The Gates couple has enough farmland to cover Hong Kong.

Bill Gates is a classic investor. He wants companies with an excellent track record, strong fundamentals, and good management. Or tangible assets like land and property.
Gates prefers the "old economy" over the "new economy"
Gates' criticism of Bitcoin and cryptocurrency ventures isn't surprising. These digital assets lack all of Gates's investing criteria.
Volatile digital assets include Bitcoin. Their costs might change dramatically in a day. Volatility scares risk-averse investors like Gates.
Gates has a stake in the old financial system. As Microsoft's co-founder, Gates helped develop a dominant tech company.
Because of his business, he's one of the world's richest men.
Bill Gates is invested in protecting the current paradigm.
He won't invest in anything that could destroy the global economy.
When Gates criticizes Bitcoin, cryptocurrencies, and NFTs, he's suggesting they're a hoax. These soapbox speeches are one way he protects his interests.
Digital assets aren't a bad investment, though. Many think they're the future.
Changpeng Zhao and Brian Armstrong are two digital asset billionaires. Two crypto exchange CEOs. Binance/Coinbase.
Digital asset revolution won't end soon.
If you disagree with Bill Gates and plan to invest in Bitcoin, cryptocurrencies, or NFTs, do your own research and understand the risks.
But don’t take Bill Gates’ word for it.
He’s just an old rich guy with a lot of farmland.
He has a lot to lose if Bitcoin and other digital assets gain global popularity.
This post is a summary. Read the full article here.

CyberPunkMetalHead
3 years ago
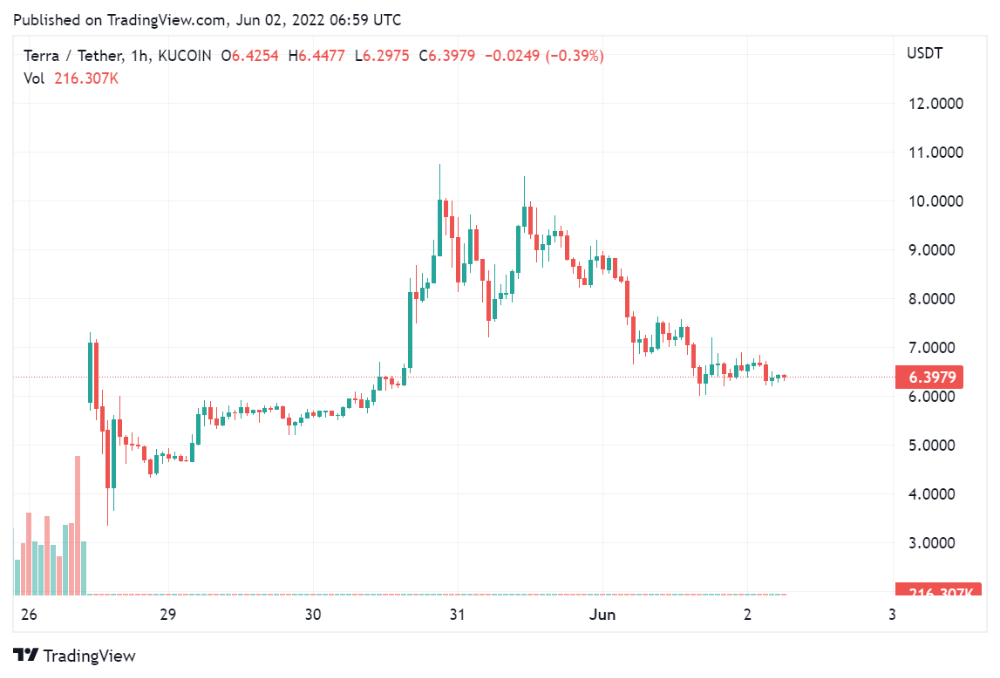
It's all about the ego with Terra 2.0.
UST depegs and LUNA crashes 99.999% in a fraction of the time it takes the Moon to orbit the Earth.
Fat Man, a Terra whistle-blower, promises to expose Do Kwon's dirty secrets and shady deals.
The Terra community has voted to relaunch Terra LUNA on a new blockchain. The Terra 2.0 Pheonix-1 blockchain went live on May 28, 2022, and people were airdropped the new LUNA, now called LUNA, while the old LUNA became LUNA Classic.
Does LUNA deserve another chance? To answer this, or at least start a conversation about the Terra 2.0 chain's advantages and limitations, we must assess its fundamentals, ideology, and long-term vision.
Whatever the result, our analysis must be thorough and ruthless. A failure of this magnitude cannot happen again, so we must magnify every potential breaking point by 10.
Will UST and LUNA holders be compensated in full?
The obvious. First, and arguably most important, is to restore previous UST and LUNA holders' bags.
Terra 2.0 has 1,000,000,000,000 tokens to distribute.
25% of a community pool
Holders of pre-attack LUNA: 35%
10% of aUST holders prior to attack
Holders of LUNA after an attack: 10%
UST holders as of the attack: 20%
Every LUNA and UST holder has been compensated according to the above proposal.
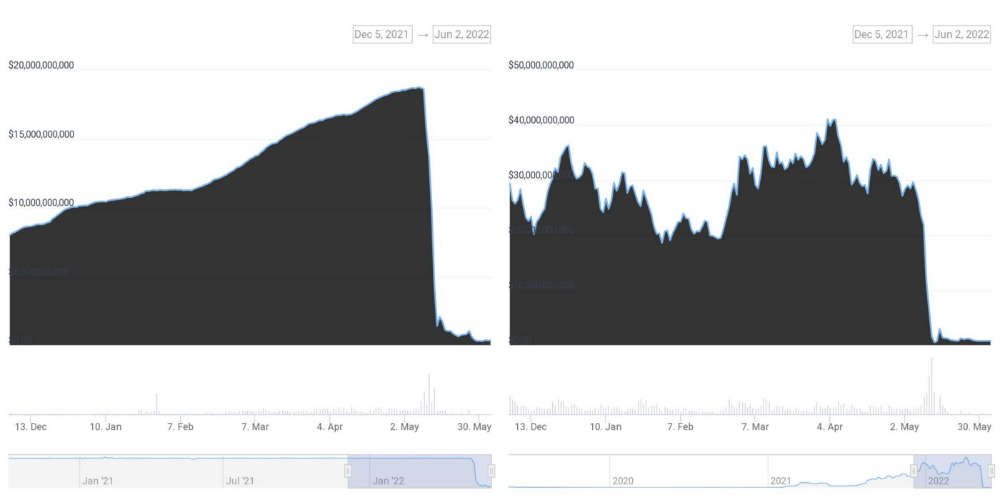
According to self-reported data, the new chain has 210.000.000 tokens and a $1.3bn marketcap. LUNC and UST alone lost $40bn. The new token must fill this gap. Since launch:
LUNA holders collectively own $1b worth of LUNA if we subtract the 25% community pool airdrop from the current market cap and assume airdropped LUNA was never sold.
At the current supply, the chain must grow 40 times to compensate holders. At the current supply, LUNA must reach $240.
LUNA needs a full-on Bull Market to make LUNC and UST holders whole.
Who knows if you'll be whole? From the time you bought to the amount and price, there are too many variables to determine if Terra can cover individual losses.
The above distribution doesn't consider individual cases. Terra didn't solve individual cases. It would have been huge.
What does LUNA offer in terms of value?
UST's marketcap peaked at $18bn, while LUNC's was $41bn. LUNC and UST drove the Terra chain's value.
After it was confirmed (again) that algorithmic stablecoins are bad, Terra 2.0 will no longer support them.
Algorithmic stablecoins contributed greatly to Terra's growth and value proposition. Terra 2.0 has no product without algorithmic stablecoins.
Terra 2.0 has an identity crisis because it has no actual product. It's like Volkswagen faking carbon emission results and then stopping car production.
A project that has already lost the trust of its users and nearly all of its value cannot survive without a clear and in-demand use case.
Do Kwon, how about him?
Oh, the Twitter-caller-poor? Who challenges crypto billionaires to break his LUNA chain? Who dissolved Terra Labs South Korea before depeg? Arrogant guy?
That's not a good image for LUNA, especially when making amends. I think he should step down and let a nicer person be Terra 2.0's frontman.
The verdict
Terra has a terrific community with an arrogant, unlikeable leader. The new LUNA chain must grow 40 times before it can start making up its losses, and even then, not everyone's losses will be covered.
I won't invest in Terra 2.0 or other algorithmic stablecoins in the near future. I won't be near any Do Kwon-related project within 100 miles. My opinion.
Can Terra 2.0 be saved? Comment below.
Langston Thomas
3 years ago
A Simple Guide to NFT Blockchains
Ethereum's blockchain rules NFTs. Many consider it the one-stop shop for NFTs, and it's become the most talked-about and trafficked blockchain in existence.
Other blockchains are becoming popular in NFTs. Crypto-artists and NFT enthusiasts have sought new places to mint and trade NFTs due to Ethereum's high transaction costs and environmental impact.
When choosing a blockchain to mint on, there are several factors to consider. Size, creator costs, consumer spending habits, security, and community input are important. We've created a high-level summary of blockchains for NFTs to help clarify the fast-paced world of web3 tech.
Ethereum
Ethereum currently has the most NFTs. It's decentralized and provides financial and legal services without intermediaries. It houses popular NFT marketplaces (OpenSea), projects (CryptoPunks and the Bored Ape Yacht Club), and artists (Pak and Beeple).
It's also expensive and energy-intensive. This is because Ethereum works using a Proof-of-Work (PoW) mechanism. PoW requires computers to solve puzzles to add blocks and transactions to the blockchain. Solving these puzzles requires a lot of computer power, resulting in astronomical energy loss.
You should consider this blockchain first due to its popularity, security, decentralization, and ease of use.
Solana
Solana is a fast programmable blockchain. Its proof-of-history and proof-of-stake (PoS) consensus mechanisms eliminate complex puzzles. Reduced validation times and fees result.
PoS users stake their cryptocurrency to become a block validator. Validators get SOL. This encourages and rewards users to become stakers. PoH works with PoS to cryptographically verify time between events. Solana blockchain ensures transactions are in order and found by the correct leader (validator).
Solana's PoS and PoH mechanisms keep transaction fees and times low. Solana isn't as popular as Ethereum, so there are fewer NFT marketplaces and blockchain traders.
Tezos
Tezos is a greener blockchain. Tezos rose in 2021. Hic et Nunc was hailed as an economic alternative to Ethereum-centric marketplaces until Nov. 14, 2021.
Similar to Solana, Tezos uses a PoS consensus mechanism and only a PoS mechanism to reduce computational work. This blockchain uses two million times less energy than Ethereum. It's cheaper than Ethereum (but does cost more than Solana).
Tezos is a good place to start minting NFTs in bulk. Objkt is the largest Tezos marketplace.
Flow
Flow is a high-performance blockchain for NFTs, games, and decentralized apps (dApps). Flow is built with scalability in mind, so billions of people could interact with NFTs on the blockchain.
Flow became the NBA's blockchain partner in 2019. Flow, a product of Dapper labs (the team behind CryptoKitties), launched and hosts NBA Top Shot, making the blockchain integral to the popularity of non-fungible tokens.
Flow uses PoS to verify transactions, like Tezos. Developers are working on a model to handle 10,000 transactions per second on the blockchain. Low transaction fees.
Flow NFTs are tradeable on Blocktobay, OpenSea, Rarible, Foundation, and other platforms. NBA, NFL, UFC, and others have launched NFT marketplaces on Flow. Flow isn't as popular as Ethereum, resulting in fewer NFT marketplaces and blockchain traders.
Asset Exchange (WAX)
WAX is king of virtual collectibles. WAX is popular for digitalized versions of legacy collectibles like trading cards, figurines, memorabilia, etc.
Wax uses a PoS mechanism, but also creates carbon offset NFTs and partners with Climate Care. Like Flow, WAX transaction fees are low, and network fees are redistributed to the WAX community as an incentive to collectors.
WAX marketplaces host Topps, NASCAR, Hot Wheels, and cult classic film franchises like Godzilla, The Princess Bride, and Spiderman.
Binance Smart Chain
BSC is another good option for balancing fees and performance. High-speed transactions and low fees hurt decentralization. BSC is most centralized.
Binance Smart Chain uses Proof of Staked Authority (PoSA) to support a short block time and low fees. The 21 validators needed to run the exchange switch every 24 hours. 11 of the 21 validators are directly connected to the Binance Crypto Exchange, according to reports.
While many in the crypto and NFT ecosystems dislike centralization, the BSC NFT market picked up speed in 2021. OpenBiSea, AirNFTs, JuggerWorld, and others are gaining popularity despite not having as robust an ecosystem as Ethereum.
You might also like

Chris Moyse
4 years ago
Sony and LEGO raise $2 billion for Epic Games' metaverse
‘Kid-friendly’ project holds $32 billion valuation
Epic Games announced today that it has raised $2 billion USD from Sony Group Corporation and KIRKBI (holding company of The LEGO Group). Both companies contributed $1 billion to Epic Games' upcoming ‘metaverse' project.
“We need partners who share our vision as we reimagine entertainment and play. Our partnership with Sony and KIRKBI has found this,” said Epic Games CEO Tim Sweeney. A new metaverse will be built where players can have fun with friends and brands create creative and immersive experiences, as well as creators thrive.
Last week, LEGO and Epic Games announced their plans to create a family-friendly metaverse where kids can play, interact, and create in digital environments. The service's users' safety and security will be prioritized.
With this new round of funding, Epic Games' project is now valued at $32 billion.
“Epic Games is known for empowering creators large and small,” said KIRKBI CEO Sren Thorup Srensen. “We invest in trends that we believe will impact the world we and our children will live in. We are pleased to invest in Epic Games to support their continued growth journey, with a long-term focus on the future metaverse.”
Epic Games is expected to unveil its metaverse plans later this year, including its name, details, services, and release date.

Jon Brosio
3 years ago
You can learn more about marketing from these 8 copywriting frameworks than from a college education.
Email, landing pages, and digital content

Today's most significant skill:
Copywriting.
Unfortunately, most people don't know how to write successful copy because they weren't taught in school.
I've been obsessed with copywriting for two years. I've read 15 books, completed 3 courses, and studied internet's best digital entrepreneurs.
Here are 8 copywriting frameworks that educate more than a four-year degree.
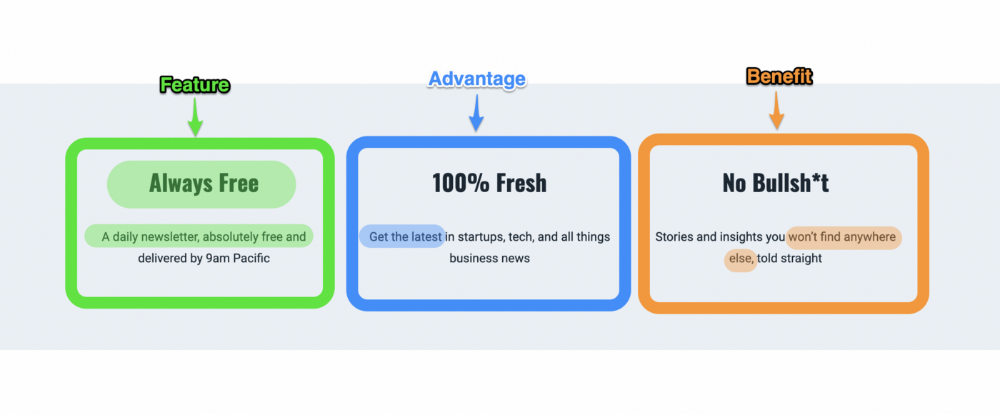
1. Feature — Advantage — Benefit (F.A.B)
This is the most basic copywriting foundation. Email marketing, landing page copy, and digital video ads can use it.
F.A.B says:
How it works (feature)
which is helpful (advantage)
What's at stake (benefit)
The Hustle uses this framework on their landing page to convince people to sign up:
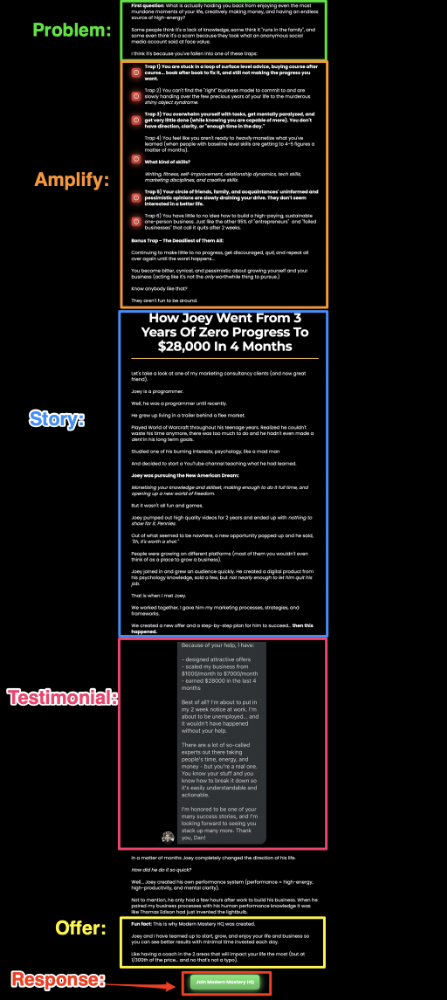
2. P. A. S. T. O. R.
This framework is for longer-form copywriting. PASTOR uses stories to engage with prospects. It explains why people should buy this offer.
PASTOR means:
Problem
Amplify
Story
Testimonial
Offer
Response
Dan Koe's landing page is a great example. It shows PASTOR frame-by-frame.
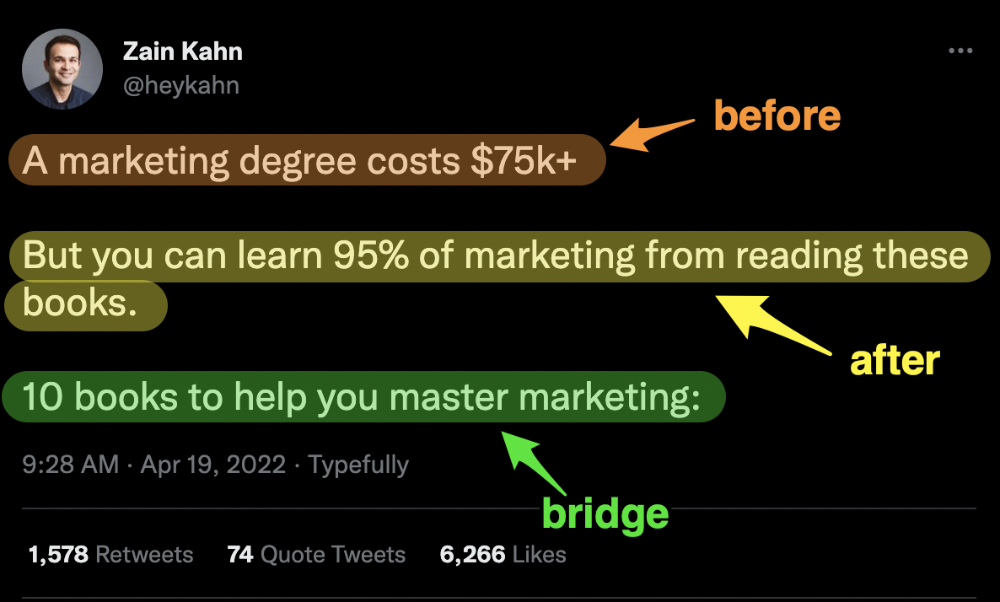
3. Before — After — Bridge
Before-after-bridge is a copywriting framework that draws attention and shows value quickly.
This framework highlights:
where you are
where you want to be
how to get there
Works great for: Email threads/landing pages
Zain Kahn utilizes this framework to write viral threads.
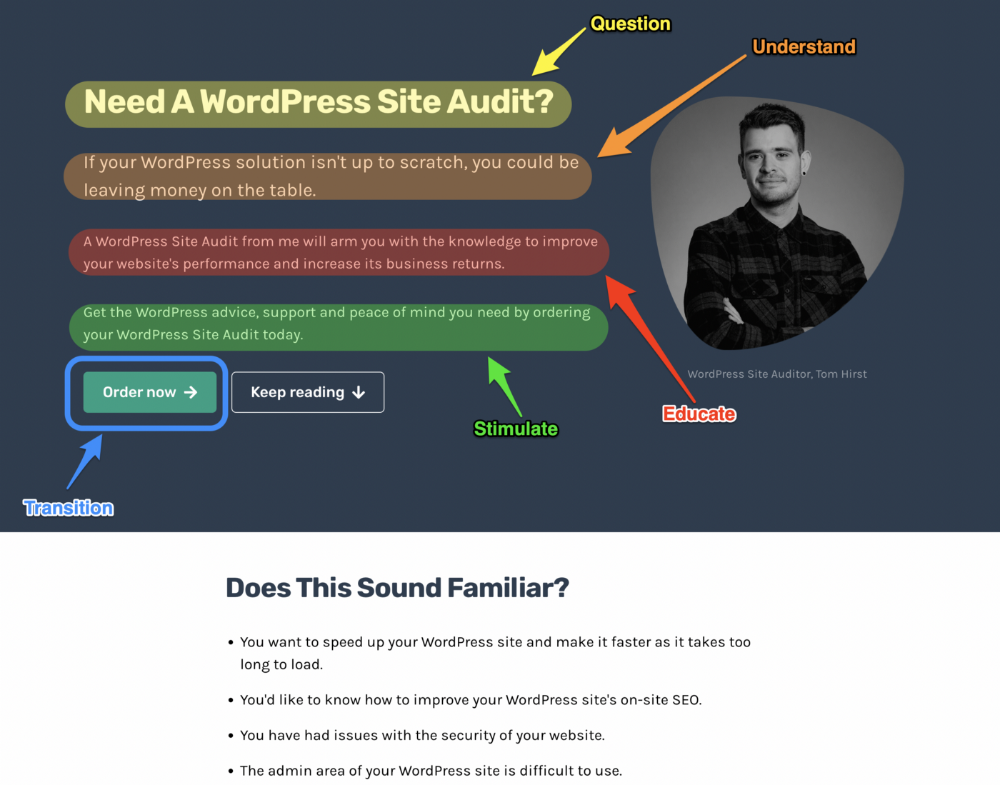
4. Q.U.E.S.T
QUEST is about empathetic writing. You know their issues, obstacles, and headaches. This allows coverups.
QUEST:
Qualifies
Understands
Educates
Stimulates
Transitions
Tom Hirst's landing page uses the QUEST framework.
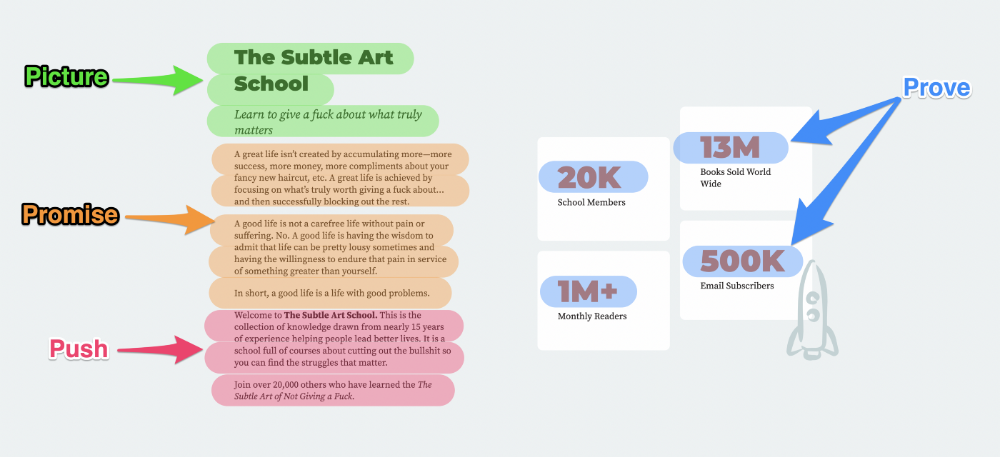
5. The 4P’s model
The 4P’s approach pushes your prospect to action. It educates and persuades quickly.
4Ps:
The problem the visitor is dealing with
The promise that will help them
The proof the promise works
A push towards action
Mark Manson is a bestselling author, digital creator, and pop-philosopher. He's also a great copywriter, and his membership offer uses the 4P’s framework.
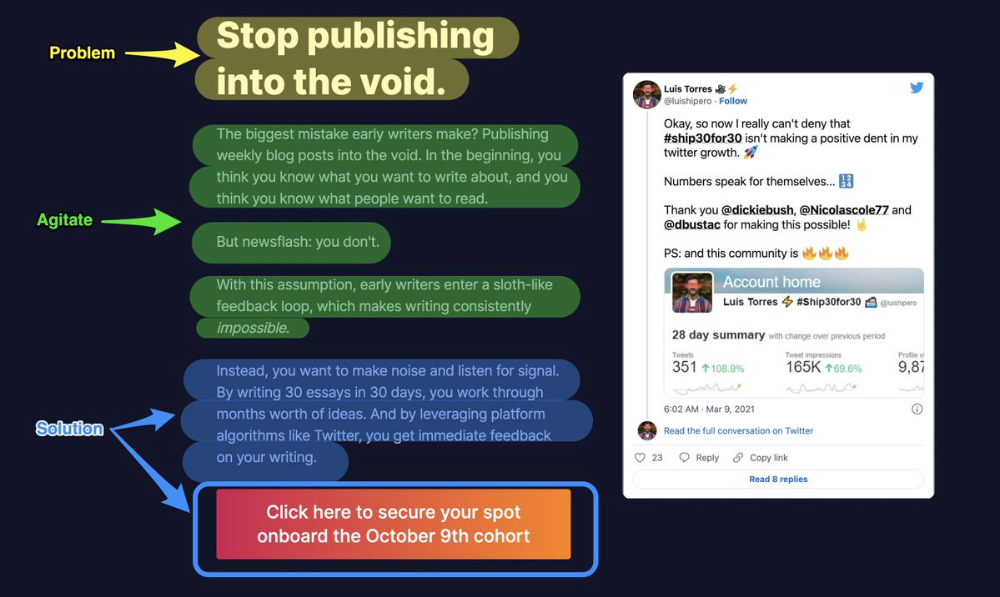
6. Problem — Agitate — Solution (P.A.S)
Up-and-coming marketers should understand problem-agitate-solution copywriting. Once you understand one structure, others are easier. It drives passion and presents a clear solution.
PAS outlines:
The issue the visitor is having
It then intensifies this issue through emotion.
finally offers an answer to that issue (the offer)
The customer's story loops. Nicolas Cole and Dickie Bush use PAS to promote Ship 30 for 30.
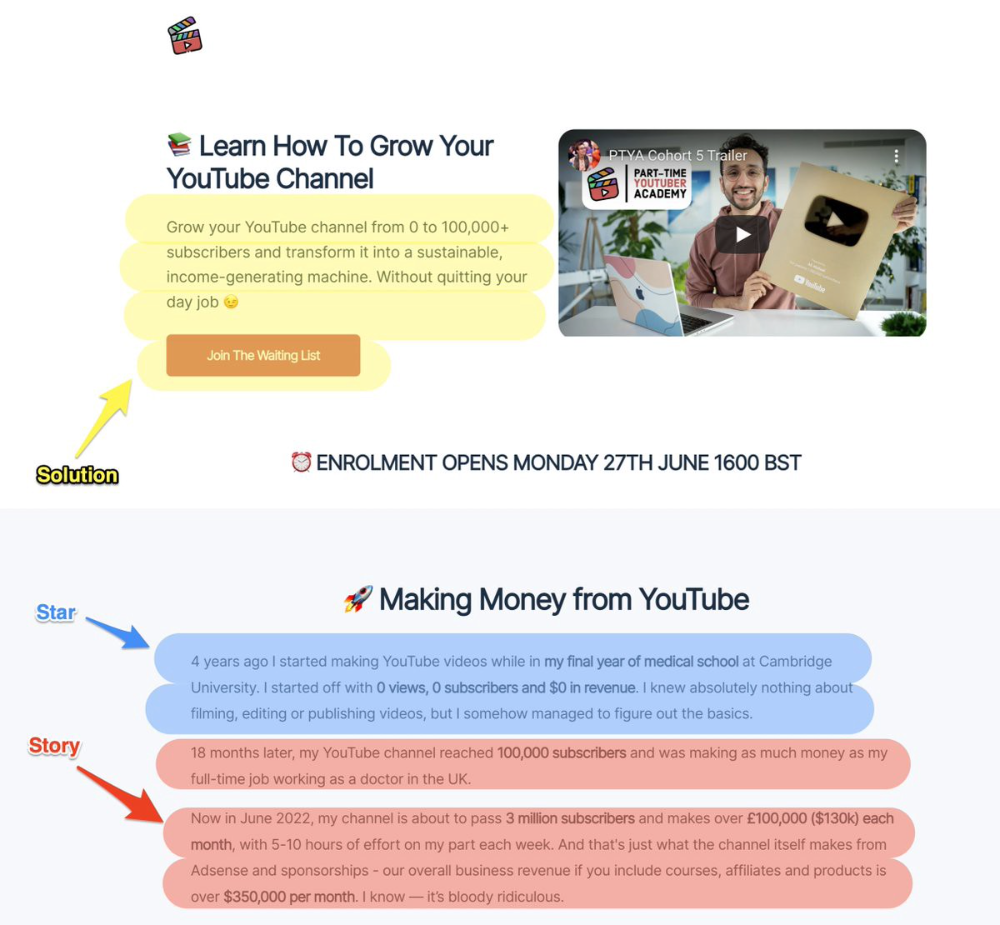
7. Star — Story — Solution (S.S.S)
PASTOR + PAS = star-solution-story. Like PAS, it employs stories to persuade.
S.S.S. is effective storytelling:
Star: (Person had a problem)
Story: (until they had a breakthrough)
Solution: (That created a transformation)
Ali Abdaal is a YouTuber with a great S.S.S copy.
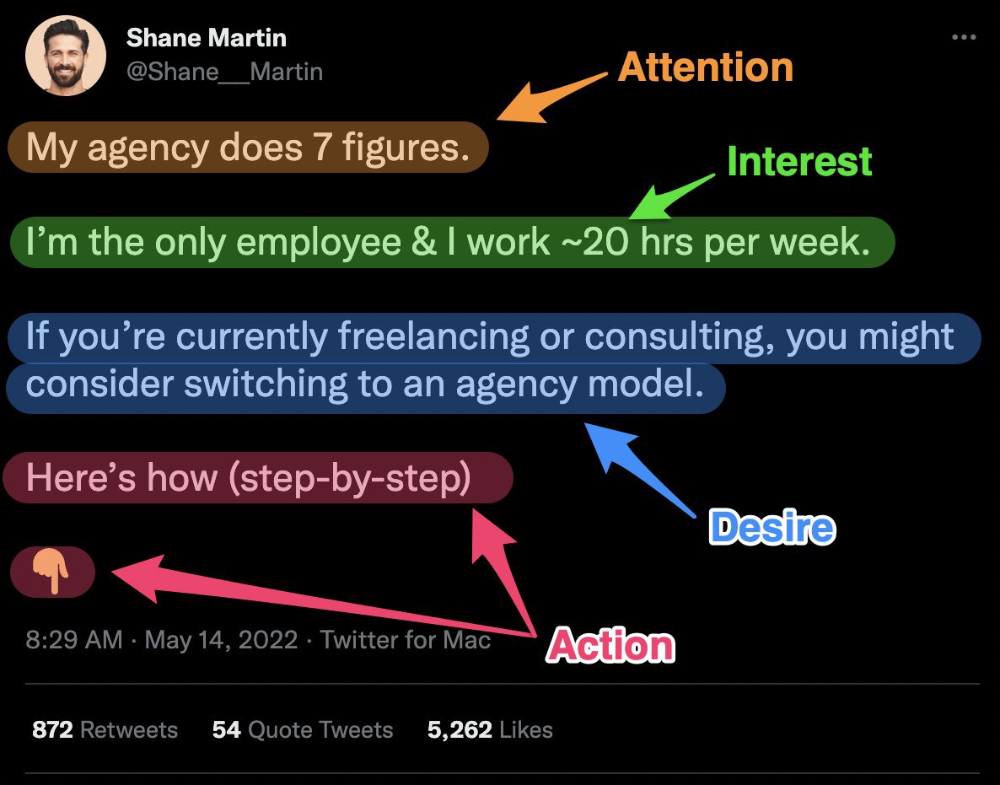
8. Attention — Interest — Desire — Action
AIDA is another classic. This copywriting framework is great for fast-paced environments (think all digital content on Linkedin, Twitter, Medium, etc.).
It works with:
Page landings
writing on thread
Email
It's a good structure since it's concise, attention-grabbing, and action-oriented.
Shane Martin, Twitter's creator, uses this approach to create viral content.
TL;DR
8 copywriting frameworks that teach marketing better than a four-year degree
Feature-advantage-benefit
Before-after-bridge
Star-story-solution
P.A.S.T.O.R
Q.U.E.S.T
A.I.D.A
P.A.S
4P’s

Peter Steven Ho
3 years ago
Thank You for 21 Fantastic Years, iPod
Apple's latest revelation may shock iPod fans and former owners.
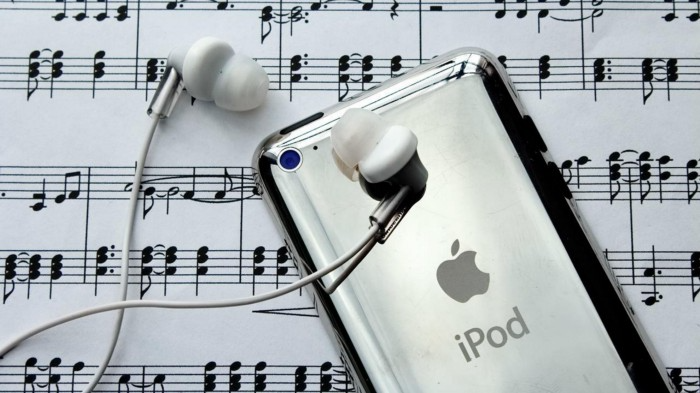
Apple discontinued the iPod touch on May 11, 2022. After 21 years, Apple killed the last surviving iPod, a device Steve Jobs believed would revolutionize the music industry.
Jobs was used to making bold predictions, but few expected Apple's digital music player to change the music industry. It did.
This chaos created new business opportunities. Spotify, YouTube, and Amazon are products of that chaotic era.
As the digital landscape changes, so do consumers, and the iPod has lost favor. I'm sure Apple realizes the importance of removing an icon. The iPod was Apple like the Mac and iPhone. I think it's bold to retire such a key Apple cornerstone. What would Jobs do?
iPod evolution across the ages
Here's an iPod family tree for all you enthusiasts.
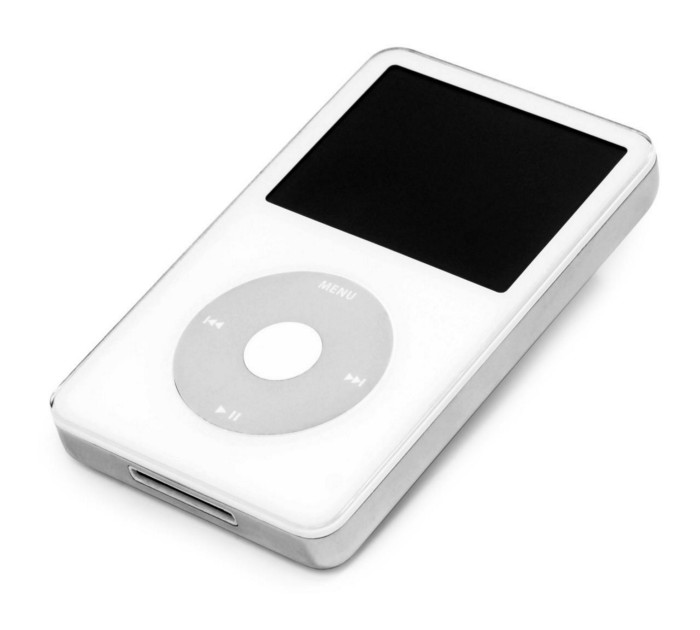
iPod vintage (Oct 2001 to Sep 2014, 6 generations)
The original iPod had six significant upgrades since 2001. Apple announced an 80 GB ($249) and 160 GB ($349) iPod classic in 2007.
Apple updated the 80 GB model with a 120 GB device in September 2008. Apple upgraded the 120 GB model with a 160 GB variant a year later (2009). This was the last iteration, and Apple discontinued the classic in September 2014.
iPod nano (Jan 2004 to Sep 2005, 2 generations)
Apple debuted a smaller, brightly-colored iPod in 2004. The first model featured 4 GB, enough for 1,000 songs.
Apple produced a new 4 GB or 6 GB iPod mini in February 2005 and discontinued it in September when they released a better-looking iPod nano.
iTouch nano (Sep 2005 to July 2017, 7 generations)
I loved the iPod nano. It was tiny and elegant with enough tech to please most music aficionados, unless you carry around your complete music collection.
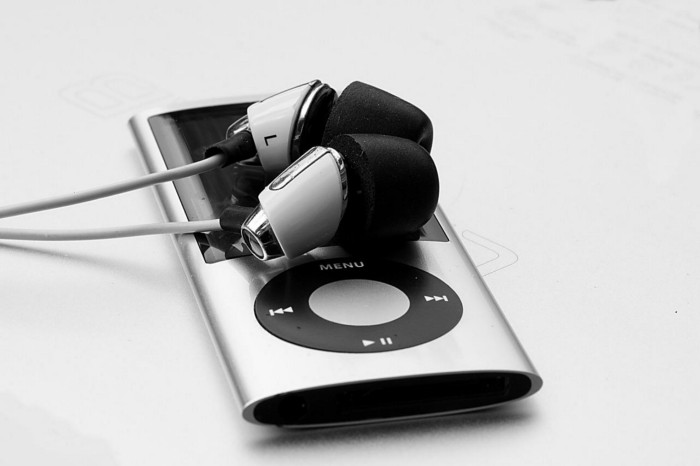
Apple owed much of the iPod nano's small form and success to solid-state flash memory. Flash memory doesn't need power because it has no moving parts. This makes the iPod nano more durable than the iPod classic and mini, which employ hard drives.
Apple manufactured seven generations of the iPod nano, improving its design, display screen, memory, battery, and software, but abandoned it in July 2017 due to dwindling demand.
Shuffle iPod (Jan 2005 to Jul 2017, 4 generations)
The iPod shuffle was entry-level. It was a simple, lightweight, tiny music player. The iPod shuffle was perfect for lengthy bike trips, runs, and hikes.
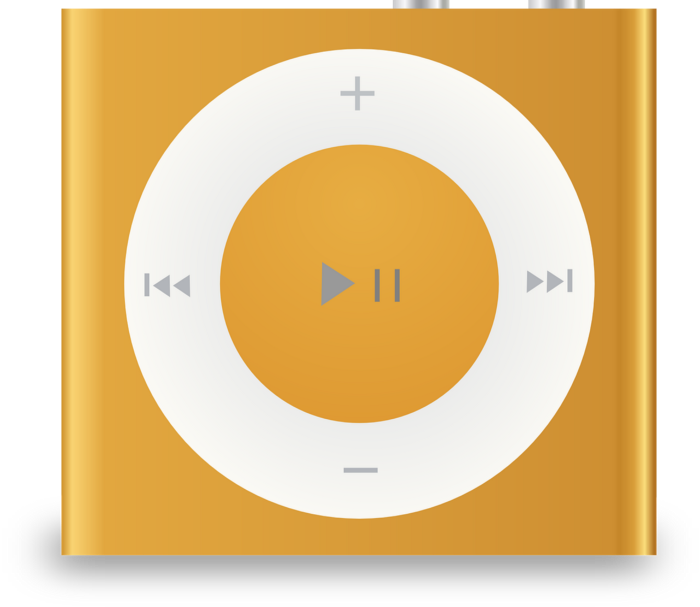
Apple sold 10 million iPod shuffles in the first year and kept making them for 12 years, through four significant modifications.
iOS device (Sep 2007 to May 2022, 7 generations)
The iPod touch's bigger touchscreen interface made it a curious addition to the iPod family. The iPod touch resembled an iPhone more than the other iPods, making them hard to tell apart.
Many were dissatisfied that Apple removed functionality from the iPod touch to avoid making it too similar to the iPhone. Seven design improvements over 15 years brought the iPod touch closer to the iPhone, but not completely.
The iPod touch uses the same iOS operating system as the iPhone, giving it access to many apps, including handheld games.
The iPod touch's long production run is due to the next generation of music-loving gamers.
What made the iPod cool
iPod revolutionized music listening. It was the first device to store and play MP3 music, allowing you to carry over 1,000 songs anywhere.
The iPod changed consumer electronics with its scroll wheel and touchscreen. Jobs valued form and function equally. He showed people that a product must look good to inspire an emotional response and ignite passion.
The elegant, tiny iPod was a tremendous sensation when it arrived for $399 in October 2001. Even at this price, it became a must-have for teens to CEOs.
It's hard to identify any technology that changed how music was downloaded and played like the iPod. Apple iPod and iTunes had 63% of the paid music download market in the fourth quarter of 2012.
The demise of the iPod was inevitable
Apple discontinuing the iPod touch after 21 years is sad. This ends a 00s music icon.
Jobs was a genius at anticipating market needs and opportunities, and Apple launched the iPod at the correct time.
Few consumer electronics items have had such a lasting impact on music lovers and the music industry as the iPod.
Smartphones and social media have contributed to the iPod's decline. Instead of moving to the music, the new generation of consumers is focused on social media. They're no longer passive content consumers; they're active content creators seeking likes and followers. Here, the smartphone has replaced the iPod.
It's hard not to feel a feeling of loss, another part of my adolescence now forgotten by the following generation.
So, if you’re lucky enough to have a working iPod, hang on to that relic and enjoy the music and the nostalgia.