


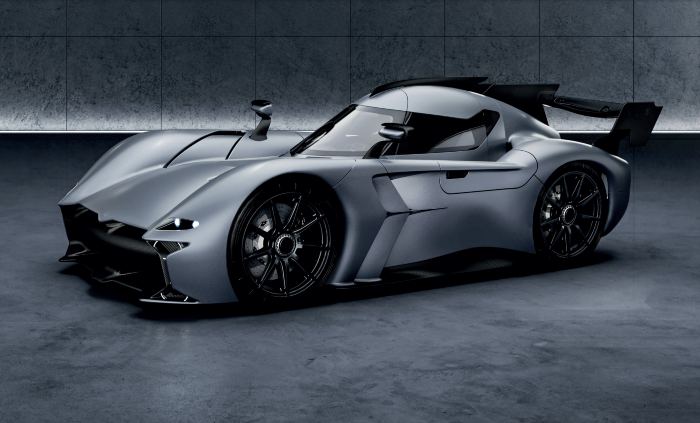
Because of regulations, the $3 million Mercedes-AMG ONE will not (officially) be available in the United States or Canada.
We asked Mercedes to clarify whether "customers" refers to people who have expressed interest in buying the AMG ONE but haven't made a down payment or paid in full for a production slot, and a company spokesperson told that it's the latter – "Actual customers for AMG ONE in the United States and Canada."
The Mercedes-AMG ONE has finally arrived in manufacturing form after numerous delays. This may be the most complicated and magnificent hypercar ever created, but according to Mercedes, those roads will not be found in the United States or Canada.
Despite all of the well-deserved excitement around the gorgeous AMG ONE, there was no word on when US customers could expect their cars. Our Editor-in-Chief became aware of this and contacted Mercedes to clarify the matter. Mercedes-hypercar AMG's with the F1-derived 1,049 HP 1.6-liter V6 engine will not be homologated for the US market, they've confirmed.
Mercedes has informed its customers in the United States and Canada that the ONE will not be arriving to North America after all, as of today, June 1, 2022. The whole text of the letter is included below, so sit back and wait for Mercedes to explain why we (or they) won't be getting (or seeing) the hypercar. Mercedes claims that all 275 cars it wants to produce have already been reserved, with net pricing in Europe starting at €2.75 million (about US$2.93 million at today's exchange rates), before country-specific taxes.
"The AMG-ONE was created with one purpose in mind: to provide a straight technology transfer of the World Championship-winning Mercedes-AMG Petronas Formula 1 E PERFORMANCE drive unit to the road." It's the first time a complete Formula 1 drive unit has been integrated into a road car.
Every component of the AMG ONE has been engineered to redefine high performance, with 1,000+ horsepower, four electric motors, and a blazing top speed of more than 217 mph. While the engine's beginnings are in competition, continuous research and refinement has left us with a difficult choice for the US market.
We determined that following US road requirements would considerably damage its performance and overall driving character in order to preserve the distinctive nature of its F1 powerplant. We've made the strategic choice to make the automobile available for road use in Europe, where it complies with all necessary rules."
If this is the first time US customers have heard about it, which it shouldn't be, we understand if it's a bit off-putting. The AMG ONE could very probably be Mercedes' final internal combustion hypercar of this type.
Nonetheless, we wouldn't be surprised if a few make their way to the United States via the federal government's "Show and Display" exemption provision. This legislation permits the importation of automobiles such as the AMG ONE, but only for a total of 2,500 miles per year.
The McLaren Speedtail, the Koenigsegg One:1, and the Bugatti EB110 are among the automobiles that have been imported under this special rule. We just hope we don't have to wait too long to see the ONE in the United States.
More on Lifestyle

Michael Le
4 years ago
Union LA x Air Jordan 2 “Future Is Now” PREVIEW
With the help of Virgil Abloh and Union LA‘s Chris Gibbs, it's now clear that Jordan Brand intended to bring the Air Jordan 2 back in 2022.
The “Future Is Now” collection includes two colorways of MJ's second signature as well as an extensive range of apparel and accessories.
“We wanted to juxtapose what some futuristic gear might look like after being worn and patina'd,”
Union stated on the collaboration's landing page.
“You often see people's future visions that are crisp and sterile. We thought it would be cool to wear it in and make it organic...”
The classic co-branding appears on short-sleeve tees, hoodies, and sweat shorts/sweat pants, all lightly distressed at the hems and seams.
Also, a filtered black-and-white photo of MJ graces the adjacent long sleeves, labels stitch into the socks, and the Jumpman logo adorns the four caps.
Liner jackets and flight pants will also be available, adding reimagined militaria to a civilian ensemble.
The Union LA x Air Jordan 2 (Grey Fog and Rattan) shares many of the same beats. Vintage suedes show age, while perforations and detailing reimagine Bruce Kilgore's design for the future.
The “UN/LA” tag across the modified eye stays, the leather patch across the tongue, and the label that wraps over the lateral side of the collar complete the look.
The footwear will also include a Crater Slide in the “Grey Fog” color scheme.
BUYING
On 4/9 and 4/10 from 9am-3pm, Union LA will be giving away a pair of Air Jordan 2s at their La Brea storefront (110 S. LA BREA AVE. LA, CA 90036). The raffle is only open to LA County residents with a valid CA ID. You must enter by 11:59pm on 4/10 to win. Winners will be notified via email.

Will Lockett
3 years ago
There Is A New EV King in Town
McMurtry Spéirling outperforms Tesla in speed and efficiency.
EVs were ridiculously slow for decades. However, the 2008 Tesla Roadster revealed that EVs might go extraordinarily fast. The Tesla Model S Plaid and Rimac Nevera are the fastest-accelerating road vehicles, despite combustion-engined road cars dominating the course. A little-known firm beat Tesla and Rimac in the 0-60 race, beat F1 vehicles on a circuit, and boasts a 350-mile driving range. The McMurtry Spéirling is completely insane.
Mat Watson of CarWow, a YouTube megastar, was recently handed a Spéirling and access to Silverstone Circuit (view video above). Mat ran a quarter-mile on Silverstone straight with former F1 driver Max Chilton. The little pocket-rocket automobile touched 100 mph in 2.7 seconds, completed the quarter mile in 7.97 seconds, and hit 0-60 in 1.4 seconds. When looking at autos quickly, 0-60 times can seem near. The Tesla Model S Plaid does 0-60 in 1.99 seconds, which is comparable to the Spéirling. Despite the meager statistics, the Spéirling is nearly 30% faster than Plaid!
My vintage VW Golf 1.4s has an 8.8-second 0-60 time, whereas a BMW Z4 3.0i is 30% faster (with a 0-60 time of 6 seconds). I tried to beat a Z4 off the lights in my Golf, but the Beamer flew away. If they challenge the Spéirling in a Model S Plaid, they'll feel as I did. Fast!
Insane quarter-mile drag time. Its road car record is 7.97 seconds. A Dodge Demon, meant to run extremely fast quarter miles, finishes so in 9.65 seconds, approximately 20% slower. The Rimac Nevera's 8.582-second quarter-mile record was miles behind drag racing. This run hampered the Spéirling. Because it was employing gearing that limited its top speed to 150 mph, it reached there in a little over 5 seconds without accelerating for most of the quarter mile! McMurtry can easily change the gearing, making the Spéirling run quicker.
McMurtry did this how? First, the Spéirling is a tiny single-seater EV with a 60 kWh battery pack, making it one of the lightest EVs ever. The 1,000-hp Spéirling has more than one horsepower per kg. The Nevera has 0.84 horsepower per kg and the Plaid 0.44.
However, you cannot simply construct a car light and power it. Instead of accelerating, it would spin. This makes the Spéirling a fan car. Its huge fans create massive downforce. These fans provide the Spéirling 2 tonnes of downforce while stationary, so you could park it on the ceiling. Its fast 0-60 time comes from its downforce, which lets it deliver all that power without wheel spin.
It also possesses complete downforce at all speeds, allowing it to tackle turns faster than even race vehicles. Spéirlings overcame VW IDRs and F1 cars to set the Goodwood Hill Climb record (read more here). The Spéirling is a dragstrip winner and track dominator, unlike the Plaid and Nevera.
The Spéirling is astonishing for a single-seater. Fan-generated downforce is more efficient than wings and splitters. It also means the vehicle has very minimal drag without the fan. The Spéirling can go 350 miles per charge (WLTP) or 20-30 minutes at full speed on a track despite its 60 kWh battery pack. The G-forces would hurt your neck before the battery died if you drove around a track for longer. The Spéirling can charge at over 200 kW in about 30 minutes. Thus, driving to track days, having fun, and returning is possible. Unlike other high-performance EVs.
Tesla, Rimac, or Lucid will struggle to defeat the Spéirling. They would need to build a fan automobile because adding power to their current vehicle would make it uncontrollable. The EV and automobile industries now have a new, untouchable performance king.

Sam Hickmann
4 years ago
The Jordan 6 Rings Reintroduce Classic Bulls
The Jordan 6 Rings return in Bulls colors, a deviation from previous releases. The signature red color is used on the midsole and heel, as well as the chenille patch and pull tab. The rest of the latter fixture is black, matching the outsole and adjacent Jumpman logos. Finally, white completes the look, from the leather mudguard to the lace unit. Here's a closer look at the Jordan 6 Rings. Sizes should be available soon on Nike.com and select retailers. Also, official photos of the Air Jordan 1 Denim have surfaced.
Jordan 6 Rings
Release Date: 2022
Color: N/A
Mens: $130
Style Code: 322992-126
You might also like

Jayden Levitt
3 years ago
Billionaire who was disgraced lost his wealth more quickly than anyone in history
If you're not genuine, you'll be revealed.
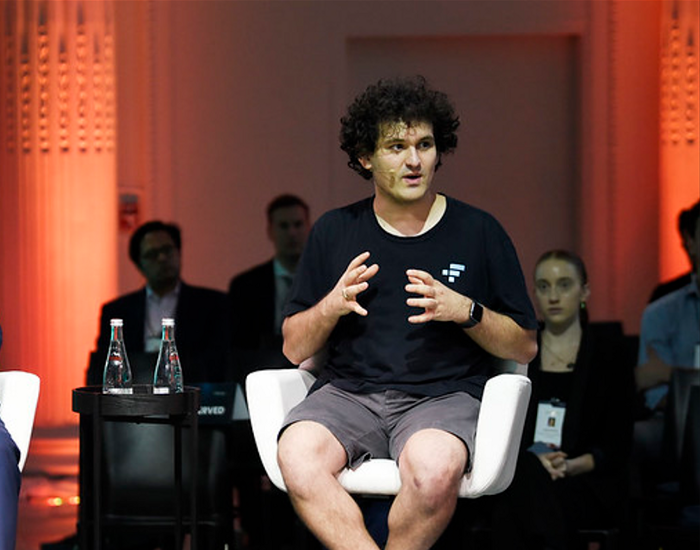
Sam Bankman-Fried (SBF) was called the Cryptocurrency Warren Buffet.
No wonder.
SBF's trading expertise, Blockchain knowledge, and ability to construct FTX attracted mainstream investors.
He had a fantastic worldview, donating much of his riches to charity.
As the onion layers peel back, it's clear he wasn't the altruistic media figure he portrayed.
SBF's mistakes were disastrous.
Customer deposits were traded and borrowed by him.
With ten other employees, he shared a $40 million mansion where they all had polyamorous relationships.
Tone-deaf and wasteful marketing expenditures, such as the $200 million spent to change the name of the Miami Heat stadium to the FTX Arena
Democrats received a $40 million campaign gift.
And now there seems to be no regret.
FTX was a 32-billion-dollar cryptocurrency exchange.
It went bankrupt practically overnight.
SBF, FTX's creator, exploited client funds to leverage trade.
FTX had $1 billion in customer withdrawal reserves against $9 billion in liabilities in sister business Alameda Research.
Bloomberg Billionaire Index says it's the largest and fastest net worth loss in history.
It gets worse.
SBF's net worth is $900 Million, however he must still finalize FTX's bankruptcy.
SBF's arrest in the Bahamas and SEC inquiry followed news that his cryptocurrency exchange had crashed, losing billions in customer deposits.
A journalist contacted him on Twitter D.M., and their exchange is telling.
His ideas are revealed.
Kelsey Piper says they didn't expect him to answer because people under investigation don't comment.
Bankman-Fried wanted to communicate, and the interaction shows he has little remorse.
SBF talks honestly about FTX gaming customers' money and insults his competition.
Reporter Kelsey Piper was outraged by what he said and felt the mistakes SBF says plague him didn't evident in the messages.
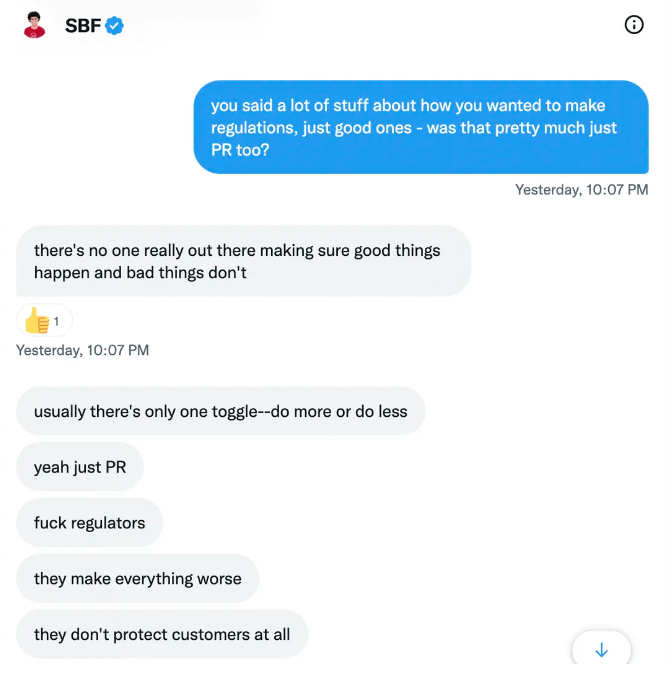
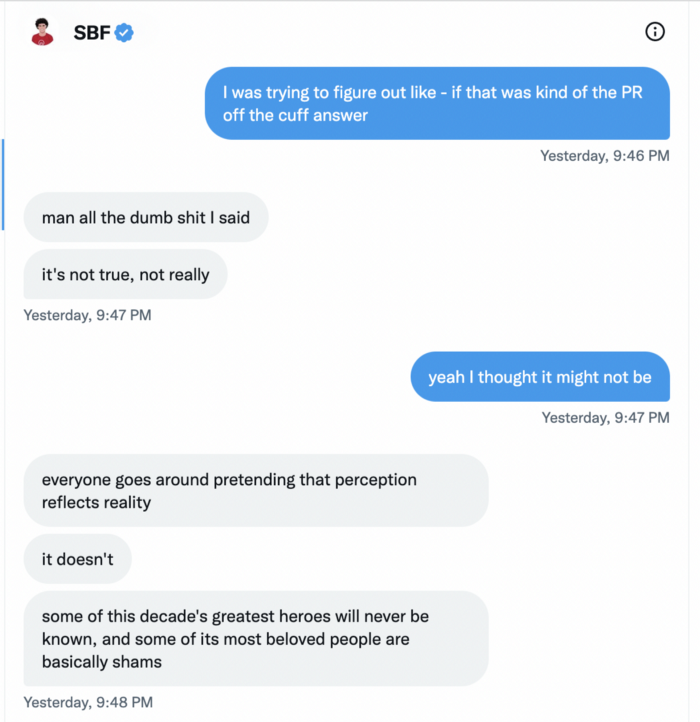
Before FTX's crash, SBF was a poster child for Cryptocurrency regulation and avoided criticizing U.S. regulators.
He tells Piper that his lobbying is just excellent PR.
It shows his genuine views and supports cynics' opinions that his attempts to win over U.S. authorities were good for his image rather than Crypto.
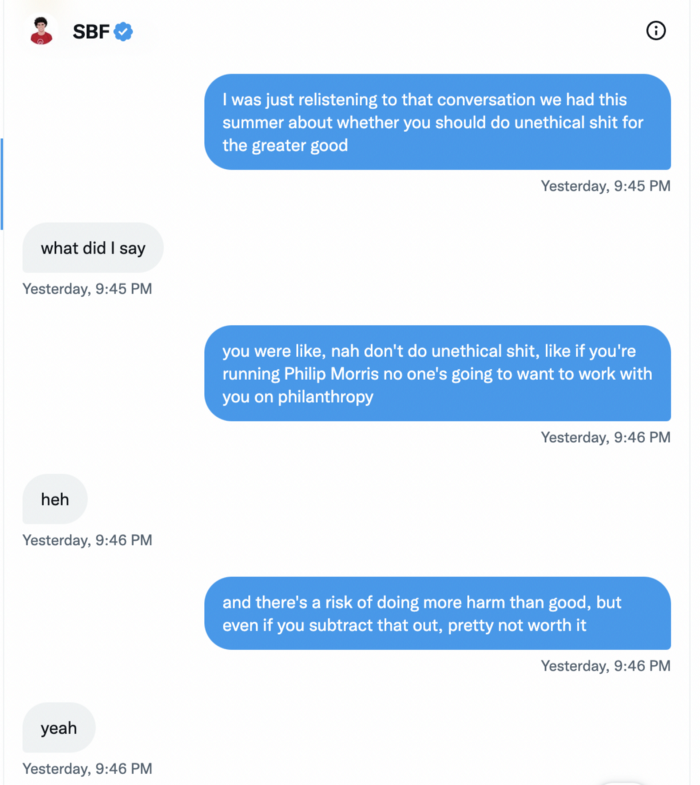
SBF’s responses are in Grey, and Pipers are in Blue.
It's unclear if SBF cut corners for his gain. In their Twitter exchange, Piper revisits an interview question about ethics.
SBF says, "All the foolish sh*t I said"
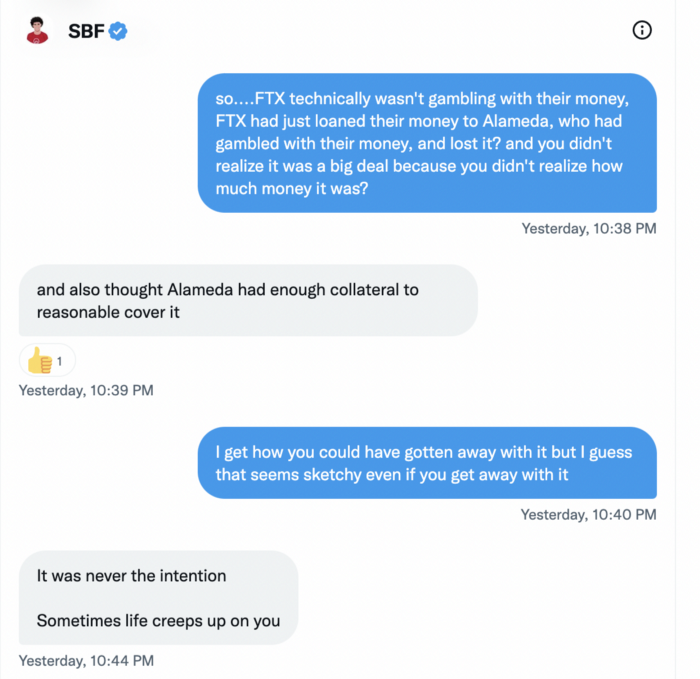
SBF claims FTX has never invested customer monies.
Piper challenged him on Twitter.
While he insisted FTX didn't use customer deposits, he said sibling business Alameda borrowed too much from FTX's balance sheet.
He did, basically.
When consumers tried to withdraw money, FTX was short.
SBF thought Alameda had enough money to cover FTX customers' withdrawals, but life sneaks up on you.
SBF believes most exchanges have done something similar to FTX, but they haven't had a bank run (a bunch of people all wanting to get their deposits out at the same time).
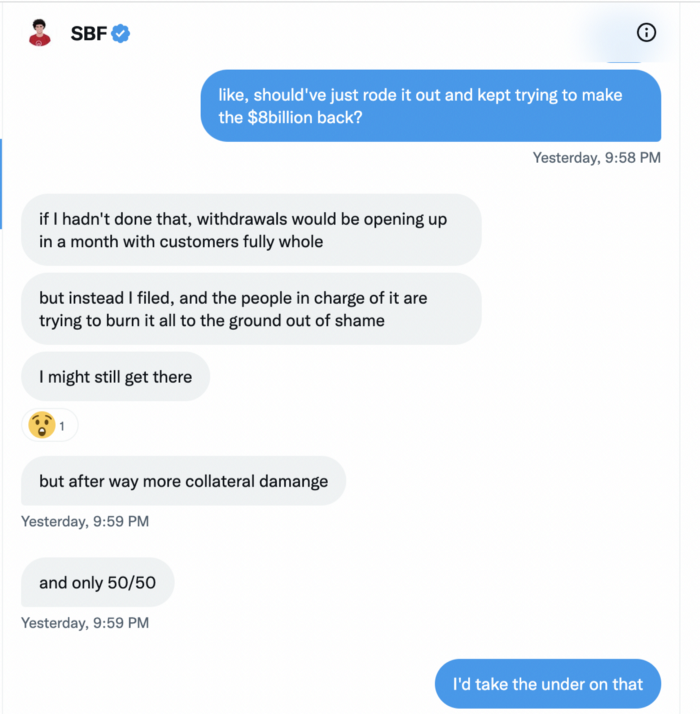
SBF believes he shouldn't have consented to the bankruptcy and kept attempting to raise more money because withdrawals would be open in a month with clients whole.
If additional money came in, he needed $8 billion to bridge the creditors' deficit, and there aren't many corporations with $8 billion to spare.
Once clients feel protected, they will continue to leave their assets on the exchange, according to one idea.
Kevin OLeary, a world-renowned hedge fund manager, says not all investors will walk through the open gate once the company is safe, therefore the $8 Billion wasn't needed immediately.
SBF claims the bankruptcy was his biggest error because he could have accumulated more capital.

Final Reflections
Sam Bankman-Fried, 30, became the world's youngest billionaire in four years.
Never listen to what people say about investing; watch what they do.
SBF is a trader who gets wrecked occasionally.
Ten first-time entrepreneurs ran FTX, screwing each other with no risk management.
It prevents opposing or challenging perspectives and echo chamber highs.
Twitter D.M. conversation with a journalist is the final nail.
He lacks an experienced crew.
This event will surely speed up much-needed regulation.
It's also prompted cryptocurrency exchanges to offer proof of reserves to calm customers.

Glorin Santhosh
3 years ago
Start organizing your ideas by using The Second Brain.

Building A Second Brain helps us remember connections, ideas, inspirations, and insights. Using contemporary technologies and networks increases our intelligence.
This approach makes and preserves concepts. It's a straightforward, practical way to construct a second brain—a remote, centralized digital store for your knowledge and its sources.
How to build ‘The Second Brain’
Have you forgotten any brilliant ideas? What insights have you ignored?
We're pressured to read, listen, and watch informative content. Where did the data go? What happened?
Our brains can store few thoughts at once. Our brains aren't idea banks.
Building a Second Brain helps us remember thoughts, connections, and insights. Using digital technologies and networks expands our minds.
Ten Rules for Creating a Second Brain
1. Creative Stealing
Instead of starting from scratch, integrate other people's ideas with your own.
This way, you won't waste hours starting from scratch and can focus on achieving your goals.
Users of Notion can utilize and customize each other's templates.
2. The Habit of Capture
We must record every idea, concept, or piece of information that catches our attention since our minds are fragile.
When reading a book, listening to a podcast, or engaging in any other topic-related activity, save and use anything that resonates with you.
3. Recycle Your Ideas
Reusing our own ideas across projects might be advantageous since it helps us tie new information to what we already know and avoids us from starting a project with no ideas.
4. Projects Outside of Category
Instead of saving an idea in a folder, group it with documents for a project or activity.
If you want to be more productive, gather suggestions.
5. Burns Slowly
Even if you could finish a job, work, or activity if you focused on it, you shouldn't.
You'll get tired and can't advance many projects. It's easier to divide your routine into daily tasks.
Few hours of daily study is more productive and healthier than entire nights.
6. Begin with a surplus
Instead of starting with a blank sheet when tackling a new subject, utilise previous articles and research.
You may have read or saved related material.
7. Intermediate Packets
A bunch of essay facts.
You can utilize it as a document's section or paragraph for different tasks.
Memorize useful information so you can use it later.
8. You only know what you make
We can see, hear, and read about anything.
What matters is what we do with the information, whether that's summarizing it or writing about it.
9. Make it simpler for yourself in the future.
Create documents or files that your future self can easily understand. Use your own words, mind maps, or explanations.
10. Keep your thoughts flowing.
If you don't employ the knowledge in your second brain, it's useless.
Few people exercise despite knowing its benefits.
Conclusion:
You may continually move your activities and goals closer to completion by organizing and applying your information in a way that is results-focused.
Profit from the information economy's explosive growth by turning your specialized knowledge into cash.
Make up original patterns and linkages between topics.
You may reduce stress and information overload by appropriately curating and managing your personal information stream.
Learn how to apply your significant experience and specific knowledge to a new job, business, or profession.
Without having to adhere to tight, time-consuming constraints, accumulate a body of relevant knowledge and concepts over time.
Take advantage of all the learning materials that are at your disposal, including podcasts, online courses, webinars, books, and articles.

Trevor Stark
3 years ago
Economics is complete nonsense.
Mainstream economics haven't noticed.

What come to mind when I say the word "economics"?
Probably GDP, unemployment, and inflation.
If you've ever watched the news or listened to an economist, they'll use data like these to defend a political goal.
The issue is that these statistics are total bunk.
I'm being provocative, but I mean it:
The economy is not measured by GDP.
How many people are unemployed is not counted in the unemployment rate.
Inflation is not measured by the CPI.
All orthodox economists' major economic statistics are either wrong or falsified.
Government institutions create all these stats. The administration wants to reassure citizens the economy is doing well.
GDP does not reflect economic expansion.
GDP measures a country's economic size and growth. It’s calculated by the BEA, a government agency.
The US has the world's largest (self-reported) GDP, growing 2-3% annually.
If GDP rises, the economy is healthy, say economists.
Why is the GDP flawed?
GDP measures a country's yearly spending.
The government may adjust this to make the economy look good.
GDP = C + G + I + NX
C = Consumer Spending
G = Government Spending
I = Investments (Equipment, inventories, housing, etc.)
NX = Exports minus Imports
GDP is a country's annual spending.
The government can print money to boost GDP. The government has a motive to increase and manage GDP.
Because government expenditure is part of GDP, printing money and spending it on anything will raise GDP.
They've done this. Since 1950, US government spending has grown 8% annually, faster than GDP.
In 2022, government spending accounted for 44% of GDP. It's the highest since WWII. In 1790-1910, it was 3% of GDP.
Who cares?
The economy isn't only spending. Focus on citizens' purchasing power or quality of life.
Since GDP just measures spending, the government can print money to boost GDP.
Even if Americans are poorer than last year, economists can say GDP is up and everything is fine.
How many people are unemployed is not counted in the unemployment rate.
The unemployment rate measures a country's labor market. If unemployment is high, people aren't doing well economically.
The BLS estimates the (self-reported) unemployment rate as 3-4%.
Why is the unemployment rate so high?
The US government surveys 100k persons to measure unemployment. They extrapolate this data for the country.
They come into 3 categories:
Employed
People with jobs are employed … duh.
Unemployed
People who are “jobless, looking for a job, and available for work” are unemployed
Not in the labor force
The “labor force” is the employed + the unemployed.
The unemployment rate is the percentage of unemployed workers.
Problem is unemployed definition. You must actively seek work to be considered unemployed.
You're no longer unemployed if you haven't interviewed in 4 weeks.
This shit makes no goddamn sense.
Why does this matter?
You can't interview if there are no positions available. You're no longer unemployed after 4 weeks.
In 1994, the BLS redefined "unemployed" to exclude discouraged workers.
If you haven't interviewed in 4 weeks, you're no longer counted in the unemployment rate.
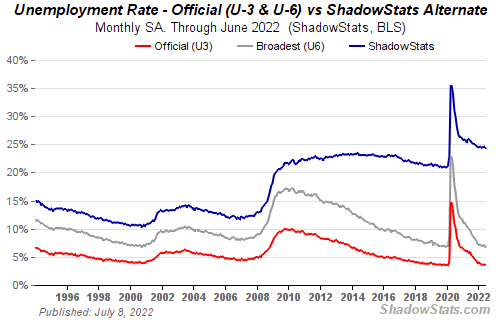
If unemployment were measured by total unemployed, it would be 25%.
Because the government wants to keep the unemployment rate low, they modify the definition.
If every US resident was unemployed and had no job interviews, economists would declare 0% unemployment. Excellent!
Inflation is not measured by the CPI.
The BLS measures CPI. This month was the highest since 1981.
CPI measures the cost of a basket of products across time. Food, energy, shelter, and clothes are included.
A 9.1% CPI means the basket of items is 9.1% more expensive.
What is the CPI problem?
Here's a more detailed explanation of CPI's flaws.
In summary, CPI is manipulated to be understated.
Housing costs are understated to manipulate CPI. Housing accounts for 33% of the CPI because it's the biggest expense for most people.
This signifies it's the biggest CPI weight.
Rather than using actual house prices, the Bureau of Labor Statistics essentially makes shit up. You can read more about the process here.
Surprise! It’s bullshit
The BLS stated Shelter's price rose 5.5% this month.
House prices are up 11-21%. (Source 1, Source 2, Source 3)
Rents are up 14-26%. (Source 1, Source 2)
Why is this important?
If CPI included housing prices, it would be 12-15 percent this month, not 9.1 percent.
9% inflation is nuts. Your money's value halves every 7 years at 9% inflation.
Worse is 15% inflation. Your money halves every 4 years at 15% inflation.
If everyone realized they needed to double their wage every 4-5 years to stay wealthy, there would be riots.
Inflation drains our money's value so the government can keep printing it.
The Solution
Most individuals know the existing system doesn't work, but can't explain why.
People work hard yet lag behind. The government lies about the economy's data.
In reality:
GDP has been down since 2008
25% of Americans are unemployed
Inflation is actually 15%
People might join together to vote out kleptocratic politicians if they knew the reality.
Having reliable economic data is the first step.
People can't understand the situation without sufficient information. Instead of immigrants or billionaires, people would blame liar politicians.
Here’s the vision:
A decentralized, transparent, and global dashboard that tracks economic data like GDP, unemployment, and inflation for every country on Earth.
Government incentives influence economic statistics.
ShadowStats has already started this effort, but the calculations must be transparent, decentralized, and global to be effective.
If interested, email me at trevorstark02@gmail.com.
Here are some links to further your research: