


More on Marketing

Karo Wanner
3 years ago
This is how I started my Twitter account.
My 12-day results look good.
Twitter seemed for old people and politicians.
I thought the platform would die soon like Facebook.
The platform's growth stalled around 300m users between 2015 and 2019.
In 2020, Twitter grew and now has almost 400m users.
Niharikaa Kaur Sodhi built a business on Twitter while I was away, despite its low popularity.
When I read about the success of Twitter users in the past 2 years, I created an account and a 3-month strategy.
I'll see if it's worth starting Twitter in 2022.
Late or perfect? I'll update you. Track my Twitter growth. You can find me here.
My Twitter Strategy
My Twitter goal is to build a community and recruit members for Mindful Monday.
I believe mindfulness is the only way to solve problems like poverty, inequality, and the climate crisis.
The power of mindfulness is my mission.
Mindful Monday is your weekly reminder to live in the present moment. I send mindfulness tips every Monday.
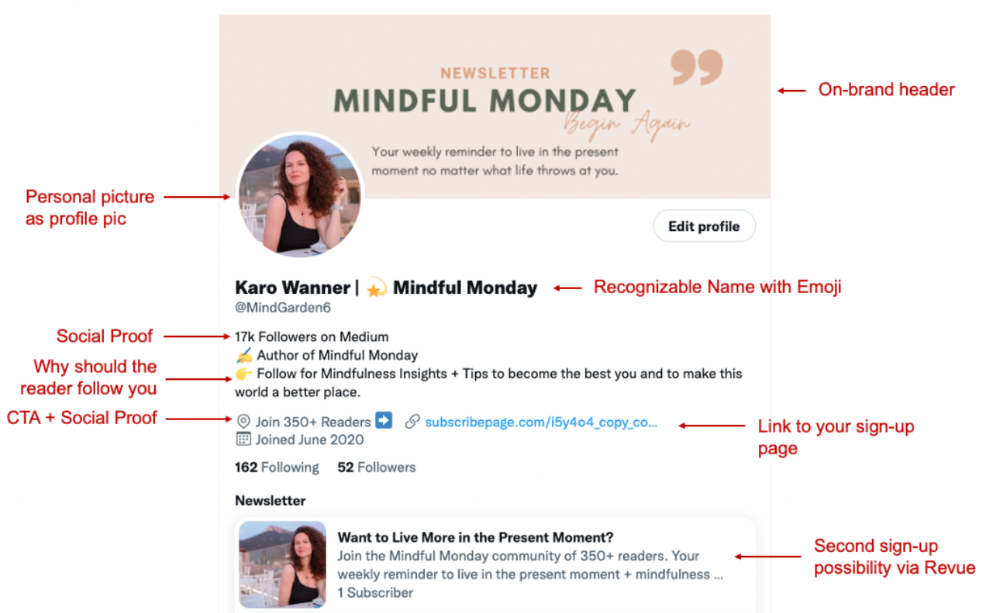
My Twitter profile promotes Mindful Monday and encourages people to join.
What I paid attention to:
I designed a brand-appropriate header to promote Mindful Monday.
Choose a profile picture. People want to know who you are.
I added my name as I do on Medium, Instagram, and emails. To stand out and be easily recognized, add an emoji if appropriate. Add what you want to be known for, such as Health Coach, Writer, or Newsletter.
People follow successful, trustworthy people. Describe any results you have. This could be views, followers, subscribers, or major news outlets. Create!
Tell readers what they'll get by following you. Can you help?
Add CTA to your profile. Your Twitter account's purpose. Give instructions. I placed my sign-up link next to the CTA to promote Mindful Monday. Josh Spector recommended this. (Thanks! Bonus tip: If you don't want the category to show in your profile, e.g. Entrepreneur, go to edit profile, edit professional profile, and choose 'Other'
Here's my Twitter:
I'm no expert, but I tried. Please share any additional Twitter tips and suggestions in the comments.
To hide your Revue newsletter subscriber count:
Join Revue. Select 'Hide Subscriber Count' in Account settings > Settings > Subscriber Count. Voila!
How frequently should you tweet?
1 to 20 Tweets per day, but consistency is key.
Stick to a daily tweet limit. Start with less and be consistent than the opposite.
I tweet 3 times per day. That's my comfort zone. Larger accounts tweet 5–7 times daily.
Do what works for you and that is the right amount.
Twitter is a long-term game, so plan your tweets for a year.
How to Batch Your Tweets?
Sunday batchs.
Sunday evenings take me 1.5 hours to create all my tweets for the week.
Use a word document and write down your posts. Podcasts, books, my own articles inspire me.
When I have a good idea or see a catchy Tweet, I take a screenshot.
To not copy but adapt.
Two pillars support my content:
(90% ~ 29 tweets per week) Inspirational quotes, mindfulness tips, zen stories, mistakes, myths, book recommendations, etc.
(10% 2 tweets per week) I share how I grow Mindful Monday with readers. This pillar promotes MM and behind-the-scenes content.
Second, I schedule all my Tweets using TweetDeck. I tweet at 7 a.m., 5 p.m., and 6 p.m.
Include Twitter Threads in your content strategy
Tweets are blog posts. In your first tweet, you include a headline, then tweet your content.
That’s how you create a series of connected Tweets.
What’s the point? You have more room to convince your reader you're an expert.
Add a call-to-action to your thread.
Follow for more like this
Newsletter signup (share your link)
Ask for retweet
One thread per week is my goal.
I'll schedule threads with Typefully. In the free version, you can schedule one Tweet, but that's fine.
Pin a thread to the top of your profile if it leads to your newsletter. So new readers see your highest-converting content first.
Tweet Medium posts
I also tweet Medium articles.
I schedule 1 weekly repost for 5 weeks after each publication. I share the same article daily for 5 weeks.
Every time I tweet, I include a different article quote, so even if the link is the same, the quote adds value.
Engage Other Experts
When you first create your account, few people will see it. Normal.
If you comment on other industry accounts, you can reach their large audience.
First, you need 50 to 100 followers. Here's my beginner tip.
15 minutes a day or when I have downtime, I comment on bigger accounts in my niche.
My 12-Day Results
Now let's look at the first data.
I had 32 followers on March 29. 12 followers in 11 days. I have 52 now.
Not huge, but growing rapidly.
Let's examine impressions/views.
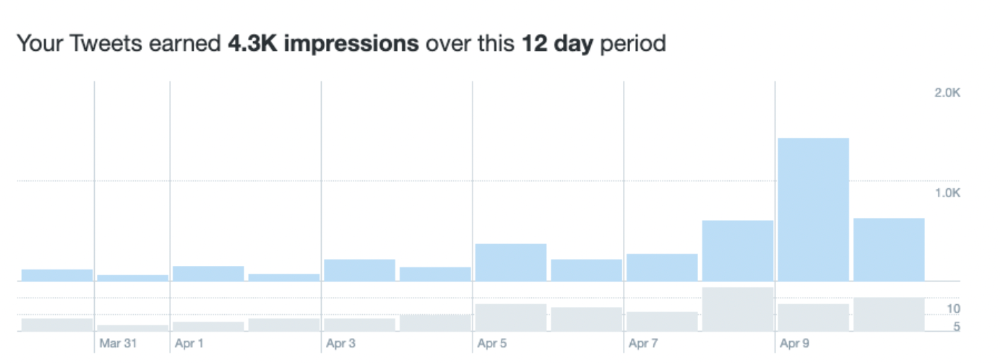
As a newbie, I gained 4,300 impressions/views in 12 days. On Medium, I got fewer views.
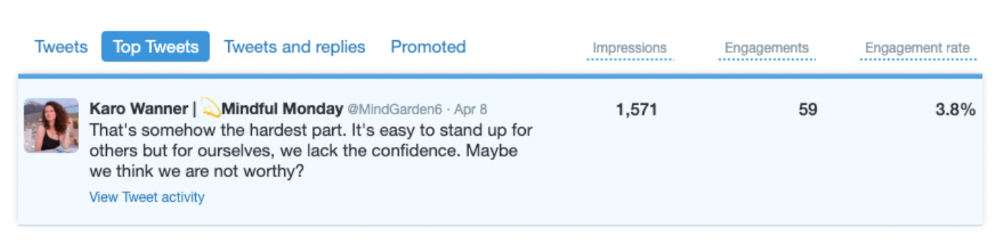
The 1,6k impressions per day spike comes from a larger account I mentioned the day before. First, I was shocked to see the spike and unsure of its origin.
These results are promising given the effort required to be consistent on Twitter.
Let's see how my journey progresses. I'll keep you posted.
Tweeters, Does this content strategy make sense? What's wrong? Comment below.
Let's support each other on Twitter. Here's me.
Which Twitter strategy works for you in 2022?
This post is a summary. Read the full article here

Rita McGrath
3 years ago
Flywheels and Funnels
Traditional sales organizations used the concept of a sales “funnel” to describe the process through which potential customers move, ending up with sales at the end. Winners today have abandoned that way of thinking in favor of building flywheels — business models in which every element reinforces every other.
Ah, the marketing funnel…
Prospective clients go through a predictable set of experiences, students learn in business school marketing classes. It looks like this:
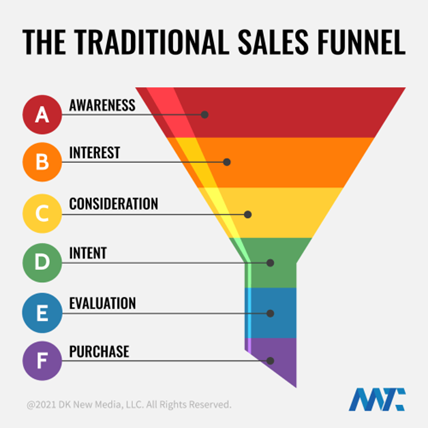
Understanding the funnel helps evaluate sales success indicators. Gail Goodwin, former CEO of small business direct mail provider Constant Contact, said managing the pipeline was key to escaping the sluggish SaaS ramp of death.
Like the funnel concept. To predict how well your business will do, measure how many potential clients are aware of it (awareness) and how many take the next step. If 1,000 people heard about your offering and 10% showed interest, you'd have 100 at that point. If 50% of these people made buyer-like noises, you'd know how many were, etc. It helped model buying trends.
TV, magazine, and radio advertising are pricey for B2C enterprises. Traditional B2B marketing involved armies of sales reps, which was expensive and a barrier to entry.
Cracks in the funnel model
Digital has exposed the funnel's limitations. Hubspot was born at a time when buyers and sellers had huge knowledge asymmetries, according to co-founder Brian Halligan. Those selling a product could use the buyer's lack of information to become a trusted partner.
As the world went digital, getting information and comparing offerings became faster, easier, and cheaper. Buyers didn't need a seller to move through a funnel. Interactions replaced transactions, and the relationship didn't end with a sale.
Instead, buyers and sellers interacted in a constant flow. In many modern models, the sale is midway through the process (particularly true with subscription and software-as-a-service models). Example:
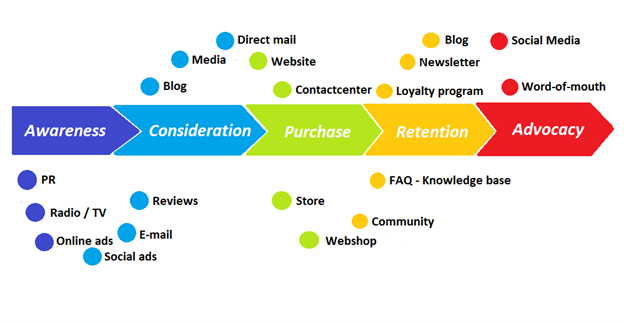
You're creating a winding journey with many touch points, not a funnel (and lots of opportunities for customers to get lost).
From winding journey to flywheel
Beyond this revised view of an interactive customer journey, a company can create what Jim Collins famously called a flywheel. Imagine rolling a heavy disc on its axis. The first few times you roll it, you put in a lot of effort for a small response. The same effort yields faster turns as it gains speed. Over time, the flywheel gains momentum and turns without your help.
Modern digital organizations have created flywheel business models, in which any additional force multiplies throughout the business. The flywheel becomes a force multiplier, according to Collins.
Amazon is a famous flywheel example. Collins explained the concept to Amazon CEO Jeff Bezos at a corporate retreat in 2001. In The Everything Store, Brad Stone describes in his book The Everything Store how he immediately understood Amazon's levers.
The result (drawn on a napkin):
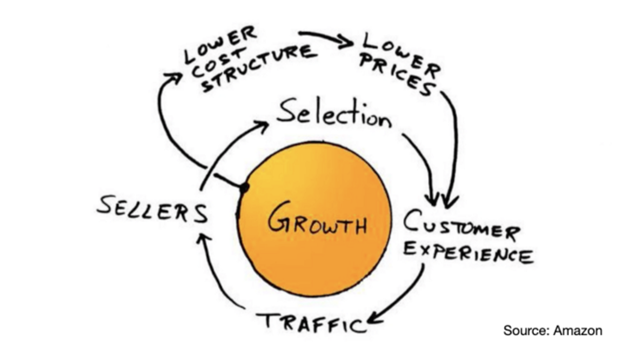
Low prices and a large selection of products attracted customers, while a focus on customer service kept them coming back, increasing traffic. Third-party sellers then increased selection. Low-cost structure supports low-price commitment. It's brilliant! Every wheel turn creates acceleration.
Where from here?
Flywheel over sales funnel! Consider these business terms.
Matthew Royse
3 years ago
5 Tips for Concise Writing
Here's how to be clear.
“I have only made this letter longer because I have not had the time to make it shorter.” — French mathematician, physicist, inventor, philosopher, and writer Blaise Pascal
Concise.
People want this. We tend to repeat ourselves and use unnecessary words.
Being vague frustrates readers. It focuses their limited attention span on figuring out what you're saying rather than your message.
Edit carefully.
“Examine every word you put on paper. You’ll find a surprising number that don’t serve any purpose.” — American writer, editor, literary critic, and teacher William Zinsser
How do you write succinctly?
Here are three ways to polish your writing.
1. Delete
Your readers will appreciate it if you delete unnecessary words. If a word or phrase is essential, keep it. Don't force it.
Many readers dislike bloated sentences. Ask yourself if cutting a word or phrase will change the meaning or dilute your message.
For example, you could say, “It’s absolutely essential that I attend this meeting today, so I know the final outcome.” It’s better to say, “It’s critical I attend the meeting today, so I know the results.”
Key takeaway
Delete actually, completely, just, full, kind of, really, and totally. Keep the necessary words, cut the rest.
2. Just Do It
Don't tell readers your plans. Your readers don't need to know your plans. Who are you?
Don't say, "I want to highlight our marketing's problems." Our marketing issues are A, B, and C. This cuts 5–7 words per sentence.
Keep your reader's attention on the essentials, not the fluff. What are you doing? You won't lose readers because you get to the point quickly and don't build up.
Key takeaway
Delete words that don't add to your message. Do something, don't tell readers you will.
3. Cut Overlap
You probably repeat yourself unintentionally. You may add redundant sentences when brainstorming. Read aloud to detect overlap.
Remove repetition from your writing. It's important to edit our writing and thinking to avoid repetition.
Key Takeaway
If you're repeating yourself, combine sentences to avoid overlap.
4. Simplify
Write as you would to family or friends. Communicate clearly. Don't use jargon. These words confuse readers.
Readers want specifics, not jargon. Write simply. Done.
Most adults read at 8th-grade level. Jargon and buzzwords make speech fluffy. This confuses readers who want simple language.
Key takeaway
Ensure all audiences can understand you. USA Today's 5th-grade reading level is intentional. They want everyone to understand.
5. Active voice
Subjects perform actions in active voice. When you write in passive voice, the subject receives the action.
For example, “the board of directors decided to vote on the topic” is an active voice, while “a decision to vote on the topic was made by the board of directors” is a passive voice.
Key takeaway
Active voice clarifies sentences. Active voice is simple and concise.
Bringing It All Together
Five tips help you write clearly. Delete, just do it, cut overlap, use simple language, and write in an active voice.
Clear writing is effective. It's okay to occasionally use unnecessary words or phrases. Realizing it is key. Check your writing.
Adding words costs.
Write more concisely. People will appreciate it and read your future articles, emails, and messages. Spending extra time will increase trust and influence.
“Not that the story need be long, but it will take a long while to make it short.” — Naturalist, essayist, poet, and philosopher Henry David Thoreau
You might also like

Protos
3 years ago
Plagiarism on OpenSea: humans and computers
OpenSea, a non-fungible token (NFT) marketplace, is fighting plagiarism. A new “two-pronged” approach will aim to root out and remove copies of authentic NFTs and changes to its blue tick verified badge system will seek to enhance customer confidence.
According to a blog post, the anti-plagiarism system will use algorithmic detection of “copymints” with human reviewers to keep it in check.
Last year, NFT collectors were duped into buying flipped images of the popular BAYC collection, according to The Verge. The largest NFT marketplace had to remove its delay pay minting service due to an influx of copymints.
80% of NFTs removed by the platform were minted using its lazy minting service, which kept the digital asset off-chain until the first purchase.
NFTs copied from popular collections are opportunistic money-grabs. Right-click, save, and mint the jacked JPEGs that are then flogged as an authentic NFT.
The anti-plagiarism system will scour OpenSea's collections for flipped and rotated images, as well as other undescribed permutations. The lack of detail here may be a deterrent to scammers, or it may reflect the new system's current rudimentary nature.
Thus, human detectors will be needed to verify images flagged by the detection system and help train it to work independently.
“Our long-term goal with this system is two-fold: first, to eliminate all existing copymints on OpenSea, and second, to help prevent new copymints from appearing,” it said.
“We've already started delisting identified copymint collections, and we'll continue to do so over the coming weeks.”
It works for Twitter, why not OpenSea
OpenSea is also changing account verification. Early adopters will be invited to apply for verification if their NFT stack is worth $100 or more. OpenSea plans to give the blue checkmark to people who are active on Twitter and Discord.
This is just the beginning. We are committed to a future where authentic creators can be verified, keeping scammers out.
Also, collections with a lot of hype and sales will get a blue checkmark. For example, a new NFT collection sold by the verified BAYC account will have a blue badge to verify its legitimacy.
New requests will be responded to within seven days, according to OpenSea.
These programs and products help protect creators and collectors while ensuring our community can confidently navigate the world of NFTs.
By elevating authentic content and removing plagiarism, these changes improve trust in the NFT ecosystem, according to OpenSea.
OpenSea is indeed catching up with the digital art economy. Last August, DevianArt upgraded its AI image recognition system to find stolen tokenized art on marketplaces like OpenSea.
It scans all uploaded art and compares it to “public blockchain events” like Ethereum NFTs to detect stolen art.

Suzie Glassman
3 years ago
How I Stay Fit Despite Eating Fast Food and Drinking Alcohol
Here's me. Perfectionism is unnecessary.

This post isn't for people who gag at the prospect of eating french fries. I've been ridiculed for stating you can lose weight eating carbs and six-pack abs aren't good.
My family eats frozen processed meals and quick food most weeks (sometimes more). Clean eaters may think I'm unqualified to give fitness advice. I get it.
Hear me out, though. I’m a 44-year-old raising two busy kids with a weekly-traveling husband. Tutoring, dance, and guitar classes fill weeknights. I'm also juggling my job and freelancing.
I'm as worried and tired as my clients. I wish I ate only kale smoothies and salads. I can’t. Despite my mistakes, I'm fit. I won't promise you something just because it worked for me. But here’s a look at how I manage.
What I largely get right about eating
I have a flexible diet and track my daily intake. I count protein, fat, and carbs. Only on vacation or exceptional occasions do I not track.
My protein goal is 1 g per lb. I consume a lot of chicken breasts, eggs, turkey, and lean ground beef. I also occasionally drink protein shakes.
I eat 220–240 grams of carbs daily. My carb count depends on training volume and goals. I'm trying to lose weight slowly. If I want to lose weight faster, I cut carbs to 150-180.
My carbs include white rice, Daves Killer Bread, fruit, pasta, and veggies. I don't eat enough vegetables, so I take Athletic Greens. Also, V8.
Fat grams over 50 help me control my hormones. Recently, I've reached 70-80 grams. Cooking with olive oil. I eat daily dark chocolate. Eggs, butter, milk, and cheese contribute to the rest.
Those frozen meals? What can I say? Stouffer’s lasagna is sometimes needed. I order the healthiest fast food I can find (although I can never bring myself to order the salad). That's a chicken sandwich or a kid's hamburger. I rarely order fries. I eat slowly and savor each bite to feel full.
Potato chips and sugary cereals are in the pantry, but I'm not tempted. My kids eat them because I'd rather teach them moderation than total avoidance. If I eat them, I only eat one portion.
If you're not hungry and eating enough protein and fat, you won't want to eat everything in sight.
I drink once or twice a week. As a result, I rarely overdo it.
Food tracking is tedious and frustrating for many. Taking breaks and using estimates when eating out help. Not perfect, but realistic.
I practice a prolonged fast to enhance metabolic adaptability
Metabolic flexibility is the ability to switch between fuel sources (fat and carbs) based on activity intensity and time since eating. At rest or during low to moderate exertion, your body burns fat. Your body burns carbs after eating and during intense exercise.
Our metabolic flexibility can be hampered by lack of exercise, overeating, and stress. Our bodies become lousy fat burners, making weight loss difficult.
Once a week, I skip dinner (usually around 24 hours). Long-term fasting teaches my body to burn fat. It provides me one low-calorie day a week (I break the fast with a normal-sized dinner).
Fasting day helps me maintain my weight on weekends, when I typically overeat and drink.
Try an extended fast slowly. Delay breakfast by two hours. Next week, add two hours, etc. It takes practice to go that long without biting off your arm. I also suggest consulting your doctor.
I stay active.
I've always been active. As a child, I danced many nights a week, was on the high school dance team, and ran marathons in my 20s.
Often, I feel driven by an internal engine. Working from home makes it easy to exercise. If that’s not you, I get it. Everyone can benefit from raising their baseline.
After taking the kids to school, I walk two miles around the neighborhood. When I need to think, I switch off podcasts. First thing in the morning, I go for a walk.
I lift weights Monday, Wednesday, and Friday. 45 minutes is typical. I run 45-90 minutes on Tuesday and Thursday. I'm slow but reliable. On Saturdays and Sundays, I walk and add a short spin class if I'm not too tired.
I almost never forgo sleep.
I rarely stay up past 10 p.m., much to my night-owl husband's dismay. My 7-8-hour nights help me recover from workouts and handle stress. Without it, I'm grumpy.
I suppose sleep duration matters more than bedtime. Some people just can't fall asleep early. Internal clock and genetics determine sleep and wake hours.
Prioritize sleep.
Last thoughts
Fitness and diet advice is often useless. Some of the advice is inaccurate, dangerous, or difficult to follow if you have a life. I want to throw a shoe at my screen when I see headlines promising to speed up my metabolism or help me lose fat.
I studied exercise physiology for years. No shortcuts exist. No medications or cleanses reset metabolism. I play the hand I'm dealt. I realize that just because something works for me, it won't for you.
If I wanted 15% body fat and ripped abs, I'd have to be stricter. I occasionally think I’d like to get there. But then I remember I’m happy with my life. I like fast food and beer. Pizza and margaritas are favorites (not every day).
You can get it mostly right and live a healthy life.

joyce shen
4 years ago
Framework to Evaluate Metaverse and Web3
Everywhere we turn, there's a new metaverse or Web3 debut. Microsoft recently announced a $68.7 BILLION cash purchase of Activision.
Like AI in 2013 and blockchain in 2014, NFT growth in 2021 feels like this year's metaverse and Web3 growth. We are all bombarded with information, conflicting signals, and a sensation of FOMO.
How can we evaluate the metaverse and Web3 in a noisy, new world? My framework for evaluating upcoming technologies and themes is shown below. I hope you will also find them helpful.
Understand the “pipes” in a new space.
Whatever people say, Metaverse and Web3 will have to coexist with the current Internet. Companies who host, move, and store data over the Internet have a lot of intriguing use cases in Metaverse and Web3, whether in infrastructure, data analytics, or compliance. Hence the following point.
## Understand the apps layer and their infrastructure.
Gaming, crypto exchanges, and NFT marketplaces would not exist today if not for technology that enables rapid app creation. Yes, according to Chainalysis and other research, 30–40% of Ethereum is self-hosted, with the rest hosted by large cloud providers. For Microsoft to acquire Activision makes strategic sense. It's not only about the games, but also the infrastructure that supports them.
Follow the money
Understanding how money and wealth flow in a complex and dynamic environment helps build clarity. Unless you are exceedingly wealthy, you have limited ability to significantly engage in the Web3 economy today. Few can just buy 10 ETH and spend it in one day. You must comprehend who benefits from the process, and how that 10 ETH circulates now and possibly tomorrow. Major holders and players control supply and liquidity in any market. Today, most Web3 apps are designed to increase capital inflow so existing significant holders can utilize it to create a nascent Web3 economy. When you see a new Metaverse or Web3 application, remember how money flows.
What is the use case?
What does the app do? If there is no clear use case with clear makers and consumers solving a real problem, then the euphoria soon fades, and the only stakeholders who remain enthused are those who have too much to lose.
Time is a major competition that is often overlooked.
We're only busier, but each day is still 24 hours. Using new apps may mean that time is lost doing other things. The user must be eager to learn. Metaverse and Web3 vs. our time? I don't think we know the answer yet (at least for working adults whose cost of time is higher).
I don't think we know the answer yet (at least for working adults whose cost of time is higher).
People and organizations need security and transparency.
For new technologies or apps to be widely used, they must be safe, transparent, and trustworthy. What does secure Metaverse and Web3 mean? This is an intriguing subject for both the business and public sectors. Cloud adoption grew in part due to improved security and data protection regulations.
The following frameworks can help analyze and understand new technologies and emerging technological topics, unless you are a significant investment fund with the financial ability to gamble on numerous initiatives and essentially form your own “index fund”.
I write on VC, startups, and leadership.
More on https://www.linkedin.com/in/joycejshen/ and https://joyceshen.substack.com/
This writing is my own opinion and does not represent investment advice.