


Gran Turismo 7 Update Eases Up On The Grind After Fan Outrage
Polyphony Digital has changed the game after apologizing in March.
To make amends for some disastrous downtime, Gran Turismo 7 director Kazunori Yamauchi announced a credits handout and promised to “dramatically change GT7's car economy to help make amends” last month. The first of these has arrived.
The game's 1.11 update includes the following concessions to players frustrated by the economy and its subsequent grind:
-
The last half of the World Circuits events have increased in-game credit rewards.
-
Modified Arcade and Custom Race rewards
-
Clearing all circuit layouts with Gold or Bronze now rewards In-game Credits. Exiting the Sector selection screen with the Exit button will award Credits if an event has already been cleared.
-
Increased Credits Rewards in Lobby and Daily Races
-
Increased the free in-game Credits cap from 20,000,000 to 100,000,000.
Additionally, “The Human Comedy” missions are one-hour endurance races that award “up to 1,200,000” credits per event.
This isn't everything Yamauchi promised last month; he said it would take several patches and updates to fully implement the changes. Here's a list of everything he said would happen, some of which have already happened (like the World Cup rewards and credit cap):
- Increase rewards in the latter half of the World Circuits by roughly 100%.
- Added high rewards for all Gold/Bronze results clearing the Circuit Experience.
- Online Races rewards increase.
- Add 8 new 1-hour Endurance Race events to Missions. So expect higher rewards.
- Increase the non-paid credit limit in player wallets from 20M to 100M.
- Expand the number of Used and Legend cars available at any time.
- With time, we will increase the payout value of limited time rewards.
- New World Circuit events.
- Missions now include 24-hour endurance races.
- Online Time Trials added, with rewards based on the player's time difference from the leader.
- Make cars sellable.
The full list of updates and changes can be found here.
Read the original post.
More on Gaming

Chris Moyse
4 years ago
Sony and LEGO raise $2 billion for Epic Games' metaverse
‘Kid-friendly’ project holds $32 billion valuation
Epic Games announced today that it has raised $2 billion USD from Sony Group Corporation and KIRKBI (holding company of The LEGO Group). Both companies contributed $1 billion to Epic Games' upcoming ‘metaverse' project.
“We need partners who share our vision as we reimagine entertainment and play. Our partnership with Sony and KIRKBI has found this,” said Epic Games CEO Tim Sweeney. A new metaverse will be built where players can have fun with friends and brands create creative and immersive experiences, as well as creators thrive.
Last week, LEGO and Epic Games announced their plans to create a family-friendly metaverse where kids can play, interact, and create in digital environments. The service's users' safety and security will be prioritized.
With this new round of funding, Epic Games' project is now valued at $32 billion.
“Epic Games is known for empowering creators large and small,” said KIRKBI CEO Sren Thorup Srensen. “We invest in trends that we believe will impact the world we and our children will live in. We are pleased to invest in Epic Games to support their continued growth journey, with a long-term focus on the future metaverse.”
Epic Games is expected to unveil its metaverse plans later this year, including its name, details, services, and release date.

Matthew Cluff
3 years ago
GTO Poker 101
"GTO" (Game Theory Optimal) has been used a lot in poker recently. To clarify its meaning and application, the aim of this article is to define what it is, when to use it when playing, what strategies to apply for how to play GTO poker, for beginner and more advanced players!
Poker GTO
In poker, you can choose between two main winning strategies:
Exploitative play maximizes expected value (EV) by countering opponents' sub-optimal plays and weaker tendencies. Yes, playing this way opens you up to being exploited, but the weaker opponents you're targeting won't change their game to counteract this, allowing you to reap maximum profits over the long run.
GTO (Game-Theory Optimal): You try to play perfect poker, which forces your opponents to make mistakes (which is where almost all of your profit will be derived from). It mixes bluffs or semi-bluffs with value bets, clarifies bet sizes, and more.
GTO vs. Exploitative: Which is Better in Poker?
Before diving into GTO poker strategy, it's important to know which of these two play styles is more profitable for beginners and advanced players. The simple answer is probably both, but usually more exploitable.
Most players don't play GTO poker and can be exploited in their gameplay and strategy, allowing for more profits to be made using an exploitative approach. In fact, it’s only in some of the largest games at the highest stakes that GTO concepts are fully utilized and seen in practice, and even then, exploitative plays are still sometimes used.
Knowing, understanding, and applying GTO poker basics will create a solid foundation for your poker game. It's also important to understand GTO so you can deviate from it to maximize profits.
GTO Poker Strategy
According to Ed Miller's book "Poker's 1%," the most fundamental concept that only elite poker players understand is frequency, which could be in relation to cbets, bluffs, folds, calls, raises, etc.
GTO poker solvers (downloadable online software) give solutions for how to play optimally in any given spot and often recommend using mixed strategies based on select frequencies.
In a river situation, a solver may tell you to call 70% of the time and fold 30%. It may also suggest calling 50% of the time, folding 35% of the time, and raising 15% of the time (with a certain range of hands).
Frequencies are a fundamental and often unrecognized part of poker, but they run through these 5 GTO concepts.
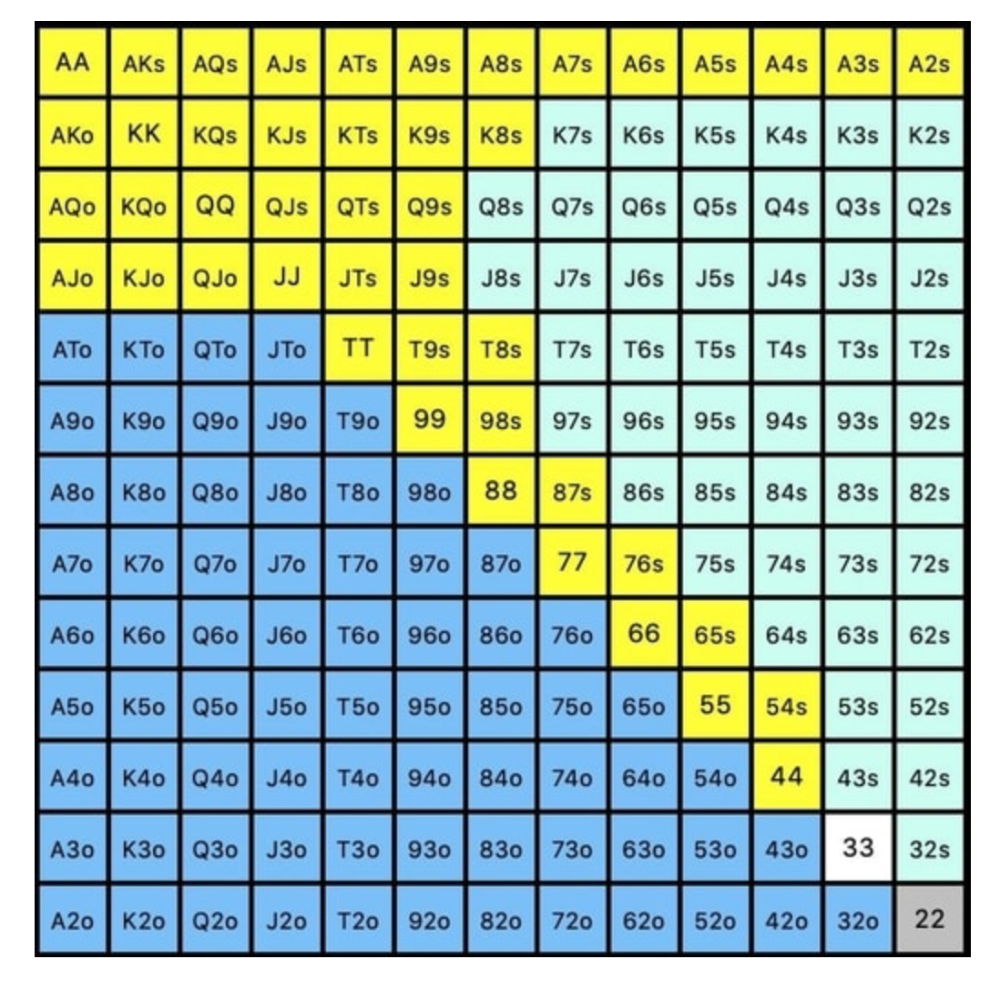
1. Preflop ranges
To compensate for positional disadvantage, out-of-position players must open tighter hand ranges.
Premium starting hands aren't enough, though. Considering GTO poker ranges and principles, you want a good, balanced starting hand range from each position with at least some hands that can make a strong poker hand regardless of the flop texture (low, mid, high, disconnected, etc).
Below is a GTO preflop beginner poker chart for online 6-max play, showing which hand ranges one should open-raise with. Table positions are color-coded (see key below).
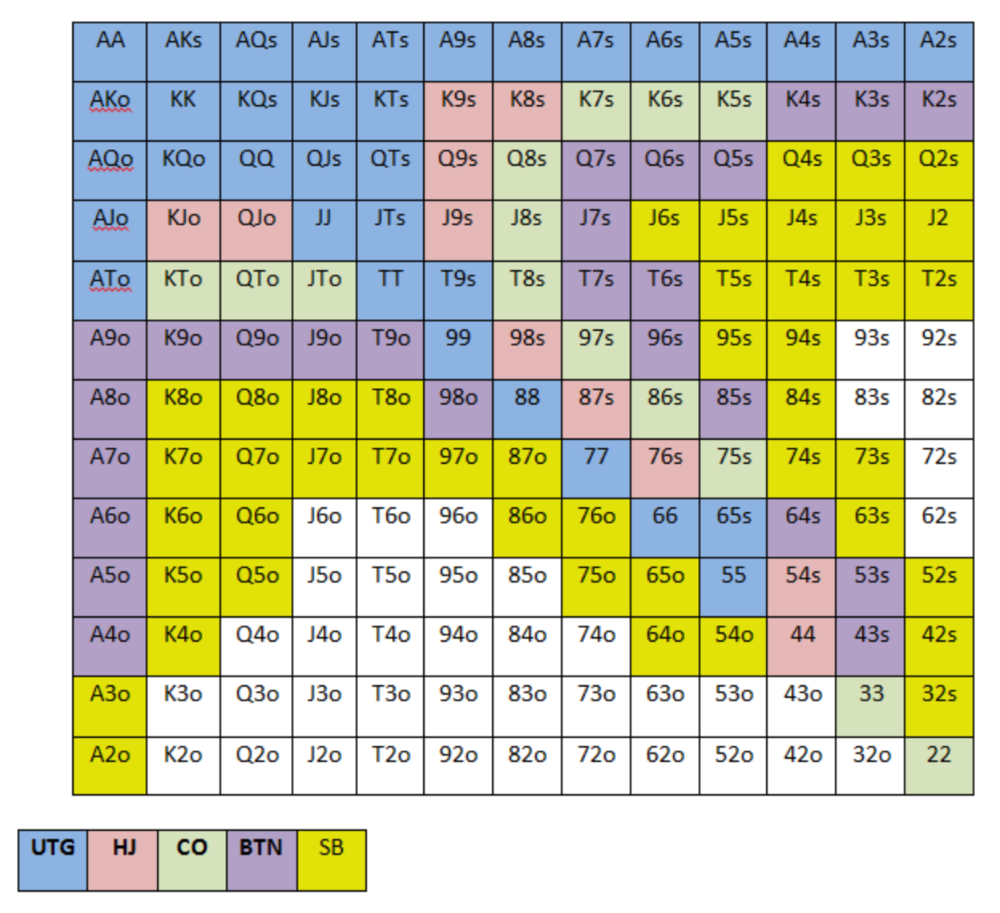
NOTE: For GTO play, it's advisable to use a mixed strategy for opening in the small blind, combining open-limps and open-raises for various hands. This cannot be illustrated with the color system used for the chart.
Choosing which hands to play is often a math problem, as discussed below.
Other preflop GTO poker charts include which hands to play after a raise, which to 3bet, etc. Solvers can help you decide which preflop hands to play (call, raise, re-raise, etc.).
2. Pot Odds
Always make +EV decisions that profit you as a poker player. Understanding pot odds (and equity) can help.
Postflop Pot Odds
Let’s say that we have JhTh on a board of 9h8h2s4c (open-ended straight-flush draw). We have $40 left and $50 in the pot. He has you covered and goes all-in. As calling or folding are our only options, playing GTO involves calculating whether a call is +EV or –EV. (The hand was empty.)
Any remaining heart, Queen, or 7 wins the hand. This means we can improve 15 of 46 unknown cards, or 32.6% of the time.
What if our opponent has a set? The 4h or 2h could give us a flush, but it could also give the villain a boat. If we reduce outs from 15 to 14.5, our equity would be 31.5%.
We must now calculate pot odds.
(bet/(our bet+pot)) = pot odds
= $50 / ($40 + $90)
= $40 / $130
= 30.7%
To make a profitable call, we need at least 30.7% equity. This is a profitable call as we have 31.5% equity (even if villain has a set). Yes, we will lose most of the time, but we will make a small profit in the long run, making a call correct.
Pot odds aren't just for draws, either. If an opponent bets 50% pot, you get 3 to 1 odds on a call, so you must win 25% of the time to be profitable. If your current hand has more than 25% equity against your opponent's perceived range, call.
Preflop Pot Odds
Preflop, you raise to 3bb and the button 3bets to 9bb. You must decide how to act. In situations like these, we can actually use pot odds to assist our decision-making.
This pot is:
(our open+3bet size+small blind+big blind)
(3bb+9bb+0.5bb+1bb)
= 13.5
This means we must call 6bb to win a pot of 13.5bb, which requires 30.7% equity against the 3bettor's range.
Three additional factors must be considered:
Being out of position on our opponent makes it harder to realize our hand's equity, as he can use his position to put us in tough spots. To profitably continue against villain's hand range, we should add 7% to our equity.
Implied Odds / Reverse Implied Odds: The ability to win or lose significantly more post-flop (than pre-flop) based on our remaining stack.
While statistics on 3bet stats can be gained with a large enough sample size (i.e. 8% 3bet stat from button), the numbers don't tell us which 8% of hands villain could be 3betting with. Both polarized and depolarized charts below show 8% of possible hands.
7.4% of hands are depolarized.
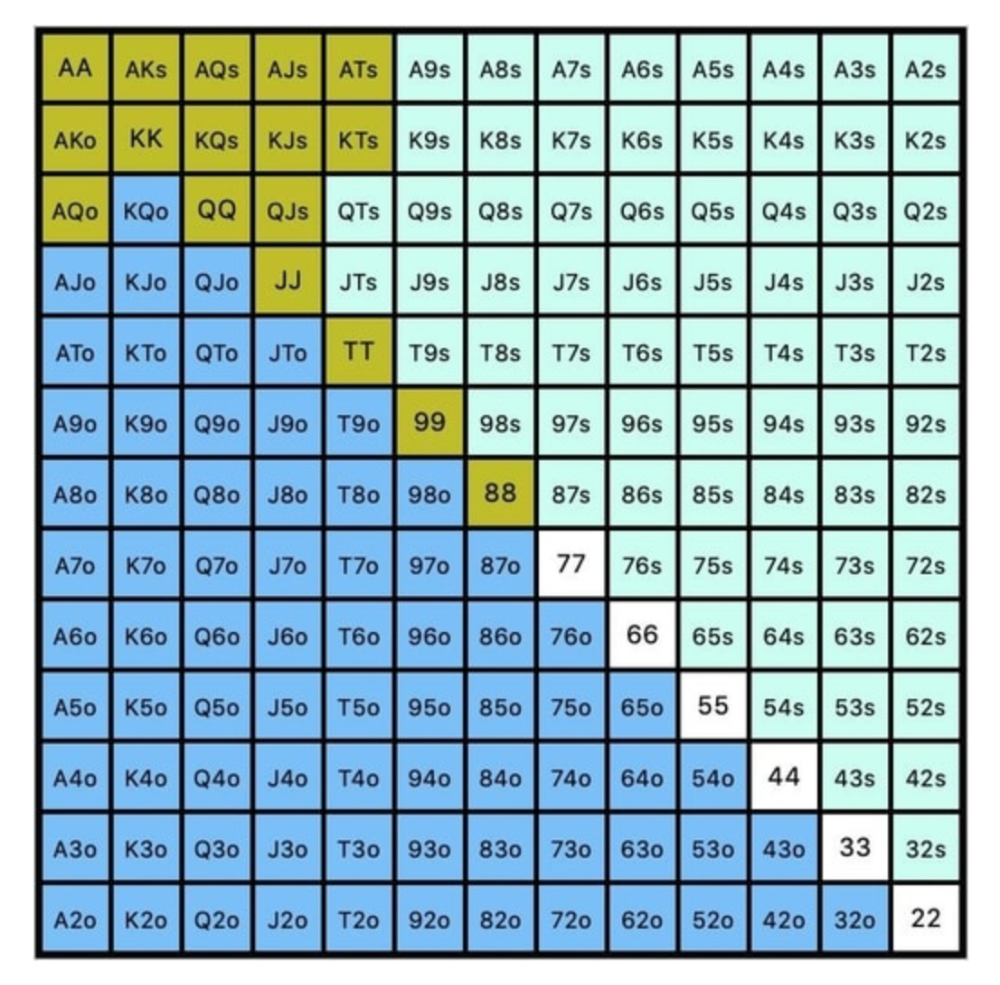
Polarized Hand range (7.54%):
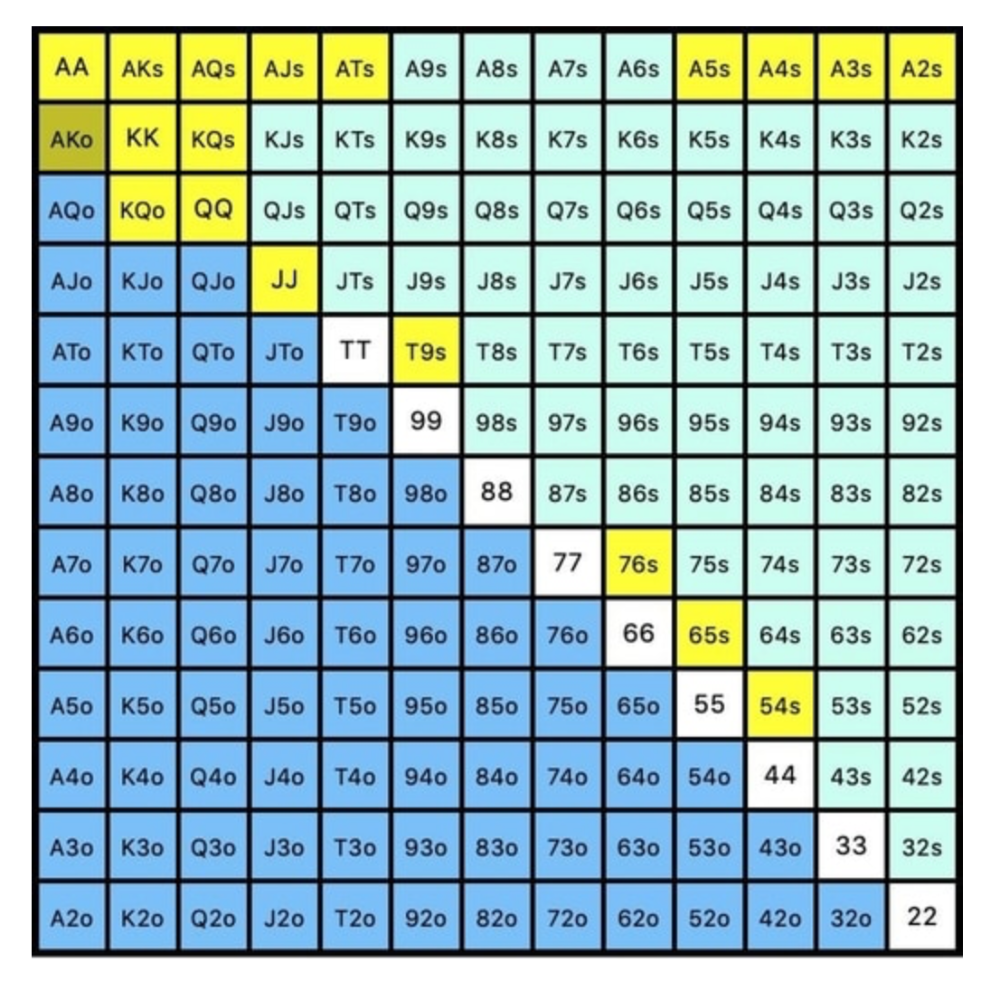
Each hand range has different contents. We don't know if he 3bets some hands and calls or folds others.
Using an exploitable strategy can help you play a hand range correctly. The next GTO concept will make things easier.
3. Minimum Defense Frequency:
This concept refers to the % of our range we must continue with (by calling or raising) to avoid being exploited by our opponents. This concept is most often used off-table and is difficult to apply in-game.
These beginner GTO concepts will help your decision-making during a hand, especially against aggressive opponents.
MDF formula:
MDF = POT SIZE/(POT SIZE+BET SIZE)
Here's a poker GTO chart of common bet sizes and minimum defense frequency.
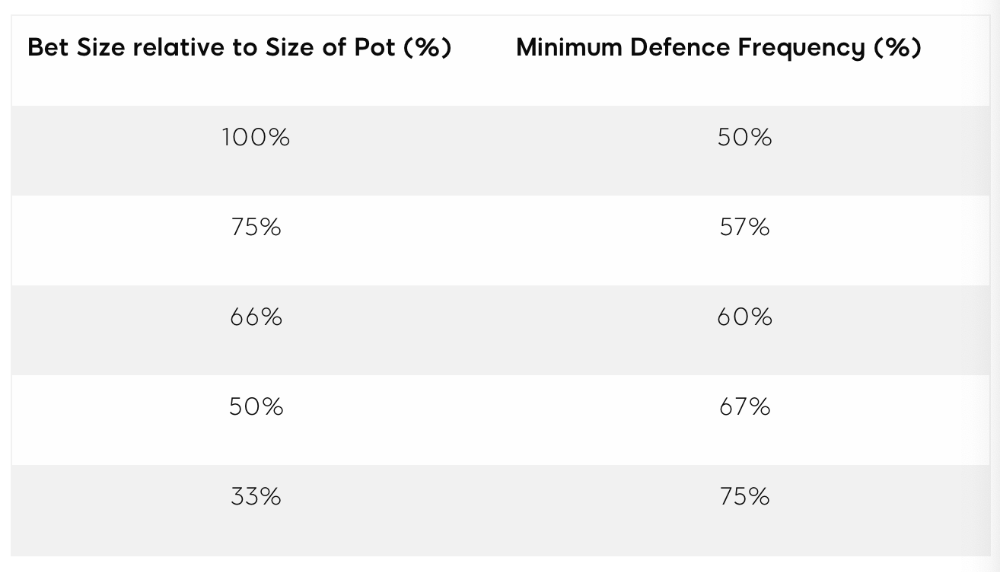
Take the number of hand combos in your starting hand range and use the MDF to determine which hands to continue with. Choose hands with the most playability and equity against your opponent's betting range.
Say you open-raise HJ and BB calls. Qh9h6c flop. Your opponent leads you for a half-pot bet. MDF suggests keeping 67% of our range.
Using the above starting hand chart, we can determine that the HJ opens 254 combos:
We must defend 67% of these hands, or 170 combos, according to MDF. Hands we should keep include:
Flush draws
Open-Ended Straight Draws
Gut-Shot Straight Draws
Overcards
Any Pair or better
So, our flop continuing range could be:
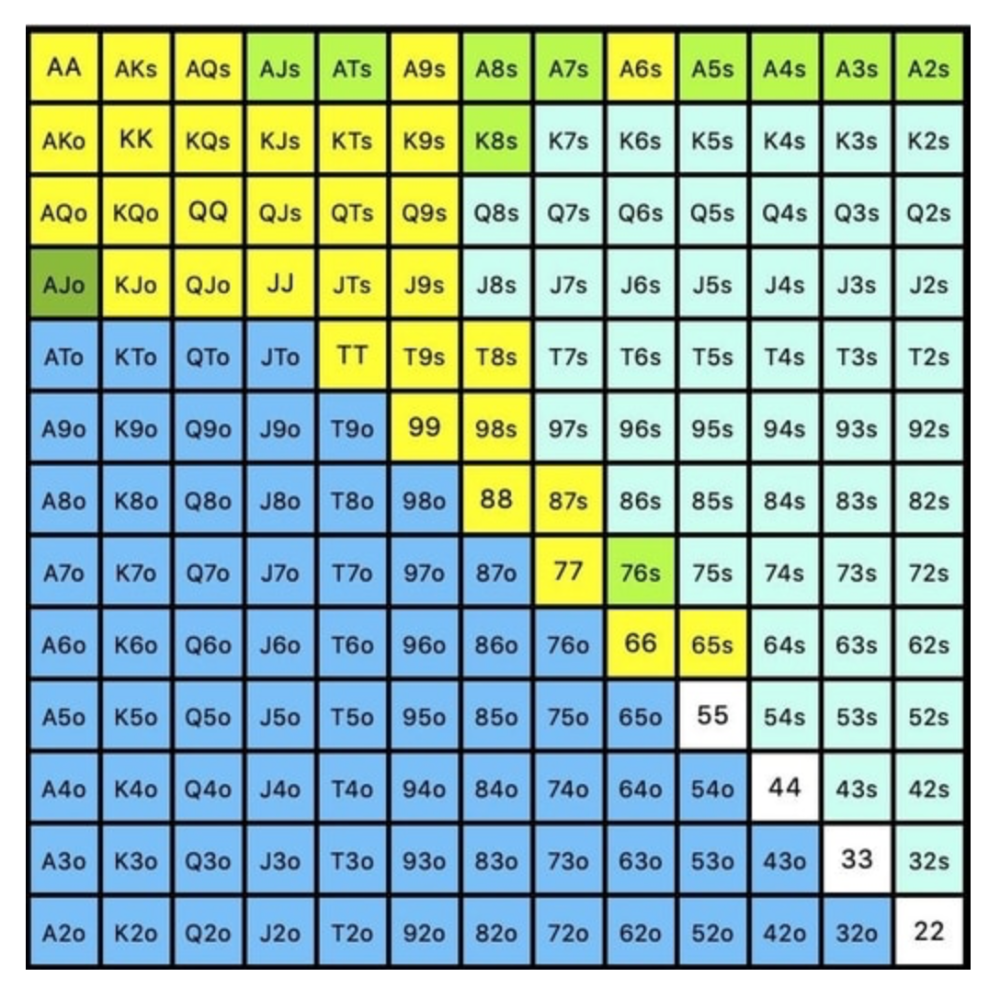
Some highlights:
Fours and fives have little chance of improving on the turn or river.
We only continue with AX hearts (with a flush draw) without a pair or better.
We'll also include 4 AJo combos, all of which have the Ace of hearts, and AcJh, which can block a backdoor nut flush combo.
Let's assume all these hands are called and the turn is blank (2 of spades). Opponent bets full-pot. MDF says we must defend 50% of our flop continuing range, or 85 of 170 combos, to be unexploitable. This strategy includes our best flush draws, straight draws, and made hands.
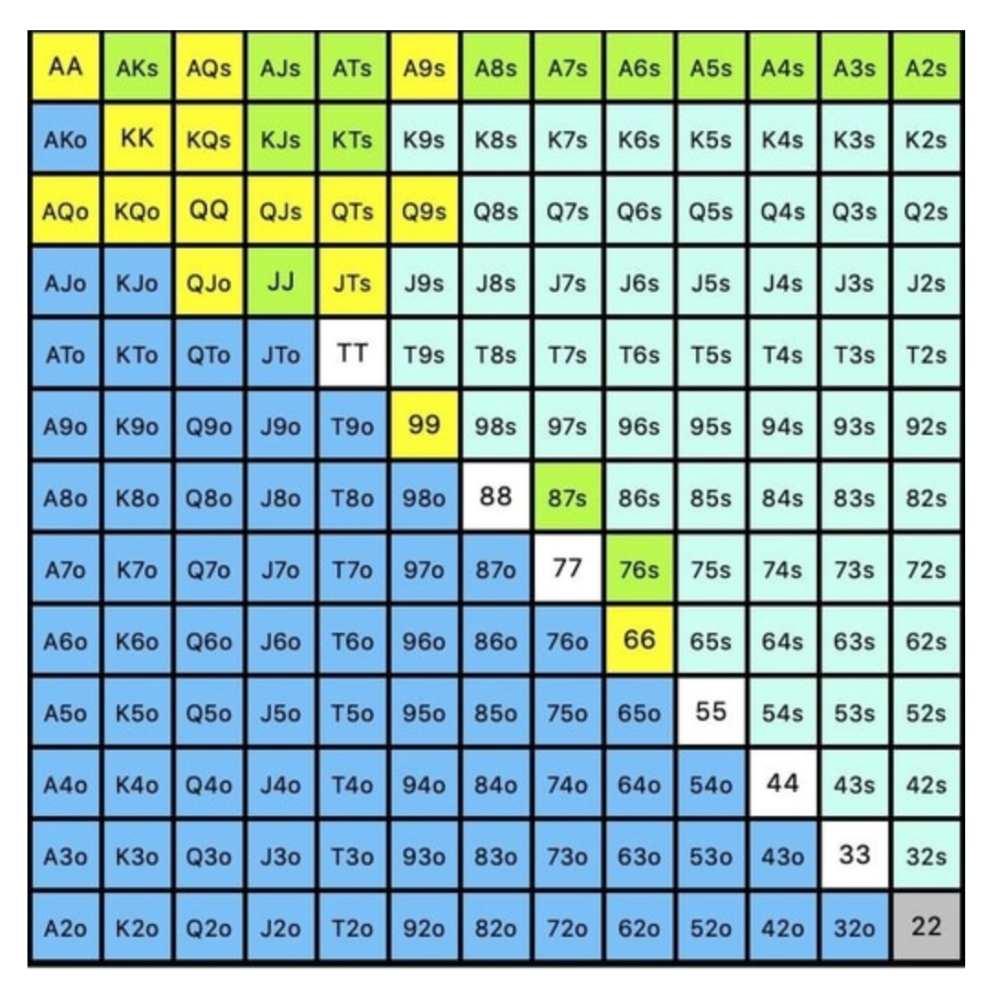
Here, we keep combining:
Nut flush draws
Pair + flush draws
GS + flush draws
Second Pair, Top Kicker+
One combo of JJ that doesn’t block the flush draw or backdoor flush draw.
On the river, we can fold our missed draws and keep our best made hands. When calling with weaker hands, consider blocker effects and card removal to avoid overcalling and decide which combos to continue.
4. Poker GTO Bet Sizing
To avoid being exploited, balance your bluffs and value bets. Your betting range depends on how much you bet (in relation to the pot). This concept only applies on the river, as draws (bluffs) on the flop and turn still have equity (and are therefore total bluffs).
On the flop, you want a 2:1 bluff-to-value-bet ratio. On the flop, there won't be as many made hands as on the river, and your bluffs will usually contain equity. The turn should have a "bluffing" ratio of 1:1. Use the chart below to determine GTO river bluff frequencies (relative to your bet size):
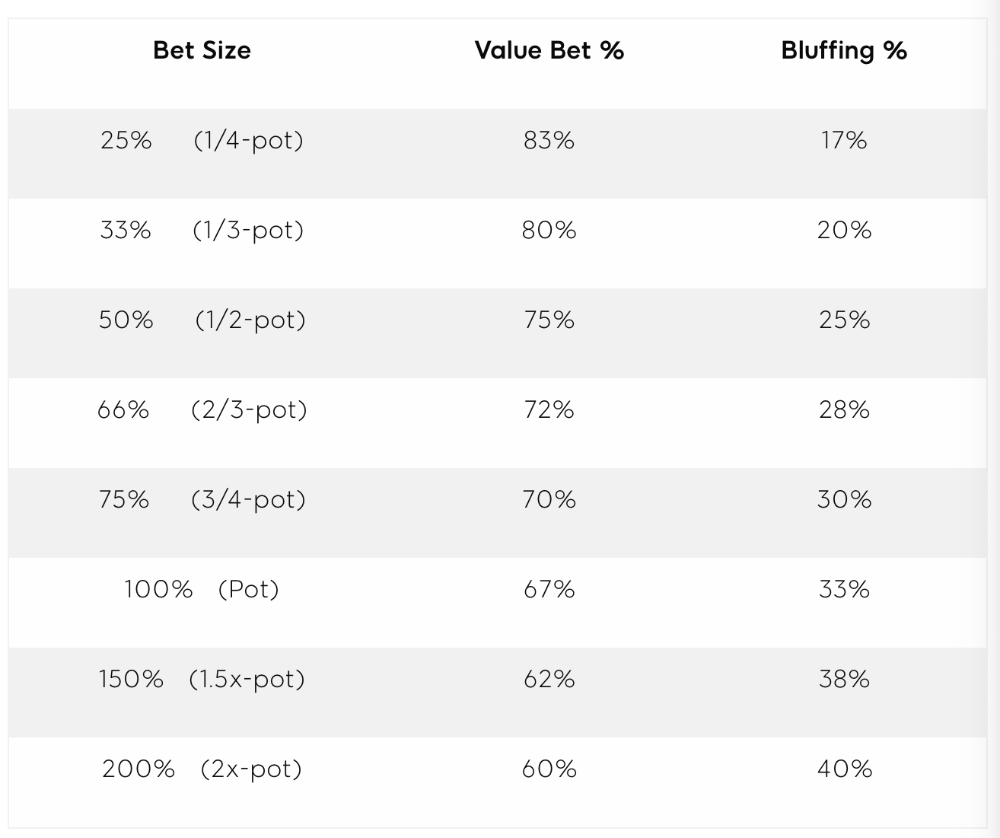
This chart relates to your opponent's pot odds. If you bet 50% pot, your opponent gets 3:1 odds and must win 25% of the time to call. Poker GTO theory suggests including 25% bluff combinations in your betting range so you're indifferent to your opponent calling or folding.
Best river bluffs don't block hands you want your opponent to have (or not have). For example, betting with missed Ace-high flush draws is often a mistake because you block a missed flush draw you want your opponent to have when bluffing on the river (meaning that it would subsequently be less likely he would have it, if you held two of the flush draw cards). Ace-high usually has some river showdown value.
If you had a 3-flush on the river and wanted to raise, you could bluff raise with AX combos holding the bluff suit Ace. Blocking the nut flush prevents your opponent from using that combo.
5. Bet Sizes and Frequency
GTO beginner strategies aren't just bluffs and value bets. They show how often and how much to bet in certain spots. Top players have benefited greatly from poker solvers, which we'll discuss next.
GTO Poker Software
In recent years, various poker GTO solvers have been released to help beginner, intermediate, and advanced players play balanced/GTO poker in various situations.
PokerSnowie and PioSolver are popular GTO and poker study programs.
While you can't compute players' hand ranges and what hands to bet or check with in real time, studying GTO play strategies with these programs will pay off. It will improve your poker thinking and understanding.
Solvers can help you balance ranges, choose optimal bet sizes, and master cbet frequencies.
GTO Poker Tournament
Late-stage tournaments have shorter stacks than cash games. In order to follow GTO poker guidelines, Nash charts have been created, tweaked, and used for many years (and also when to call, depending on what number of big blinds you have when you find yourself shortstacked).
The charts are for heads-up push/fold. In a multi-player game, the "pusher" chart can only be used if play is folded to you in the small blind. The "caller" chart can only be used if you're in the big blind and assumes a small blind "pusher" (with a much wider range than if a player in another position was open-shoving).
Divide the pusher chart's numbers by 2 to see which hand to use from the Button. Divide the original chart numbers by 4 to find the CO's pushing range. Some of the figures will be impossible to calculate accurately for the CO or positions to the right of the blinds because the chart's highest figure is "20+" big blinds, which is also used for a wide range of hands in the push chart.
Both of the GTO charts below are ideal for heads-up play, but exploitable HU shortstack strategies can lead to more +EV decisions against certain opponents. Following the charts will make your play GTO and unexploitable.
Poker pro Max Silver created the GTO push/fold software SnapShove. (It's accessible online at www.snapshove.com or as iOS or Android apps.)
Players can access GTO shove range examples in the full version. (You can customize the number of big blinds you have, your position, the size of the ante, and many other options.)
In Conclusion
Due to the constantly changing poker landscape, players are always improving their skills. Exploitable strategies often yield higher profit margins than GTO-based approaches, but knowing GTO beginner and advanced concepts can give you an edge for a few reasons.
It creates a solid gameplay base.
Having a baseline makes it easier to exploit certain villains.
You can avoid leveling wars with your opponents by making sound poker decisions based on GTO strategy.
It doesn't require assuming opponents' play styles.
Not results-oriented.
This is just the beginning of GTO and poker theory. Consider investing in the GTO poker solver software listed above to improve your game.

Ash Parrish
4 years ago
Sonic Prime and indie games on Netflix
Netflix will stream Spiritfarer, Raji: An Ancient Epic, and Lucky Luna.
Netflix's Geeked Week brought a slew of announcements. The flurry of reveals for The Sandman, The Umbrella Academy season 3, One Piece, and more also included game and game-adjacent announcements.
Netflix released a teaser for Cuphead season 2 ahead of its August premiere, featuring more of Grey DeLisle's Ms. Chalice. DOTA: Dragon's Blood season 3 hits Netflix in August. Tekken, the fighting game that throws kids off cliffs, gets an anime, Tekken: Bloodline.
Netflix debuted a clip of Sonic Prime before Sonic Origins in June and Sonic Frontiers in 2022.
Castlevania: Nocturne will follow Richter Belmont.
Netflix is reviving licensed games with titles based on its shows. There's a Queen's Gambit chess game, a Shadow and Bone RPG, a La Casa de Papel heist adventure, and a Too Hot to Handle game where a pregnant woman must choose between stabbing her cheating ex or forgiving him.
Riot's rhythm platformer Hextech Mayhem debuted on Netflix last year, and now Netflix is adding games from Devolver Digital. Reigns: Three Kingdoms is a card game that lets players choose the fate of Three Kingdoms-era China by swiping left or right on cards. Spiritfarer, the "cozy game about death" from 2020, and Raji: An Ancient Epic are coming to Netflix. Poinpy, a vertical climber from the creator of Downwell, is now on Netflix.
Desta: The Memories Between is a turn-based strategy game set in dreams and memories.
Snowman's Lucky Luna will also be added soon.
With these games, Netflix is expanding beyond dinky mobile games — it plans to have 50 by the end of the year — and could be a serious platform for indies that want to expand into mobile. It takes gaming seriously.
You might also like

Amelia Winger-Bearskin
3 years ago
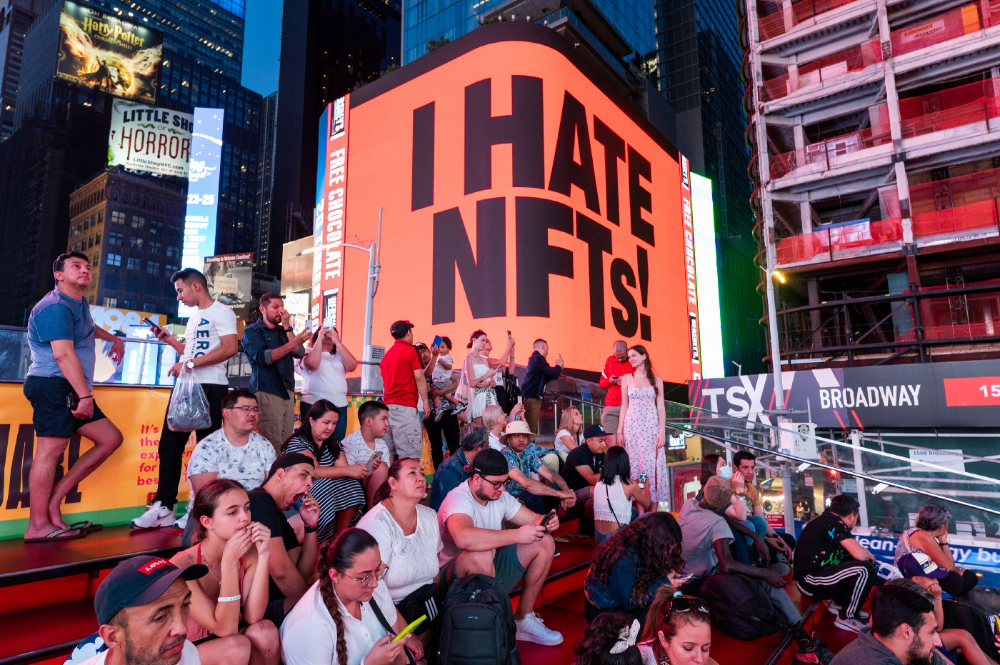
Hate NFTs? I must break some awful news to you...
If you think NFTs are awful, check out the art market.
The fervor around NFTs has subsided in recent months due to the crypto market crash and the media's short attention span. They were all anyone could talk about earlier this spring. Last semester, when passions were high and field luminaries were discussing "slurp juices," I asked my students and students from over 20 other universities what they thought of NFTs.
According to many, NFTs were either tasteless pyramid schemes or a new way for artists to make money. NFTs contributed to the climate crisis and harmed the environment, but so did air travel, fast fashion, and smartphones. Some students complained that NFTs were cheap, tasteless, algorithmically generated schlock, but others asked how this was different from other art.
I'm not sure what I expected, but the intensity of students' reactions surprised me. They had strong, emotional opinions about a technology I'd always considered administrative. NFTs address ownership and accounting, like most crypto/blockchain projects.
Art markets can be irrational, arbitrary, and subject to the same scams and schemes as any market. And maybe a few shenanigans that are unique to the art world.
The Fairness Question
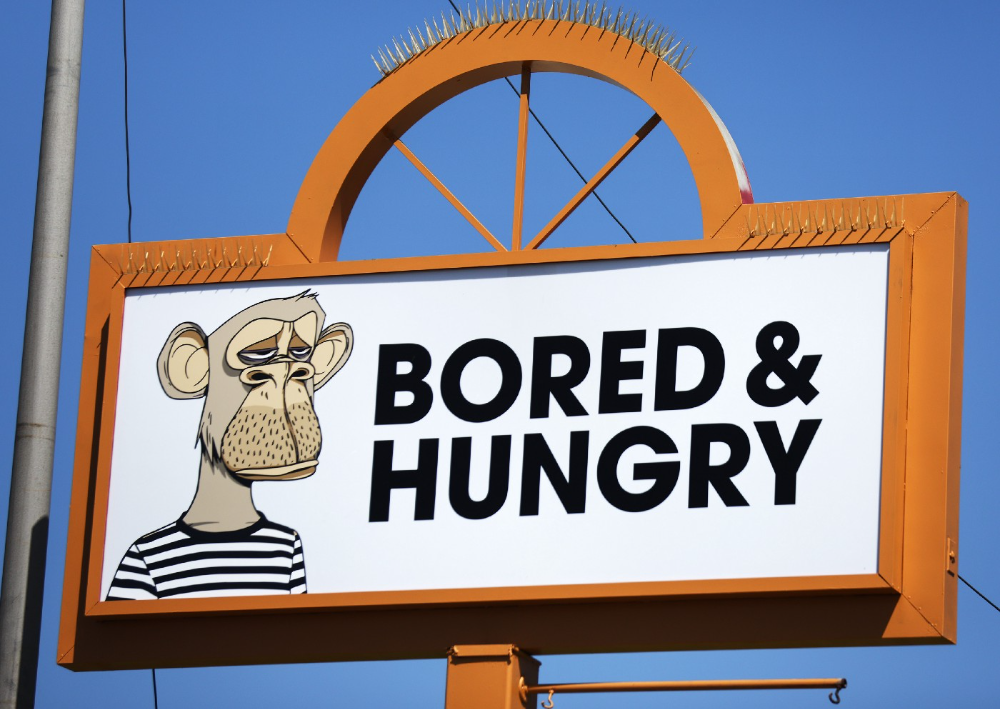
Fairness, a deflating moral currency, was the general sentiment (the less of it in circulation, the more ardently we clamor for it.) These students, almost all of whom are artists, complained to the mismatch between the quality of the work in some notable NFT collections and the excessive amounts these items were fetching on the market. They can sketch a Bored Ape or Lazy Lion in their sleep. Why should they buy ramen with school loans while certain swindlers get rich?
I understand students. Art markets are unjust. They can be irrational, arbitrary, and governed by chance and circumstance, like any market. And art-world shenanigans.
Almost every mainstream critique leveled against NFTs applies just as easily to art markets
Over 50% of artworks in circulation are fake, say experts. Sincere art collectors and institutions are upset by the prevalence of fake goods on the market. Not everyone. Wealthy people and companies use art as investments. They can use cultural institutions like museums and galleries to increase the value of inherited art collections. People sometimes buy artworks and use family ties or connections to museums or other cultural taste-makers to hype the work in their collection, driving up the price and allowing them to sell for a profit. Money launderers can disguise capital flows by using market whims, hype, and fluctuating asset prices.
Almost every mainstream critique leveled against NFTs applies just as easily to art markets.
Art has always been this way. Edward Kienholz's 1989 print series satirized art markets. He stamped 395 identical pieces of paper from $1 to $395. Each piece was initially priced as indicated. Kienholz was joking about a strange feature of art markets: once the last print in a series sells for $395, all previous works are worth at least that much. The entire series is valued at its highest auction price. I don't know what a Kienholz print sells for today (inquire with the gallery), but it's more than $395.
I love Lee Lozano's 1969 "Real Money Piece." Lozano put cash in various denominations in a jar in her apartment and gave it to visitors. She wrote, "Offer guests coffee, diet pepsi, bourbon, half-and-half, ice water, grass, and money." "Offer real money as candy."
Lee Lozano kept track of who she gave money to, how much they took, if any, and how they reacted to the offer of free money without explanation. Diverse reactions. Some found it funny, others found it strange, and others didn't care. Lozano rarely says:
Apr 17 Keith Sonnier refused, later screws lid very tightly back on. Apr 27 Kaltenbach takes all the money out of the jar when I offer it, examines all the money & puts it all back in jar. Says he doesn’t need money now. Apr 28 David Parson refused, laughing. May 1 Warren C. Ingersoll refused. He got very upset about my “attitude towards money.” May 4 Keith Sonnier refused, but said he would take money if he needed it which he might in the near future. May 7 Dick Anderson barely glances at the money when I stick it under his nose and says “Oh no thanks, I intend to earn it on my own.” May 8 Billy Bryant Copley didn’t take any but then it was sort of spoiled because I had told him about this piece on the phone & he had time to think about it he said.
Smart Contracts (smart as in fair, not smart as in Blockchain)
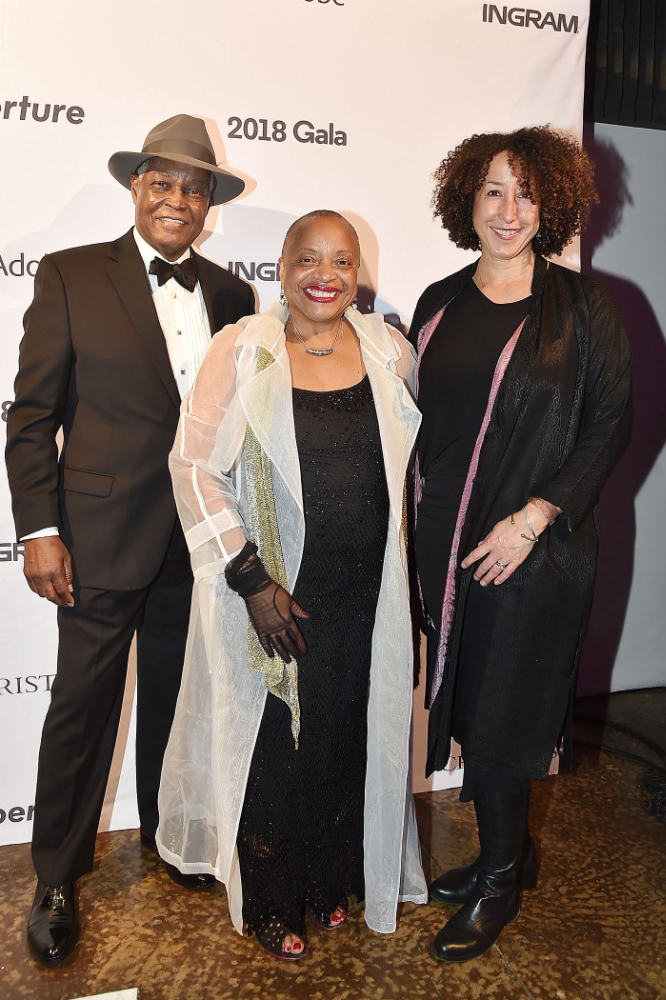
Cornell University's Cheryl Finley has done a lot of research on secondary art markets. I first learned about her research when I met her at the University of Florida's Harn Museum, where she spoke about smart contracts (smart as in fair, not smart as in Blockchain) and new protocols that could help artists who are often left out of the economic benefits of their own work, including women and women of color.
Her talk included findings from her ArtNet op-ed with Lauren van Haaften-Schick, Christian Reeder, and Amy Whitaker.
NFTs allow us to think about and hack on formal contractual relationships outside a system of laws that is currently not set up to service our community.
The ArtNet article The Recent Sale of Amy Sherald's ‘Welfare Queen' Symbolizes the Urgent Need for Resale Royalties and Economic Equity for Artists discussed Sherald's 2012 portrait of a regal woman in a purple dress wearing a sparkling crown and elegant set of pearls against a vibrant red background.
Amy Sherald sold "Welfare Queen" to Princeton professor Imani Perry. Sherald agreed to a payment plan to accommodate Perry's budget.
Amy Sherald rose to fame for her 2016 portrait of Michelle Obama and her full-length portrait of Breonna Taylor, one of the most famous works of the past decade.
As is common, Sherald's rising star drove up the price of her earlier works. Perry's "Welfare Queen" sold for $3.9 million in 2021.
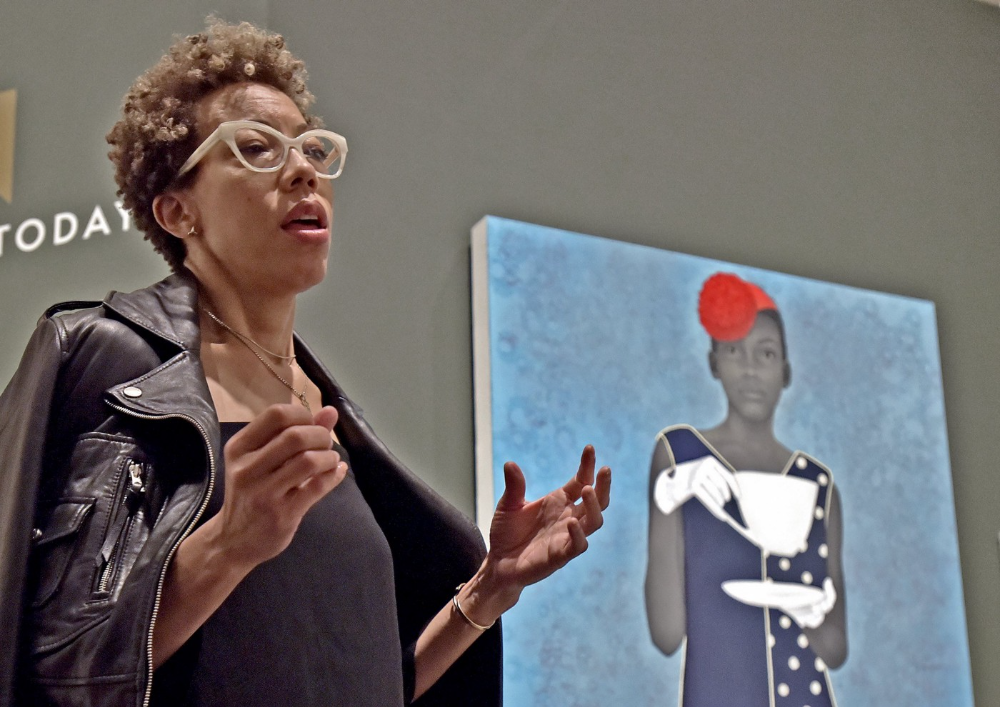
Imani Perry's early investment paid off big-time. Amy Sherald, whose work directly increased the painting's value and who was on an artist's shoestring budget when she agreed to sell "Welfare Queen" in 2012, did not see any of the 2021 auction money. Perry and the auction house got that money.
Sherald sold her Breonna Taylor portrait to the Smithsonian and Louisville's Speed Art Museum to fund a $1 million scholarship. This is a great example of what an artist can do for the community if they can amass wealth through their work.
NFTs haven't solved all of the art market's problems — fakes, money laundering, market manipulation — but they didn't create them. Blockchain and NFTs are credited with making these issues more transparent. More ideas emerge daily about what a smart contract should do for artists.
NFTs are a copyright solution. They allow us to hack formal contractual relationships outside a law system that doesn't serve our community.
Amy Sherald shows the good smart contracts can do (as in, well-considered, self-determined contracts, not necessarily blockchain contracts.) Giving back to our community, deciding where and how our work can be sold or displayed, and ensuring artists share in the equity of our work and the economy our labor creates.

Bastian Hasslinger
3 years ago
Before 2021, most startups had excessive valuations. It is currently causing issues.
Higher startup valuations are often favorable for all parties. High valuations show a business's potential. New customers and talent are attracted. They earn respect.
Everyone benefits if a company's valuation rises.
Founders and investors have always been incentivized to overestimate a company's value.
Post-money valuations were inflated by 2021 market expectations and the valuation model's mechanisms.
Founders must understand both levers to handle a normalizing market.
2021, the year of miracles
2021 must've seemed miraculous to entrepreneurs, employees, and VCs. Valuations rose, and funding resumed after the first Covid-19 epidemic caution.
In 2021, VC investments increased from $335B to $643B. 518 new worldwide unicorns vs. 134 in 2020; 951 US IPOs vs. 431.
Things can change quickly, as 2020-21 showed.
Rising interest rates, geopolitical developments, and normalizing technology conditions drive down share prices and tech company market caps in 2022. Zoom, the poster-child of early lockdown success, is down 37% since 1st Jan.
Once-inflated valuations can become a problem in a normalizing market, especially for founders, employees, and early investors.
the reason why startups are always overvalued
To see why inflated valuations are a problem, consider one of its causes.
Private company values only fluctuate following a new investment round, unlike publicly-traded corporations. The startup's new value is calculated simply:
(Latest round share price) x (total number of company shares)
This is the industry standard Post-Money Valuation model.
Let’s illustrate how it works with an example. If a VC invests $10M for 1M shares (at $10/share), and the company has 10M shares after the round, its Post-Money Valuation is $100M (10/share x 10M shares).
This approach might seem like the most natural way to assess a business, but the model often unintentionally overstates the underlying value of the company even if the share price paid by the investor is fair. All shares aren't equal.
New investors in a corporation will always try to minimize their downside risk, or the amount they lose if things go wrong. New investors will try to negotiate better terms and pay a premium.
How the value of a struggling SpaceX increased
SpaceX's 2008 Series D is an example. Despite the financial crisis and unsuccessful rocket launches, the company's Post-Money Valuation was 36% higher after the investment round. Why?
Series D SpaceX shares were protected. In case of liquidation, Series D investors were guaranteed a 2x return before other shareholders.
Due to downside protection, investors were willing to pay a higher price for this new share class.
The Post-Money Valuation model overpriced SpaceX because it viewed all the shares as equal (they weren't).
Why entrepreneurs, workers, and early investors stand to lose the most
Post-Money Valuation is an effective and sufficient method for assessing a startup's valuation, despite not taking share class disparities into consideration.
In a robust market, where the firm valuation will certainly expand with the next fundraising round or exit, the inflated value is of little significance.
Fairness endures. If a corporation leaves at a greater valuation, each stakeholder will receive a proportional distribution. (i.e., 5% of a $100M corporation yields $5M).
SpaceX's inherent overvaluation was never a problem. Had it been sold for less than its Post-Money Valuation, some shareholders, including founders, staff, and early investors, would have seen their ownership drop.
The unforgiving world of 2022
In 2022, founders, employees, and investors who benefited from inflated values will face below-valuation exits and down-rounds.
For them, 2021 will be a curse, not a blessing.
Some tech giants are worried. Klarna's valuation fell from $45B (Oct 21) to $30B (Jun 22), Canvas from $40B to $27B, and GoPuffs from $17B to $8.3B.
Shazam and Blue Apron have to exit or IPO at a cheaper price. Premium share classes are protected, while others receive less. The same goes for bankrupts.
Those who continue at lower valuations will lose reputation and talent. When their value declines by half, generous employee stock options become less enticing, and their ability to return anything is questioned.
What can we infer about the present situation?
Such techniques to enhance your company's value or stop a normalizing market are fiction.
The current situation is a painful reminder for entrepreneurs and a crucial lesson for future firms.
The devastating market fall of the previous six months has taught us one thing:
Keep in mind that any valuation is speculative. Money Post A startup's valuation is a highly simplified approximation of its true value, particularly in the early phases when it lacks significant income or a cutting-edge product. It is merely a projection of the future and a hypothetical meter. Until it is achieved by an exit, a valuation is nothing more than a number on paper.
Assume the value of your company is lower than it was in the past. Your previous valuation might not be accurate now due to substantial changes in the startup financing markets. There is little reason to think that your company's value will remain the same given the 50%+ decline in many newly listed IT companies. Recognize how the market situation is changing and use caution.
Recognize the importance of the stake you hold. Each share class has a unique value that varies. Know the sort of share class you own and how additional contractual provisions affect the market value of your security. Frameworks have been provided by Metrick and Yasuda (Yale & UC) and Gornall and Strebulaev (Stanford) for comprehending the terms that affect investors' cash-flow rights upon withdrawal. As a result, you will be able to more accurately evaluate your firm and determine the worth of each share class.
Be wary of approving excessively protective share terms.
The trade-offs should be considered while negotiating subsequent rounds. Accepting punitive contractual terms could first seem like a smart option in order to uphold your inflated worth, but you should proceed with caution. Such provisions ALWAYS result in misaligned shareholders, with common shareholders (such as you and your staff) at the bottom of the list.
Benjamin Lin
3 years ago
I sold my side project for $20,000: 6 lessons I learned
How I monetized and sold an abandoned side project for $20,000
The Origin Story
I've always wanted to be an entrepreneur but never succeeded. I often had business ideas, made a landing page, and told my buddies. Never got customers.
In April 2021, I decided to try again with a new strategy. I noticed that I had trouble acquiring an initial set of customers, so I wanted to start by acquiring a product that had a small user base that I could grow.
I found a SaaS marketplace called MicroAcquire.com where you could buy and sell SaaS products. I liked Shareit.video, an online Loom-like screen recorder.
Shareit.video didn't generate revenue, but 50 people visited daily to record screencasts.
Purchasing a Failed Side Project
I eventually bought Shareit.video for $12,000 from its owner.
$12,000 was probably too much for a website without revenue or registered users.
I thought time was most important. I could have recreated the website, but it would take months. $12,000 would give me an organized code base and a working product with a few users to monetize.
I considered buying a screen recording website and trying to grow it versus buying a new car or investing in crypto with the $12K.
Buying the website would make me a real entrepreneur, which I wanted more than anything.
Putting down so much money would force me to commit to the project and prevent me from quitting too soon.
A Year of Development
I rebranded the website to be called RecordJoy and worked on it with my cousin for about a year. Within a year, we made $5000 and had 3000 users.
We spent $3500 on ads, hosting, and software to run the business.
AppSumo promoted our $120 Life Time Deal in exchange for 30% of the revenue.
We put RecordJoy on maintenance mode after 6 months because we couldn't find a scalable user acquisition channel.
We improved SEO and redesigned our landing page, but nothing worked.

Despite not being able to grow RecordJoy any further, I had already learned so much from working on the project so I was fine with putting it on maintenance mode. RecordJoy still made $500 a month, which was great lunch money.
Getting Taken Over
One of our customers emailed me asking for some feature requests and I replied that we weren’t going to add any more features in the near future. They asked if we'd sell.
We got on a call with the customer and I asked if he would be interested in buying RecordJoy for 15k. The customer wanted around $8k but would consider it.
Since we were negotiating with one buyer, we put RecordJoy on MicroAcquire to see if there were other offers.
We quickly received 10+ offers. We got 18.5k. There was also about $1000 in AppSumo that we could not withdraw, so we agreed to transfer that over for $600 since about 40% of our sales on AppSumo usually end up being refunded.
Lessons Learned
First, create an acquisition channel
We couldn't discover a scalable acquisition route for RecordJoy. If I had to start another project, I'd develop a robust acquisition channel first. It might be LinkedIn, Medium, or YouTube.
Purchase Power of the Buyer Affects Acquisition Price
Some of the buyers we spoke to were individuals looking to buy side projects, as well as companies looking to launch a new product category. Individual buyers had less budgets than organizations.
Customers of AppSumo vary.
AppSumo customers value lifetime deals and low prices, which may not be a good way to build a business with recurring revenue. Designed for AppSumo users, your product may not connect with other users.
Try to increase acquisition trust
Acquisition often fails. The buyer can go cold feet, cease communicating, or run away with your stuff. Trusting the buyer ensures a smooth asset exchange. First acquisition meeting was unpleasant and price negotiation was tight. In later meetings, we spent the first few minutes trying to get to know the buyer’s motivations and background before jumping into the negotiation, which helped build trust.
Operating expenses can reduce your earnings.
Monitor operating costs. We were really happy when we withdrew the $5000 we made from AppSumo and Stripe until we realized that we had spent $3500 in operating fees. Spend money on software and consultants to help you understand what to build.
Don't overspend on advertising
We invested $1500 on Google Ads but made little money. For a side project, it’s better to focus on organic traffic from SEO rather than paid ads unless you know your ads are going to have a positive ROI.