


More on Entrepreneurship/Creators

DC Palter
3 years ago
How Will You Generate $100 Million in Revenue? The Startup Business Plan
A top-down company plan facilitates decision-making and impresses investors.

A startup business plan starts with the product, the target customers, how to reach them, and how to grow the business.
Bottom-up is terrific unless venture investors fund it.
If it can prove how it can exceed $100M in sales, investors will invest. If not, the business may be wonderful, but it's not venture capital-investable.
As a rule, venture investors only fund firms that expect to reach $100M within 5 years.
Investors get nothing until an acquisition or IPO. To make up for 90% of failed investments and still generate 20% annual returns, portfolio successes must exit with a 25x return. A $20M-valued company must be acquired for $500M or more.
This requires $100M in sales (or being on a nearly vertical trajectory to get there). The company has 5 years to attain that milestone and create the requisite ROI.
This motivates venture investors (venture funds and angel investors) to hunt for $100M firms within 5 years. When you pitch investors, you outline how you'll achieve that aim.
I'm wary of pitches after seeing a million hockey sticks predicting $5M to $100M in year 5 that never materialized. Doubtful.
Startups fail because they don't have enough clients, not because they don't produce a great product. That jump from $5M to $100M never happens. The company reaches $5M or $10M, growing at 10% or 20% per year. That's great, but not enough for a $500 million deal.
Once it becomes clear the company won’t reach orbit, investors write it off as a loss. When a corporation runs out of money, it's shut down or sold in a fire sale. The company can survive if expenses are trimmed to match revenues, but investors lose everything.
When I hear a pitch, I'm not looking for bright income projections but a viable plan to achieve them. Answer these questions in your pitch.
Is the market size sufficient to generate $100 million in revenue?
Will the initial beachhead market serve as a springboard to the larger market or as quicksand that hinders progress?
What marketing plan will bring in $100 million in revenue? Is the market diffuse and will cost millions of dollars in advertising, or is it one, focused market that can be tackled with a team of salespeople?
Will the business be able to bridge the gap from a small but fervent set of early adopters to a larger user base and avoid lock-in with their current solution?
Will the team be able to manage a $100 million company with hundreds of people, or will hypergrowth force the organization to collapse into chaos?
Once the company starts stealing market share from the industry giants, how will it deter copycats?
The requirement to reach $100M may be onerous, but it provides a context for difficult decisions: What should the product be? Where should we concentrate? who should we hire? Every strategic choice must consider how to reach $100M in 5 years.
Focusing on $100M streamlines investor pitches. Instead of explaining everything, focus on how you'll attain $100M.
As an investor, I know I'll lose my money if the startup doesn't reach this milestone, so the revenue prediction is the first thing I look at in a pitch deck.
Reaching the $100M goal needs to be the first thing the entrepreneur thinks about when putting together the business plan, the central story of the pitch, and the criteria for every important decision the company makes.

SAHIL SAPRU
3 years ago
Growth tactics that grew businesses from 1 to 100

Everyone wants a scalable startup.
Innovation helps launch a startup. The secret to a scalable business is growth trials (from 1 to 100).
Growth marketing combines marketing and product development for long-term growth.
Today, I'll explain growth hacking strategies popular startups used to scale.
1/ A Facebook user's social value is proportional to their friends.
Facebook built its user base using content marketing and paid ads. Mark and his investors feared in 2007 when Facebook's growth stalled at 90 million users.
Chamath Palihapitiya was brought in by Mark.
The team tested SEO keywords and MAU chasing. The growth team introduced “people you may know”
This feature reunited long-lost friends and family. Casual users became power users as the retention curve flattened.
Growth Hack Insights: With social network effect the value of your product or platform increases exponentially if you have users you know or can relate with.

2/ Airbnb - Focus on your value propositions
Airbnb nearly failed in 2009. The company's weekly revenue was $200 and they had less than 2 months of runway.
Enter Paul Graham. The team noticed a pattern in 40 listings. Their website's property photos sucked.
Why?
Because these photos were taken with regular smartphones. Users didn't like the first impression.
Graham suggested traveling to New York to rent a camera, meet with property owners, and replace amateur photos with high-resolution ones.
A week later, the team's weekly revenue doubled to $400, indicating they were on track.
Growth Hack Insights: When selling an “online experience” ensure that your value proposition is aesthetic enough for users to enjoy being associated with them.

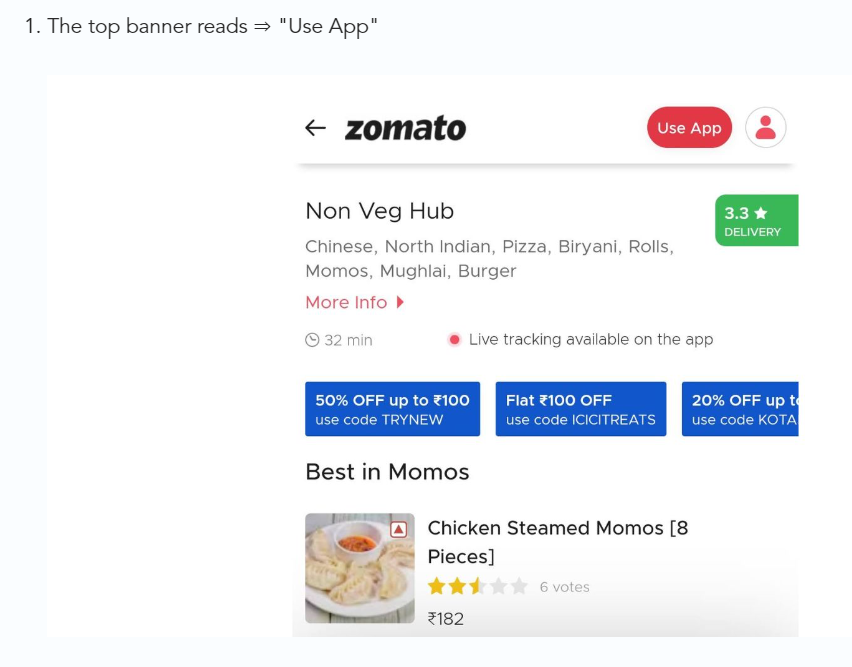
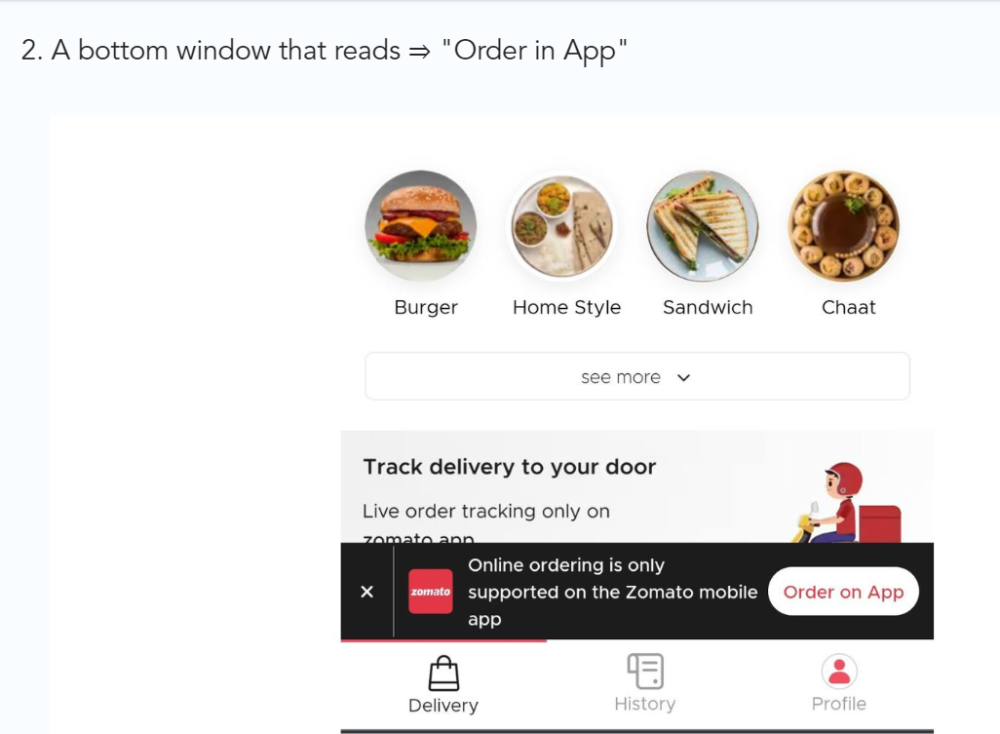
3/ Zomato - A company's smartphone push ensured growth.
Zomato delivers food. User retention was a challenge for the founders. Indian food customers are notorious for switching brands at the drop of a hat.
Zomato wanted users to order food online and repeat orders throughout the week.
Zomato created an attractive website with “near me” keywords for SEO indexing.
Zomato gambled to increase repeat orders. They only allowed mobile app food orders.
Zomato thought mobile apps were stickier. Product innovations in search/discovery/ordering or marketing campaigns like discounts/in-app notifications/nudges can improve user experience.
Zomato went public in 2021 after users kept ordering food online.
Growth Hack Insights: To improve user retention try to build platforms that build user stickiness. Your product and marketing team will do the rest for them.
4/ Hotmail - Signaling helps build premium users.
Ever sent or received an email or tweet with a sign — sent from iPhone?
Hotmail did it first! One investor suggested Hotmail add a signature to every email.
Overnight, thousands joined the company. Six months later, the company had 1 million users.
When serving an existing customer, improve their social standing. Signaling keeps the top 1%.
5/ Dropbox - Respect loyal customers
Dropbox is a company that puts people over profits. The company prioritized existing users.
Dropbox rewarded loyal users by offering 250 MB of free storage to anyone who referred a friend. The referral hack helped Dropbox get millions of downloads in its first few months.
Growth Hack Insights: Think of ways to improve the social positioning of your end-user when you are serving an existing customer. Signaling goes a long way in attracting the top 1% to stay.

These experiments weren’t hacks. Hundreds of failed experiments and user research drove these experiments. Scaling up experiments is difficult.
Contact me if you want to grow your startup's user base.

Stephen Moore
3 years ago
Adam Neumanns is working to create the future of living in a classic example of a guy failing upward.
The comeback tour continues…
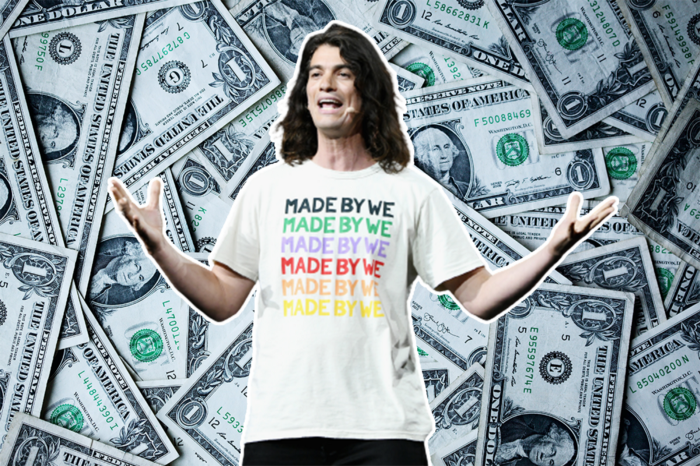
First, he founded a $47 billion co-working company (sorry, a “tech company”).
He established WeLive to disrupt apartment life.
Then he created WeGrow, a school that tossed aside the usual curriculum to feed children's souls and release their potential.
He raised the world’s consciousness.
Then he blew it all up (without raising the world’s consciousness). (He bought a wave pool.)
Adam Neumann's WeWork business burned investors' money. The founder sailed off with unimaginable riches, leaving long-time employees with worthless stocks and the company bleeding money. His track record, which includes a failing baby clothing company, should have stopped investors cold.
Once the dust settled, folks went on. We forgot about the Neumanns! We forgot about the private jets, company retreats, many houses, and WeWork's crippling. In that moment, the prodigal son of entrepreneurship returned, choosing the blockchain as his industry. His homecoming tour began with Flowcarbon, which sold Goddess Nature Tokens to lessen companies' carbon footprints.
Did it work?
Of course not.
Despite receiving $70 million from Andreessen Horowitz's a16z, the project has been halted just two months after its announcement.
This triumph should lower his grade.
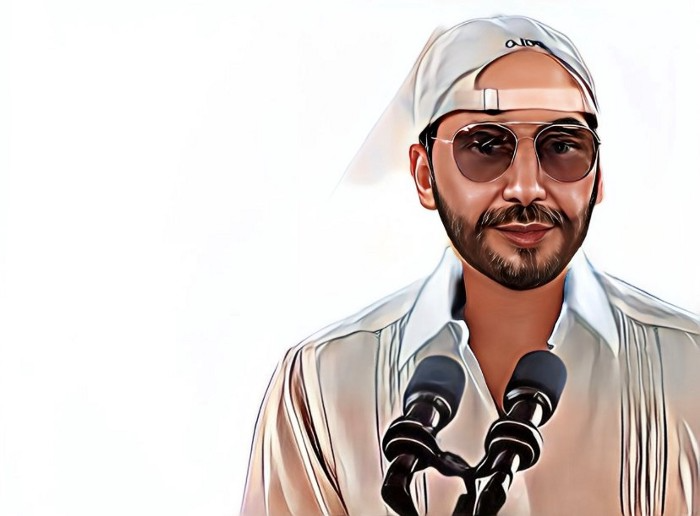
Neumann seems to have moved on and has another revolutionary idea for the future of living. Flow (not Flowcarbon) aims to help people live in flow and will launch in 2023. It's the classic Neumann pitch: lofty goals, yogababble, and charisma to attract investors.
It's a winning formula for one investment fund. a16z has backed the project with its largest single check, $350 million. It has a splash page and 3,000 rental units, but is valued at over $1 billion. The blog post praised Neumann for reimagining the office and leading a paradigm-shifting global company.

Flow's mission is to solve the nation's housing crisis. How? Idk. It involves offering community-centric services in apartment properties to the same remote workforce he once wooed with free beer and a pingpong table. Revolutionary! It seems the goal is to apply WeWork's goals of transforming physical spaces and building community to apartments to solve many of today's housing problems.
The elevator pitch probably sounded great.
At least a16z knows it's a near-impossible task, calling it a seismic shift. Marc Andreessen opposes affordable housing in his wealthy Silicon Valley town. As details of the project emerge, more investors will likely throw ethics and morals out the window to go with the flow, throwing money at a man known for burning through it while building toxic companies, hoping he can bank another fantasy valuation before it all crashes.
Insanity is repeating the same action and expecting a different result. Everyone on the Neumann hype train needs to sober up.
Like WeWork, this venture Won’tWork.
Like before, it'll cause a shitstorm.
You might also like

Jared A. Brock
3 years ago
Here is the actual reason why Russia invaded Ukraine
Democracy's demise
Our Ukrainian brothers and sisters are being attacked by a far superior force.
It's the biggest invasion since WWII.
43.3 million peaceful Ukrainians awoke this morning to tanks, mortars, and missiles. Russia is already 15 miles away.
America and the West will not deploy troops.
They're sanctioning. Except railways. And luxuries. And energy. Diamonds. Their dependence on Russian energy exports means they won't even cut Russia off from SWIFT.
Ukraine is desperate enough to hand out guns on the street.
France, Austria, Turkey, and the EU are considering military aid, but Ukraine will fall without America or NATO.
The Russian goal is likely to encircle Kyiv and topple Zelenskyy's government. A proxy power will be reinstated once Russia has total control.
“Western security services believe Putin intends to overthrow the government and install a puppet regime,” says Financial Times foreign affairs commentator Gideon Rachman. This “decapitation” strategy includes municipalities. Ukrainian officials are being targeted for arrest or death.”
Also, Putin has never lost a war.
Why is Russia attacking Ukraine?
Putin, like a snowflake college student, “feels unsafe.”
Why?
Because Ukraine is full of “Nazi ideas.”
Putin claims he has felt threatened by Ukraine since the country's pro-Putin leader was ousted and replaced by a popular Jewish comedian.
Hee hee
He fears a full-scale enemy on his doorstep if Ukraine joins NATO. But he refuses to see it both ways. NATO has never invaded Russia, but Russia has always stolen land from its neighbors. Can you blame them for joining a mutual defense alliance when a real threat exists?
Nations that feel threatened can join NATO. That doesn't justify an attack by Russia. It allows them to defend themselves. But NATO isn't attacking Moscow. They aren't.
Russian President Putin's "special operation" aims to de-Nazify the Jewish-led nation.
To keep Crimea and the other two regions he has already stolen, he wants Ukraine undefended by NATO.
(Warlords have fought for control of the strategically important Crimea for over 2,000 years.)
Putin wants to own all of Ukraine.
Why?
The Black Sea is his goal.
Ports bring money and power, and Ukraine pipelines transport Russian energy products.
Putin wants their wheat, too — with 70% crop coverage, Ukraine would be their southern breadbasket, and Russia has no qualms about starving millions of Ukrainians to death to feed its people.
In the end, it's all about greed and power.
Putin wants to own everything Russia has ever owned. This year he turns 70, and he wants to be remembered like his hero Peter the Great.
In order to get it, he's willing to kill thousands of Ukrainians
Art imitates life
This story began when a Jewish TV comedian portrayed a teacher elected President after ranting about corruption.
Servant of the People, the hit sitcom, is now the leading centrist political party.
Right, President Zelenskyy won the hearts and minds of Ukrainians by imagining a fairer world.
A fair fight is something dictators, corporatists, monopolists, and warlords despise.
Now Zelenskyy and his people will die, allowing one of history's most corrupt leaders to amass even more power.
The poor always lose
Meanwhile, the West will impose economic sanctions on Russia.
China is likely to step in to help Russia — or at least the wealthy.
The poor and working class in Russia will suffer greatly if there is a hard crash or long-term depression.
Putin's friends will continue to drink champagne and eat caviar.
Russia cutting off oil, gas, and fertilizer could cause more inflation and possibly a recession if it cuts off supplies to the West. This causes more suffering and hardship for the Western poor and working class.
Why? a billionaire sociopath gets his dirt.
Yes, Russia is simply copying America. Some of us think all war is morally wrong, regardless of who does it.
But let's not kid ourselves right now.
The markets rallied after the biggest invasion in Europe since WWII.
Investors hope Ukraine collapses and Russian oil flows.
Unbridled capitalists value lifeless.
What we can do about Ukraine
When the Russian army invaded eastern Finland, my wife's grandmother fled as a child. 80 years later, Russia still has Karelia.
Russia invaded Ukraine today to retake two eastern provinces.
History has taught us nothing.
Past mistakes won't fix the future.
Instead, we should try:
- Pray and/or meditate on our actions with our families.
- Stop buying Russian products (vodka, obviously, but also pay more for hydro/solar/geothermal/etc.)
- Stop wasting money on frivolous items and donate it to Ukrainian charities.
Here are 35+ places to donate.
- To protest, gather a few friends, contact the media, and shake signs in front of the Russian embassy.
- Prepare to welcome refugees.
More war won't save the planet or change hearts.
Only love can work.

Jayden Levitt
3 years ago
The country of El Salvador's Bitcoin-obsessed president lost $61.6 million.
It’s only a loss if you sell, right?
Nayib Bukele proclaimed himself “the world’s coolest dictator”.
His jokes aren't clear.
El Salvador's 43rd president self-proclaimed “CEO of El Salvador” couldn't be less presidential.
His thin jeans, aviator sunglasses, and baseball caps like a cartel lord.
He's popular, though.
Bukele won 53% of the vote by fighting violent crime and opposition party corruption.
El Salvador's 6.4 million inhabitants are riding the cryptocurrency volatility wave.
They were powerless.
Their autocratic leader, a former Yamaha Motors salesperson and Bitcoin believer, wants to help 70% unbanked locals.
He intended to give the citizens a way to save money and cut the country's $200 million remittance cost.
Transfer and deposit costs.
This makes logical sense when the president’s theatrics don’t blind you.
El Salvador's Bukele revealed plans to make bitcoin legal tender.
Remittances total $5.9 billion (23%) of the country's expenses.
Anything that reduces costs could boost the economy.
The country’s unbanked population is staggering. Here’s the data by % of people who either have a bank account (Blue) or a mobile money account (Black).
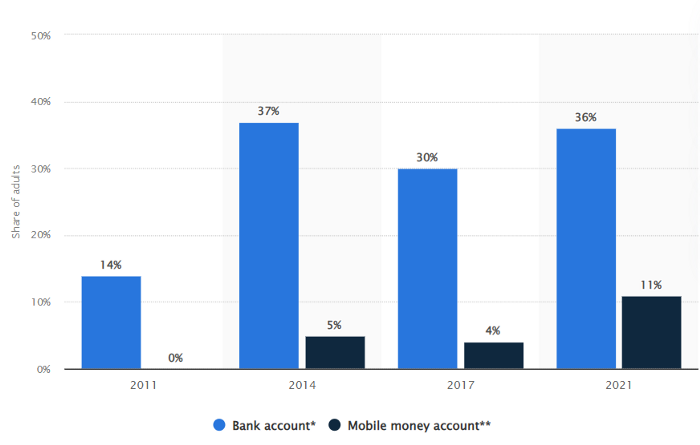
According to Bukele, 46% of the population has downloaded the Chivo Bitcoin Wallet.
In 2021, 36% of El Salvadorans had bank accounts.
Large rural countries like Kenya seem to have resolved their unbanked dilemma.
An economy surfaced where village locals would sell, trade and store network minutes and data as a store of value.
Kenyan phone networks realized unbanked people needed a safe way to accumulate wealth and have an emergency fund.
96% of Kenyans utilize M-PESA, which doesn't require a bank account.
The software involves human agents who hang out with cash and a phone.
These people are like ATMs.
You offer them cash to deposit money in your mobile money account or withdraw cash.
In a country with a faulty banking system, cash availability and a safe place to deposit it are important.
William Jack and Tavneet Suri found that M-PESA brought 194,000 Kenyan households out of poverty by making transactions cheaper and creating a safe store of value.
Mobile money, a service that allows monetary value to be stored on a mobile phone and sent to other users via text messages, has been adopted by most Kenyan households. We estimate that access to the Kenyan mobile money system M-PESA increased per capita consumption levels and lifted 194,000 households, or 2% of Kenyan households, out of poverty.
The impacts, which are more pronounced for female-headed households, appear to be driven by changes in financial behaviour — in particular, increased financial resilience and saving. Mobile money has therefore increased the efficiency of the allocation of consumption over time while allowing a more efficient allocation of labour, resulting in a meaningful reduction of poverty in Kenya.
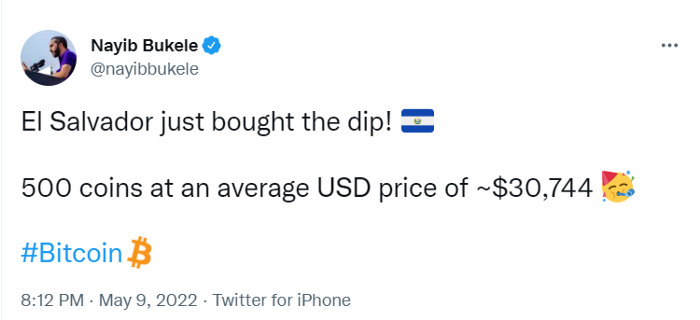
Currently, El Salvador has 2,301 Bitcoin.
At publication, it's worth $44 million. That remains 41% of Bukele's original $105.6 million.
Unknown if the country has sold Bitcoin, but Bukeles keeps purchasing the dip.
It's still falling.
This might be a fantastic move for the impoverished country over the next five years, if they can live economically till Bitcoin's price recovers.
The evidence demonstrates that a store of value pulls individuals out of poverty, but others say Bitcoin is premature.
You may regard it as an aggressive endeavor to front run the next wave of adoption, offering El Salvador a financial upside.

Claire Berehova
3 years ago
There’s no manual for that
| Kyiv oblast in springtime. Photo by author. |
We’ve been receiving since the war began text messages from the State Emergency Service of Ukraine every few days. They’ve contained information on how to comfort a child and what to do in case of a water outage.
But a question that I struggle to suppress irks within me: How would we know if there really was a threat coming our away? So how can I happily disregard an air raid siren and continue singing to my three-month-old son when I feel like a World War II film became reality? There’s no manual for that.
Along with the anxiety, there’s the guilt that always seems to appear alongside dinner we’re fortunate to still have each evening while brave Ukrainian soldiers are facing serious food insecurity. There’s no manual for how to deal with this guilt.
When it comes to the enemy, there is no manual for how to react to the news of Russian casualties. Every dead Russian soldier weakens Putin, but I also know that many of these men had wives and girlfriends who are now living a nightmare.
So, I felt like I had to start writing my own manual.
The anxiety around the air raid siren? Only with time does it get easier to ignore it, but never completely.
The guilt? All we can do is pray.
That inner conflict? As Russia continues to stun the world with its war crimes, my emotions get less gray — I have to get used to accommodating absurd levels of hatred.
Sadness? It feels a bit more manageable when we laugh, and a little alcohol helps (as it usually does).
Cabin fever? Step outside in the yard when possible. At least the sunshine is becoming more fervent with spring approaching.
Slava Ukraini. Heroyam slava. (Glory to Ukraine. Glory to the heroes.)