


More on Entrepreneurship/Creators

Muthinja
3 years ago
Why don't you relaunch my startup projects?
Open to ideas or acquisitions
Failure is an unavoidable aspect of life, yet many recoil at the word.

I've worked on unrelated startup projects. This is a list of products I developed (often as the tech lead or co-founder) and why they failed to launch.
Chess Bet (Betting)
As a chess player who plays 5 games a day and has an ELO rating of 2100, I tried to design a chess engine to rival stockfish and Houdini.
While constructing my chess engine, my cofounder asked me about building a p2p chess betting app. Chess Bet. There couldn't be a better time.
Two people in different locations could play a staked game. The winner got 90% of the bet and we got 10%. The business strategy was clear, but our mini-launch was unusual.
People started employing the same cheat engines I mentioned, causing user churn and defaming our product.
It was the first programming problem I couldn't solve after building a cheat detection system based on player move strengths and prior games. Chess.com, the most famous online chess software, still suffers from this.
We decided to pivot because we needed an expensive betting license.
We relaunched as Chess MVP after deciding to focus on chess learning. A platform for teachers to create chess puzzles and teach content. Several chess students used our product, but the target market was too tiny.
We chose to quit rather than persevere or pivot.
BodaCare (Insure Tech)
‘BodaBoda’ in Swahili means Motorcycle. My Dad approached me in 2019 (when I was working for a health tech business) about establishing an Insurtech/fintech solution for motorbike riders to pay for insurance using SNPL.
We teamed up with an underwriter to market motorcycle insurance. Once they had enough premiums, they'd get an insurance sticker in the mail. We made it better by splitting the cover in two, making it more reasonable for motorcyclists struggling with lump-sum premiums.
Lack of capital and changing customer behavior forced us to close, with 100 motorcyclists paying 0.5 USD every day. Our unit econ didn't make sense, and CAC and retention capital only dug us deeper.
Circle (Social Networking)
Having learned from both product failures, I began to understand what worked and what didn't. While reading through Instagram, an idea struck me.
Suppose social media weren't virtual.
Imagine meeting someone on your way home. Like-minded person
People were excited about social occasions after covid restrictions were eased. Anything to escape. I just built a university student-popular experiences startup. Again, there couldn't be a better time.
I started the Android app. I launched it on Google Beta and oh my! 200 people joined in two days.
It works by signaling if people are in a given place and allowing users to IM in hopes of meeting up in near real-time. Playstore couldn't deploy the app despite its success in beta for unknown reasons. I appealed unsuccessfully.
My infrastructure quickly lost users because I lacked funding.
In conclusion
This essay contains many failures, some of which might have been avoided and others not, but they were crucial learning points in my startup path.
If you liked any idea, I have the source code on Github.
Happy reading until then!

Tim Denning
3 years ago
Elon Musk’s Rich Life Is a Nightmare
I'm sure you haven't read about Elon's other side.
Elon divorced badly.
Nobody's surprised.
Imagine you're a parent. Someone isn't home year-round. What's next?
That’s what happened to YOLO Elon.
He can do anything. He can intervene in wars, shoot his mouth off, bang anyone he wants, avoid tax, make cool tech, buy anything his ego desires, and live anywhere exotic.
Few know his billionaire backstory. I'll tell you so you don't worship his lifestyle. It’s a cult.
Only his career succeeds. His life is a nightmare otherwise.
Psychopaths' schedule
Elon has said he works 120-hour weeks.
As he told the reporter about his job, he choked up, which was unusual for him.
His crazy workload and lack of sleep forced him to scold innocent Wall Street analysts. Later, he apologized.
In the same interview, he admits he hadn't taken more than a week off since 2001, when he was bedridden with malaria. Elon stays home after a near-death experience.
He's rarely outside.
Elon says he sometimes works 3 or 4 days straight.
He admits his crazy work schedule has cost him time with his kids and friends.
Elon's a slave
Elon's birthday description made him emotional.
Elon worked his entire birthday.
"No friends, nothing," he said, stuttering.
His brother's wedding in Catalonia was 48 hours after his birthday. That meant flying there from Tesla's factory prison.
He arrived two hours before the big moment, barely enough time to eat and change, let alone see his brother.
Elon had to leave after the bouquet was tossed to a crowd of billionaire lovers. He missed his brother's first dance with his wife.
Shocking.
He went straight to Tesla's prison.
The looming health crisis
Elon was asked if overworking affected his health.
Not great. Friends are worried.
Now you know why Elon tweets dumb things. Working so hard has probably caused him mental health issues.
Mental illness removed my reality filter. You do stupid things because you're tired.
Astronauts pelted Elon
Elon's overwork isn't the first time his life has made him emotional.
When asked about Neil Armstrong and Gene Cernan criticizing his SpaceX missions, he got emotional. Elon's heroes.
They're why he started the company, and they mocked his work. In another interview, we see how Elon’s business obsession has knifed him in the heart.
Once you have a company, you must feed, nurse, and care for it, even if it destroys you.
"Yep," Elon says, tearing up.
In the same interview, he's asked how Tesla survived the 2008 recession. Elon stopped the interview because he was crying. When Tesla and SpaceX filed for bankruptcy in 2008, he nearly had a nervous breakdown. He called them his "children."
All the time, he's risking everything.
Jack Raines explains best:
Too much money makes you a slave to your net worth.
Elon's emotions are admirable. It's one of the few times he seems human, not like an alien Cyborg.
Stop idealizing Elon's lifestyle
Building a side business that becomes a billion-dollar unicorn startup is a nightmare.
"Billionaire" means financially wealthy but otherwise broke. A rich life includes more than business and money.
This post is a summary. Read full article here

MAJESTY AliNICOLE WOW!
3 years ago
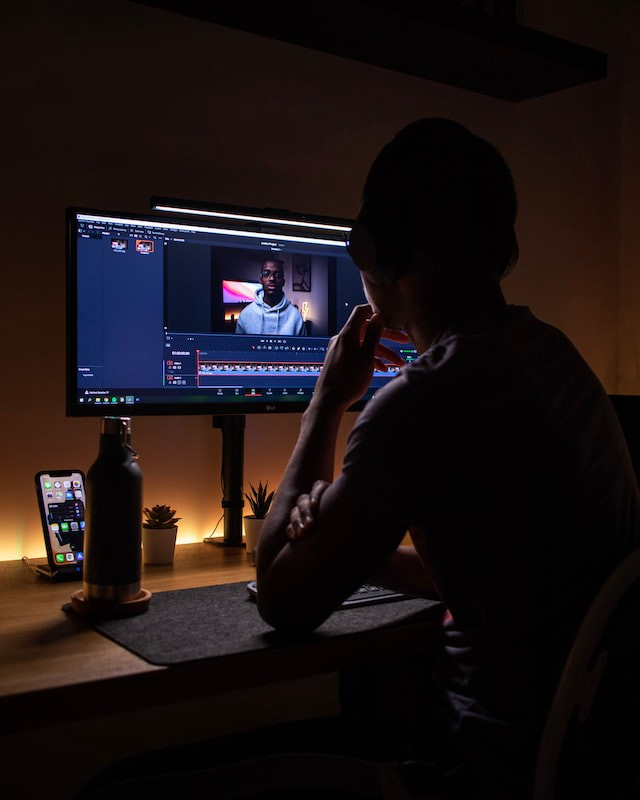
YouTube's faceless videos are growing in popularity, but this is nothing new.
I've always bucked social media norms. YouTube doesn't compare. Traditional video made me zig when everyone zagged. Audio, picture personality animation, thought movies, and slide show videos are most popular and profitable.

YouTube's business is shifting. While most video experts swear by the idea that YouTube success is all about making personal and professional Face-Share-Videos, those who use YouTube for business know things are different.
In this article, I will share concepts from my mini master class Figures to Followers: Prioritizing Purposeful Profits Over Popularity on YouTube to Create the Win-Win for You, Your Audience & More and my forthcoming publication The WOWTUBE-PRENEUR FACTOR EVOLUTION: The Basics of Powerfully & Profitably Positioning Yourself as a Video Communications Authority to Broadcast Your WOW Effect as a Video Entrepreneur.
I've researched the psychology, anthropology, and anatomy of significant social media platforms as an entrepreneur and social media marketing expert. While building my YouTube empire, I've paid particular attention to what works for short, mid, and long-term success, whether it's a niche-focused, lifestyle, or multi-interest channel.
Most new, semi-new, and seasoned YouTubers feel vlog-style or live-on-camera videos are popular. Faceless, animated, music-text-based, and slideshow videos do well for businesses.
Buyer-consumer vs. content-consumer thinking is totally different when absorbing content. Profitability and popularity are closely related, however most people become popular with traditional means but not profitable.
In my experience, Faceless videos are more profitable, although it depends on the channel's style. Several professionals are now teaching in their courses that non-traditional films are making the difference in their business success and popularity.
Face-Share-Personal-Touch videos make audiences feel like they know the personality, but they're not profitable.
Most spend hours creating articles, videos, and thumbnails to seem good. That's how most YouTubers gained their success in the past, but not anymore.
Looking the part and performing a typical role in videos doesn't convert well, especially for newbie channels.
Working with video marketers and YouTubers for years, I've noticed that most struggle to be consistent with content publishing since they exclusively use formats that need extensive development. Camera and green screen set ups, shooting/filming, and editing for post productions require their time, making it less appealing to post consistently, especially if they're doing all the work themselves.
Because they won't make simple format videos or audio videos with an overlay image, they overcomplicate the procedure (even with YouTube Shorts), and they leave their channels for weeks or months. Again, they believe YouTube only allows specific types of videos. Even though this procedure isn't working, they plan to keep at it.
A successful YouTube channel needs multiple video formats to suit viewer needs, I teach. Face-Share-Personal Touch and Faceless videos are both useful.
How people engage with YouTube content has changed over the years, and the average customer is no longer interested in an all-video channel.
Face-Share-Personal-Touch videos are great
Google Live
Online training
Giving listeners a different way to access your podcast that is being broadcast on sites like Anchor, BlogTalkRadio, Spreaker, Google, Apple Store, and others Many people enjoy using a video camera to record themselves while performing the internet radio, Facebook, or Instagram Live versions of their podcasts.
Video Blog Updates
even more
Faceless videos are popular for business and benefit both entrepreneurs and audiences.
For the business owner/entrepreneur…
Less production time results in time dollar savings.
enables the business owner to demonstrate the diversity of content development
For the Audience…
The channel offers a variety of appealing content options.
The same format is not monotonous or overly repetitive for the viewers.
Below are a couple videos from YouTube guru Make Money Matt's channel, which has over 347K subscribers.
Enjoy
24 Best Niches to Make Money on YouTube Without Showing Your Face
Make Money on YouTube Without Making Videos (Free Course)
In conclusion, you have everything it takes to build your own YouTube brand and empire. Learn the rules, then adapt them to succeed.
Please reread this and the other suggested articles for optimal benefit.
I hope this helped. How has this article helped you? Follow me for more articles like this and more multi-mission expressions.
You might also like

Web3Lunch
3 years ago
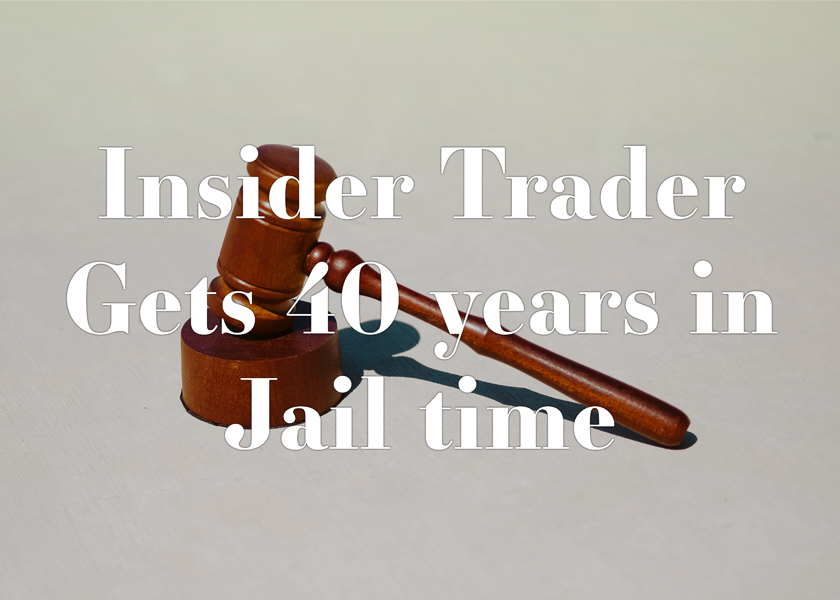
An employee of OpenSea might get a 40-year prison sentence for insider trading using NFTs.
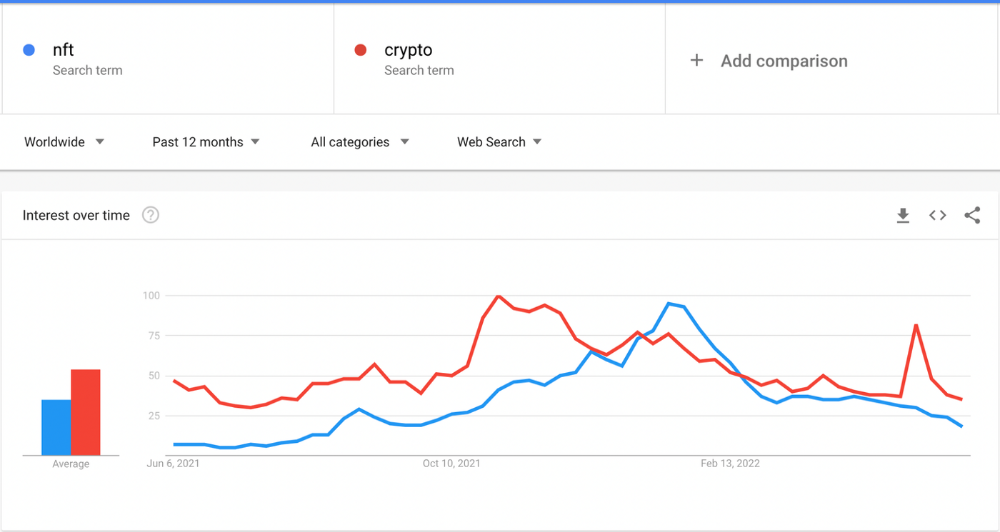
The space had better days. Those greenish spikes...oh wow, haven't felt that in ages. Cryptocurrencies and NFTs have lost popularity. Google agrees. Both are declining.
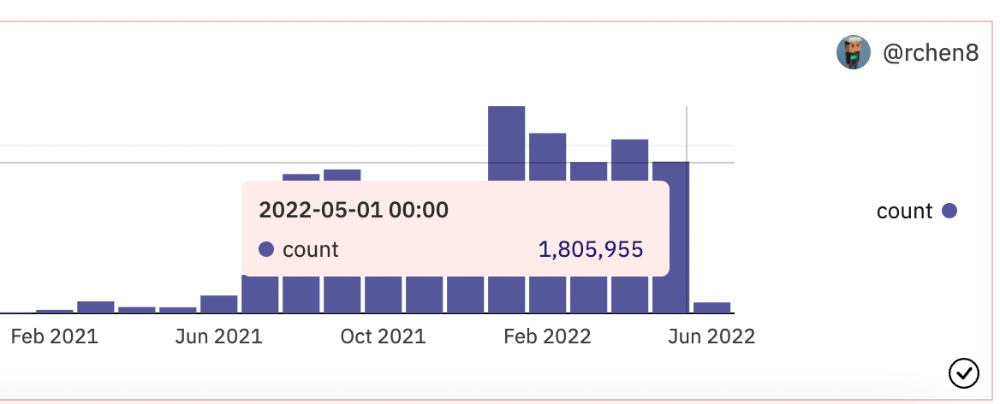
As seen below, crypto interest spiked in May because of the Luna fall. NFT interest is similar to early October last year.
This makes me think NFTs are mostly hype and FOMO. No art or community. I've seen enough initiatives to know that communities stick around if they're profitable. Once it starts falling, they move on to the next project. The space has no long-term investments. Flip everything.
OpenSea trading volume has stayed steady for months. May's volume is 1.8 million ETH ($3.3 billion).
Despite this, I think NFTs and crypto will stick around. In bad markets, builders gain most.
Only 4k developers are active on Ethereum blockchain. It's low. A great chance for the space enthusiasts.
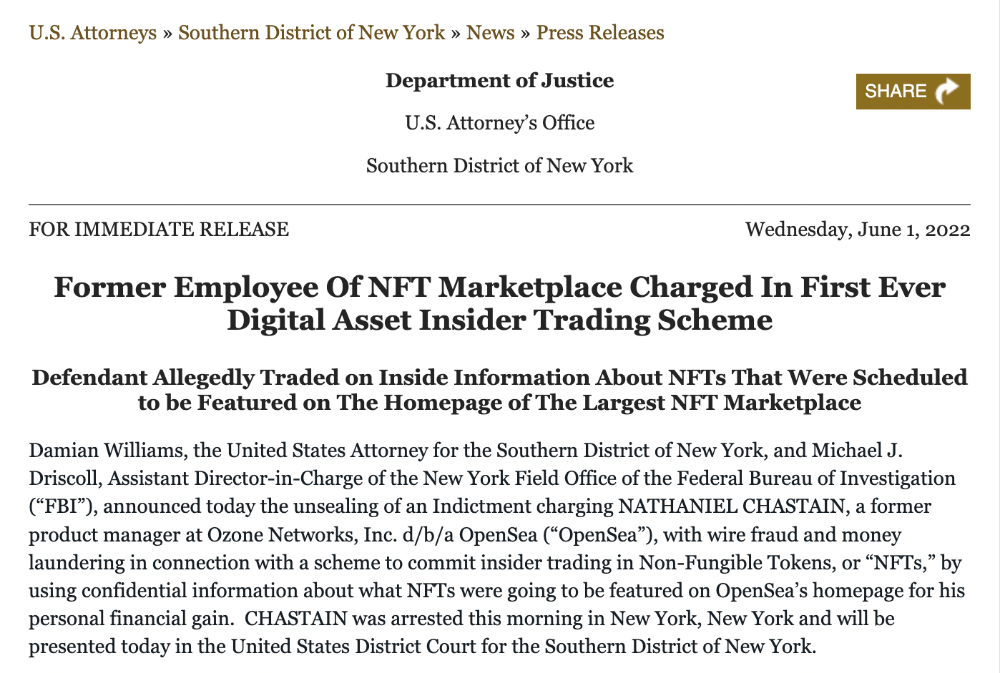
An employee of OpenSea might get a 40-year prison sentence for insider trading using NFTs.
Nathaniel Chastian, an OpenSea employee, traded on insider knowledge. He'll serve 40 years for that.
Here's what happened if you're unfamiliar.
OpenSea is a secondary NFT marketplace. Their homepage featured remarkable drops. Whatever gets featured there, NFT prices will rise 5x.
Chastian was at OpenSea. He chose forthcoming NFTs for OpenSeas' webpage.
Using anonymous digital currency wallets and OpenSea accounts, he would buy NFTs before promoting them on the homepage, showcase them, and then sell them for at least 25 times the price he paid.
From June through September 2021, this happened. Later caught, fired. He's charged with wire fraud and money laundering, each carrying a 20-year maximum penalty.
Although web3 space is all about decentralization, a step like this is welcomed since it restores faith in the area. We hope to see more similar examples soon.
Here's the press release.
Understanding smart contracts
@cantino.eth has a Twitter thread on smart contracts. Must-read. Also, he appears educated about the space, so follow him.


Patryk Nawrocki
3 years ago
7 things a new UX/UI designer should know

If I could tell my younger self a few rules, they would boost my career.
1. Treat design like medicine; don't get attached.

If it doesn't help, you won't be angry, but you'll try to improve it. Designers blame others if they don't like the design, but the rule is the same: we solve users' problems. You're not your design, and neither are they. Be humble with your work because your assumptions will often be wrong and users will behave differently.
2. Consider your design flawed.

Disagree with yourself, then defend your ideas. Most designers forget to dig deeper into a pattern, screen, button, or copywriting. If someone asked, "Have you considered alternatives? How does this design stack up? Here's a functional UX checklist to help you make design decisions.
3. Codeable solutions.

If your design requires more developer time, consider whether it's worth spending more money to code something with a small UX impact. Overthinking problems and designing abstract patterns is easy. Sometimes you see something on dribbble or bechance and try to recreate it, but it's not worth it. Here's my article on it.
4. Communication changes careers

Designers often talk with users, clients, companies, developers, and other designers. How you talk and present yourself can land you a job. Like driving or swimming, practice it. Success requires being outgoing and friendly. If I hadn't said "hello" to a few people, I wouldn't be where I am now.
5. Ignorance of the law is not an excuse.

Copyright, taxation How often have you used an icon without checking its license? If you use someone else's work in your project, the owner can cause you a lot of problems — paying a lot of money isn't worth it. Spend a few hours reading about copyrights, client agreements, and taxes.
6. Always test your design

If nobody has seen or used my design, it's not finished. Ask friends about prototypes. Testing reveals how wrong your assumptions were. Steve Krug, one of the authorities on this topic will tell you more about how to do testing.
7. Run workshops
A UX designer's job involves talking to people and figuring out what they need, which is difficult because they usually don't know. Organizing teamwork sessions is a powerful skill, but you must also be a good listener. Your job is to help a quiet, introverted developer express his solution and control the group. AJ Smart has more on workshops here.

Jon Brosio
3 years ago
You can learn more about marketing from these 8 copywriting frameworks than from a college education.
Email, landing pages, and digital content

Today's most significant skill:
Copywriting.
Unfortunately, most people don't know how to write successful copy because they weren't taught in school.
I've been obsessed with copywriting for two years. I've read 15 books, completed 3 courses, and studied internet's best digital entrepreneurs.
Here are 8 copywriting frameworks that educate more than a four-year degree.
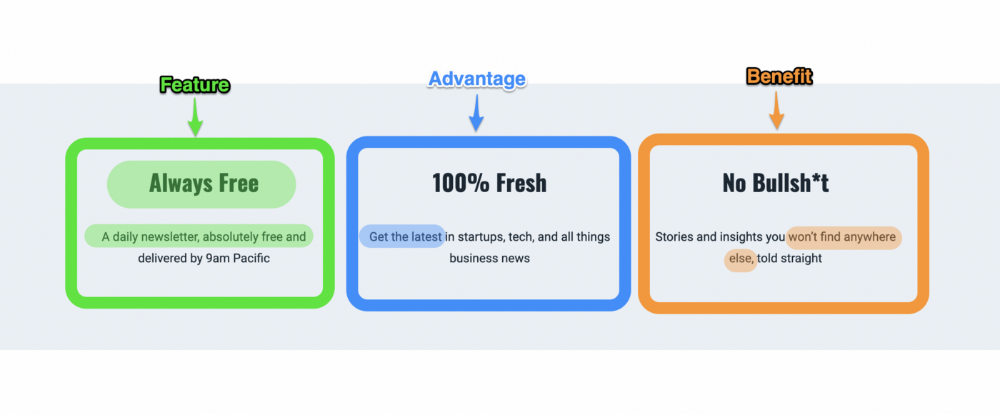
1. Feature — Advantage — Benefit (F.A.B)
This is the most basic copywriting foundation. Email marketing, landing page copy, and digital video ads can use it.
F.A.B says:
How it works (feature)
which is helpful (advantage)
What's at stake (benefit)
The Hustle uses this framework on their landing page to convince people to sign up:
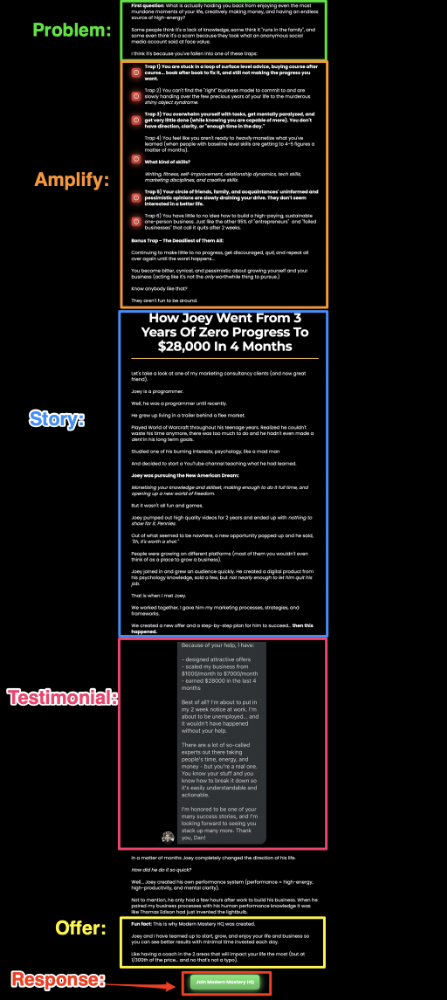
2. P. A. S. T. O. R.
This framework is for longer-form copywriting. PASTOR uses stories to engage with prospects. It explains why people should buy this offer.
PASTOR means:
Problem
Amplify
Story
Testimonial
Offer
Response
Dan Koe's landing page is a great example. It shows PASTOR frame-by-frame.
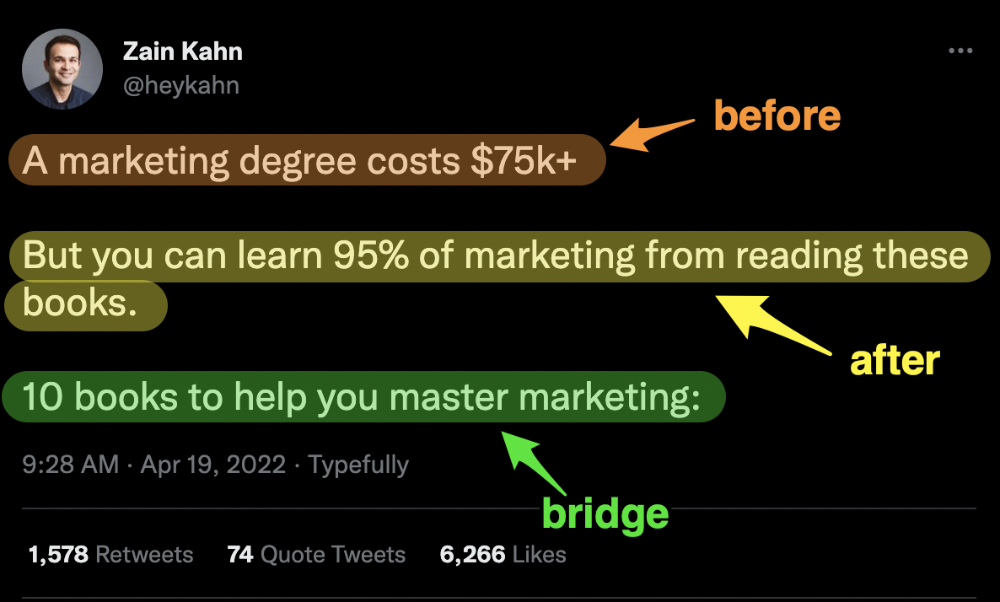
3. Before — After — Bridge
Before-after-bridge is a copywriting framework that draws attention and shows value quickly.
This framework highlights:
where you are
where you want to be
how to get there
Works great for: Email threads/landing pages
Zain Kahn utilizes this framework to write viral threads.
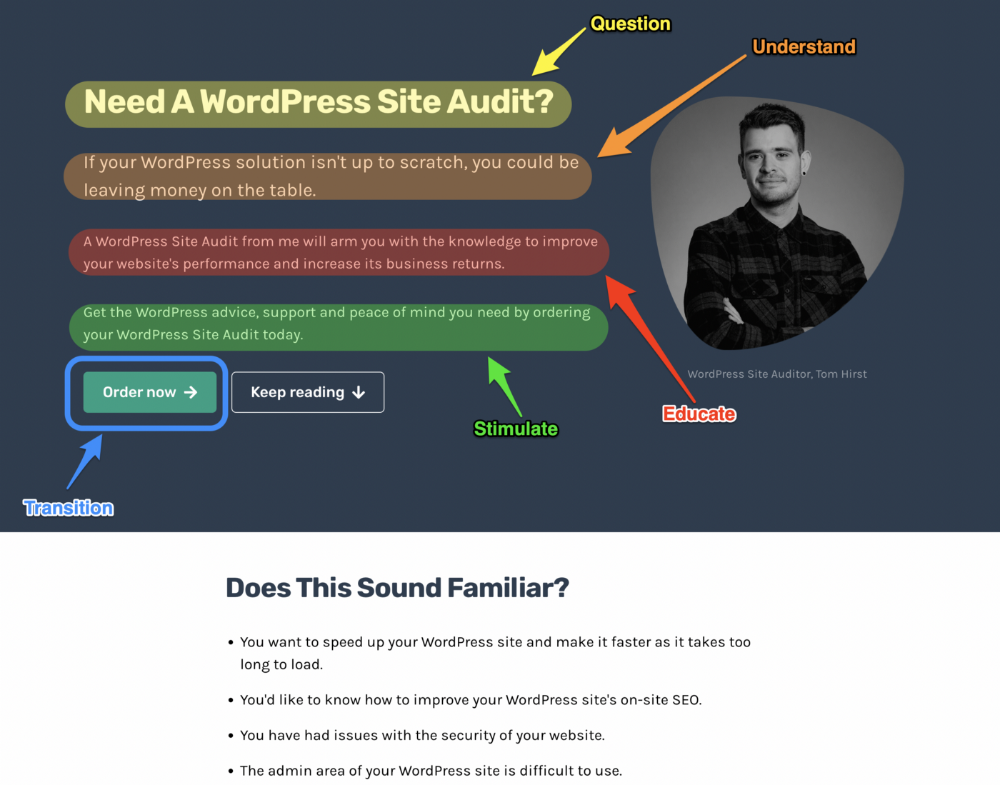
4. Q.U.E.S.T
QUEST is about empathetic writing. You know their issues, obstacles, and headaches. This allows coverups.
QUEST:
Qualifies
Understands
Educates
Stimulates
Transitions
Tom Hirst's landing page uses the QUEST framework.
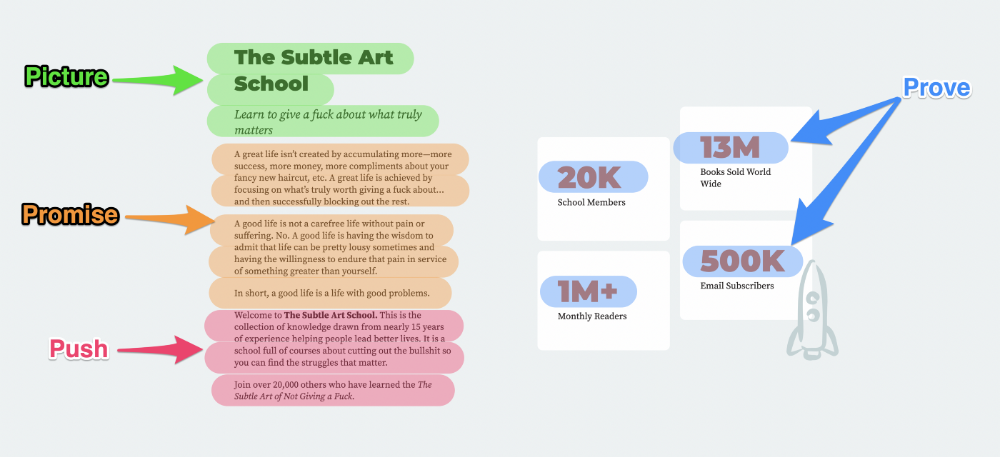
5. The 4P’s model
The 4P’s approach pushes your prospect to action. It educates and persuades quickly.
4Ps:
The problem the visitor is dealing with
The promise that will help them
The proof the promise works
A push towards action
Mark Manson is a bestselling author, digital creator, and pop-philosopher. He's also a great copywriter, and his membership offer uses the 4P’s framework.
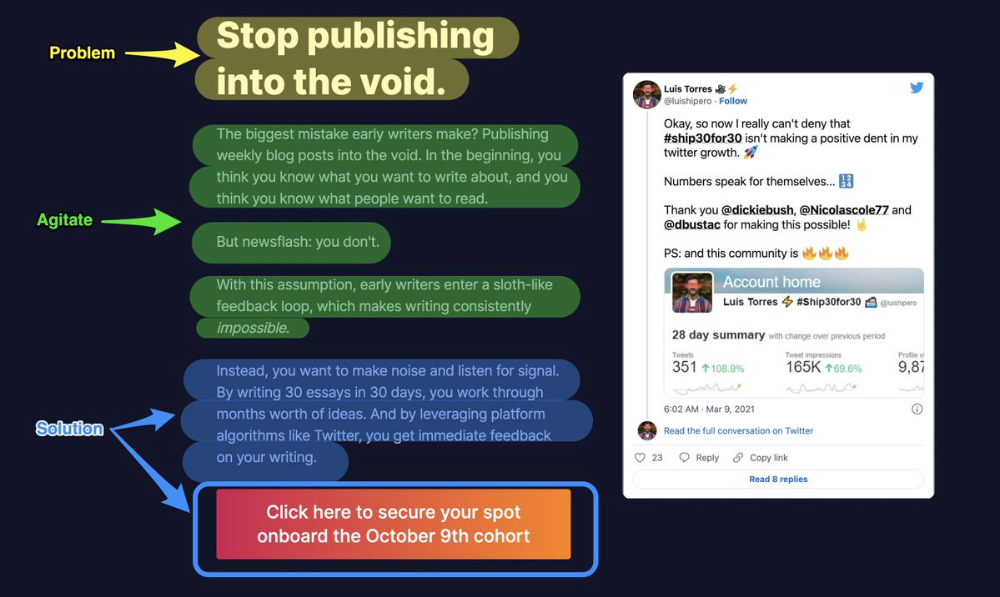
6. Problem — Agitate — Solution (P.A.S)
Up-and-coming marketers should understand problem-agitate-solution copywriting. Once you understand one structure, others are easier. It drives passion and presents a clear solution.
PAS outlines:
The issue the visitor is having
It then intensifies this issue through emotion.
finally offers an answer to that issue (the offer)
The customer's story loops. Nicolas Cole and Dickie Bush use PAS to promote Ship 30 for 30.
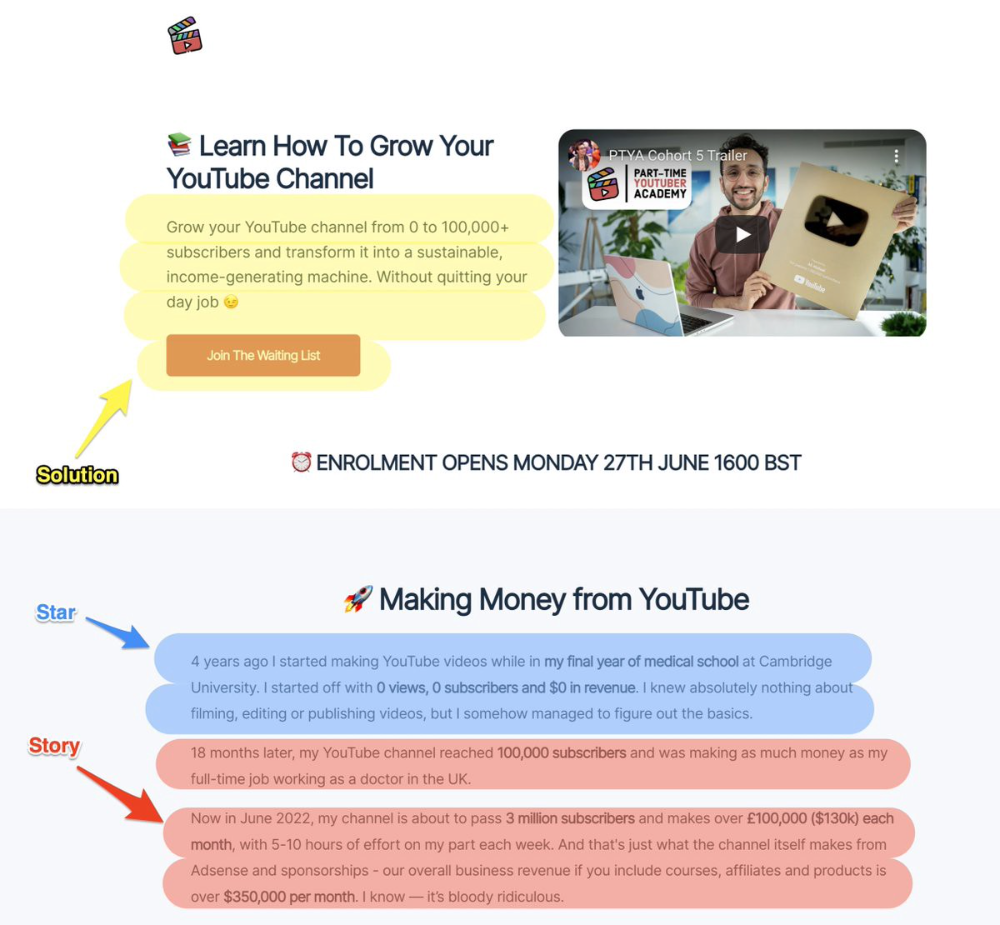
7. Star — Story — Solution (S.S.S)
PASTOR + PAS = star-solution-story. Like PAS, it employs stories to persuade.
S.S.S. is effective storytelling:
Star: (Person had a problem)
Story: (until they had a breakthrough)
Solution: (That created a transformation)
Ali Abdaal is a YouTuber with a great S.S.S copy.
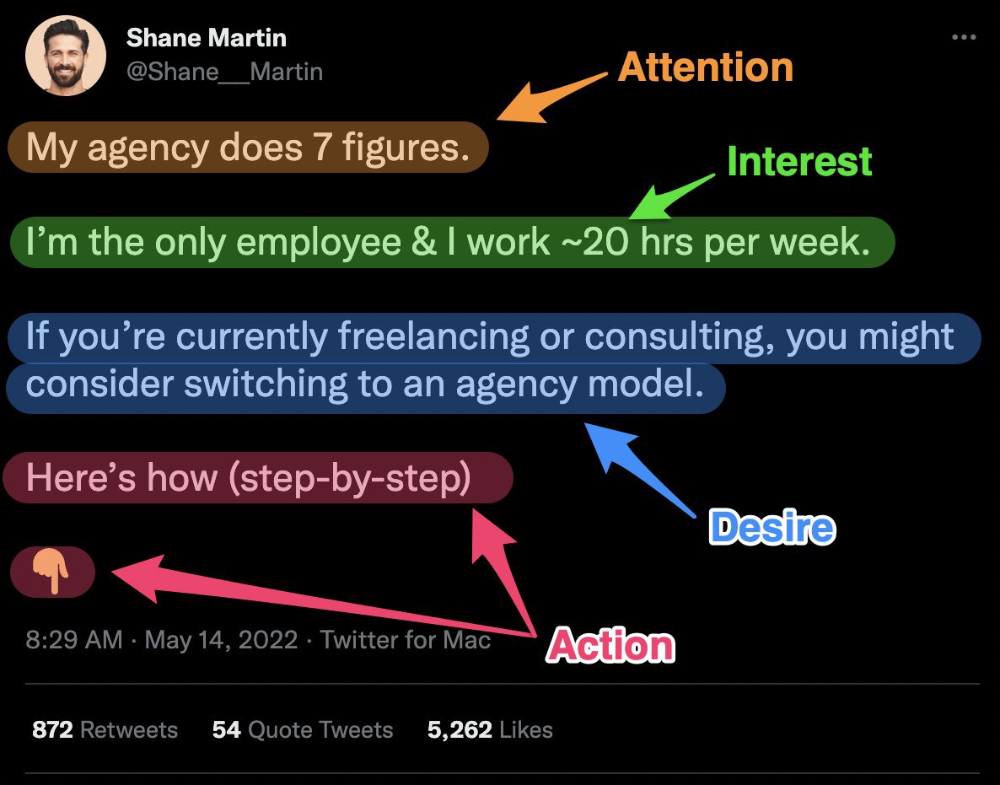
8. Attention — Interest — Desire — Action
AIDA is another classic. This copywriting framework is great for fast-paced environments (think all digital content on Linkedin, Twitter, Medium, etc.).
It works with:
Page landings
writing on thread
Email
It's a good structure since it's concise, attention-grabbing, and action-oriented.
Shane Martin, Twitter's creator, uses this approach to create viral content.
TL;DR
8 copywriting frameworks that teach marketing better than a four-year degree
Feature-advantage-benefit
Before-after-bridge
Star-story-solution
P.A.S.T.O.R
Q.U.E.S.T
A.I.D.A
P.A.S
4P’s