


More on Marketing

Yucel F. Sahan
3 years ago
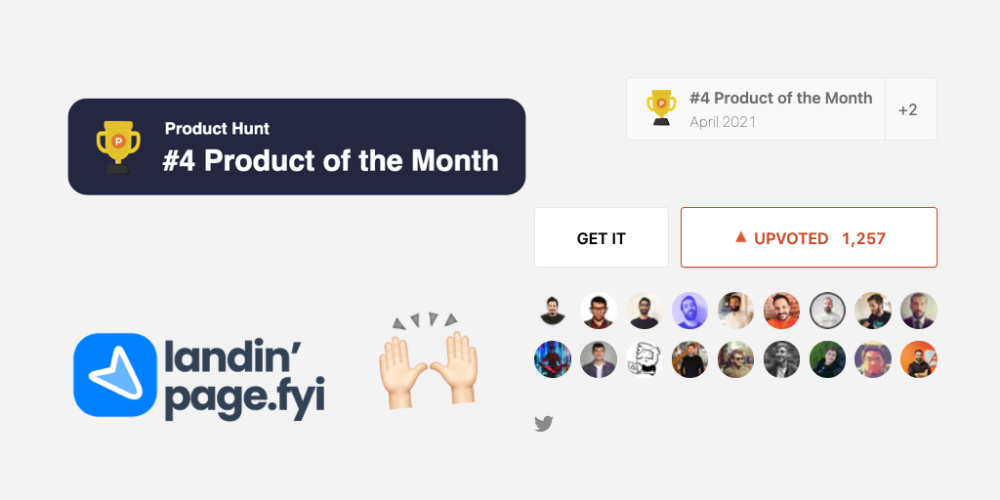
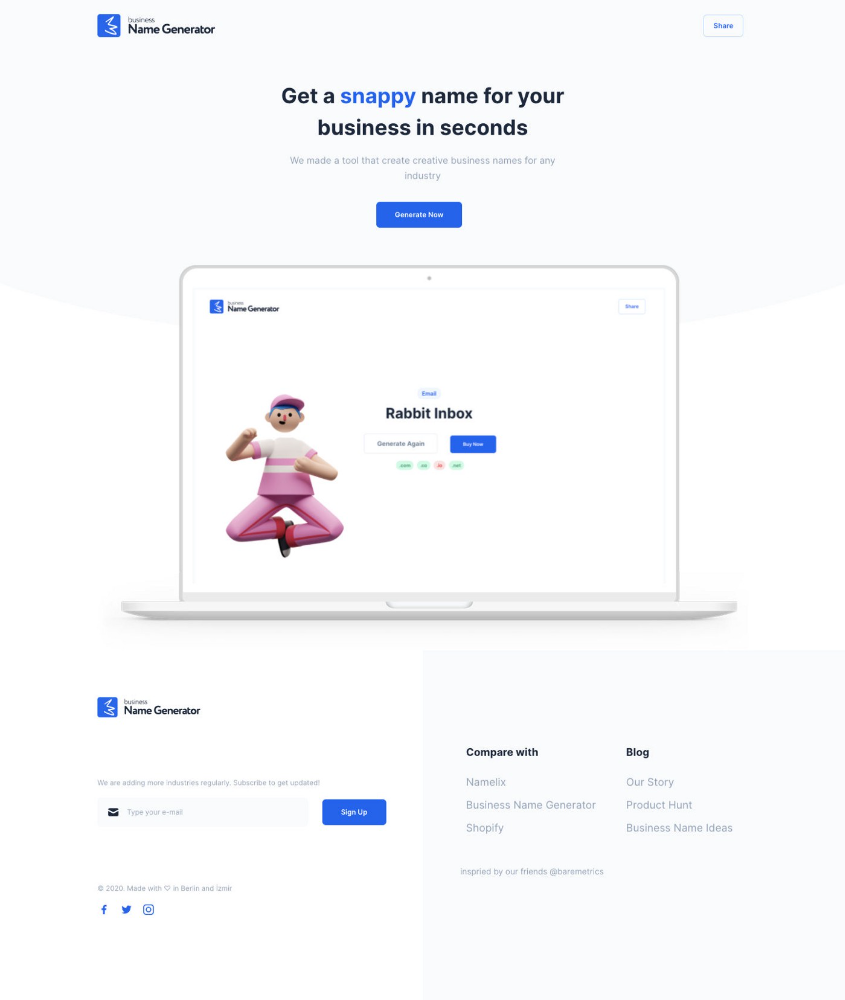
How I Created the Day's Top Product on Product Hunt
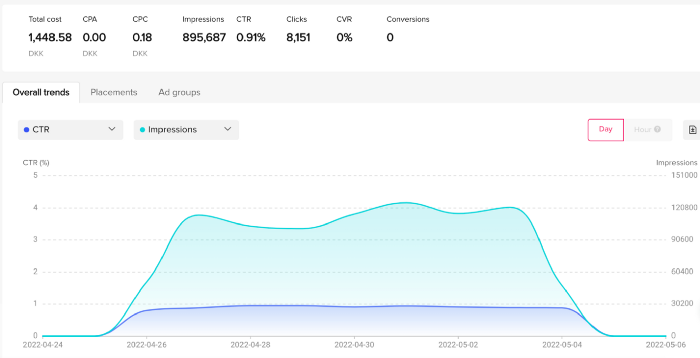
In this article, I'll describe a weekend project I started to make something. It was Product Hunt's #1 of the Day, #2 Weekly, and #4 Monthly product.
How did I make Landing Page Checklist so simple? Building and launching took 3 weeks. I worked 3 hours a day max. Weekends were busy.
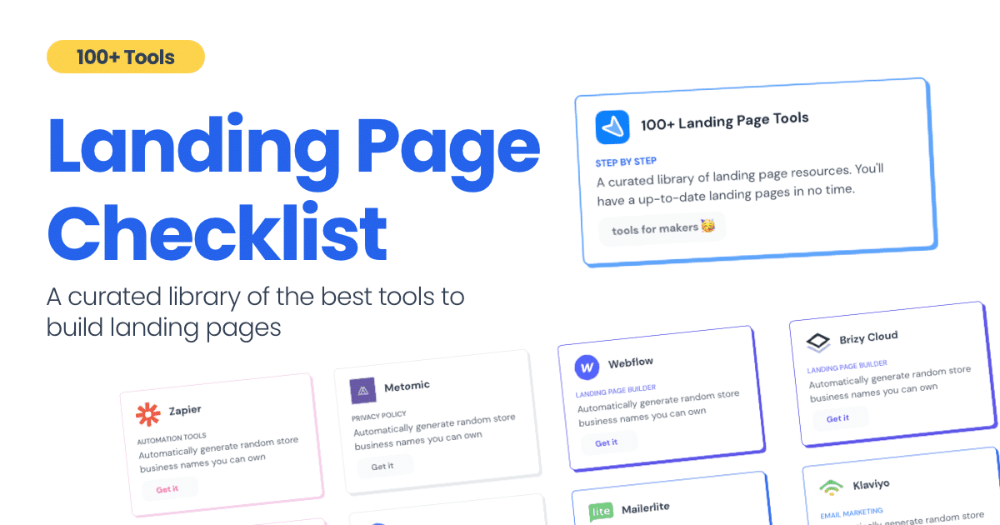
It's sort of a long story, so scroll to the bottom of the page to see what tools I utilized to create Landing Page Checklist :x
As a matter of fact, it all started with the startups-investments blog; Startup Bulletin, that I started writing in 2018. No, don’t worry, I won’t be going that far behind. The twitter account where I shared the blog posts of this newsletter was inactive for a looong time. I was holding this Twitter account since 2009, I couldn’t bear to destroy it. At the same time, I was thinking how to evaluate this account.
So I looked for a weekend assignment.
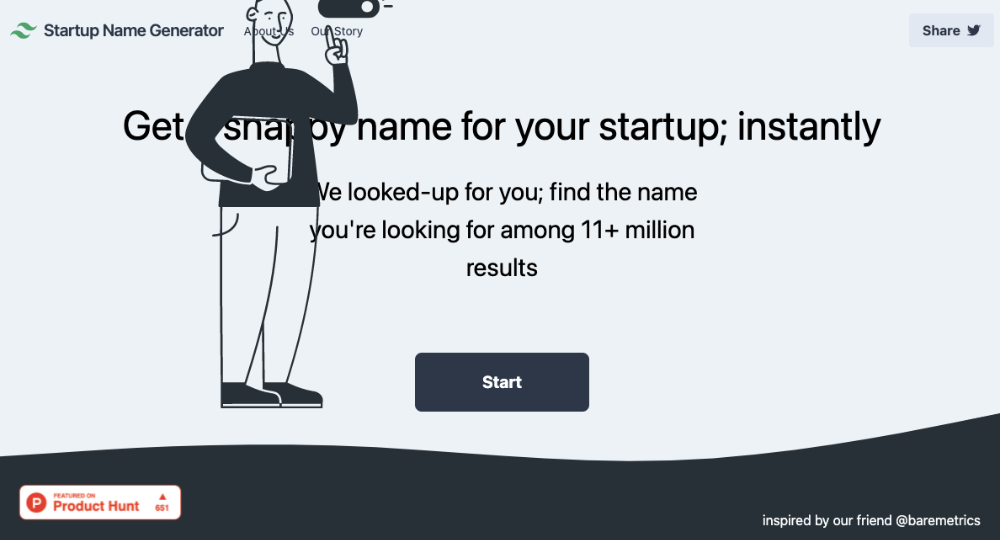
Weekend undertaking: Generate business names
Barash and I established a weekend effort to stay current. Building things helped us learn faster.
Simple. Startup Name Generator The utility generated random startup names. After market research for SEO purposes, we dubbed it Business Name Generator.
Backend developer Barash dislikes frontend work. He told me to write frontend code. Chakra UI and Tailwind CSS were recommended.
It was the first time I have heard about Tailwind CSS.
Before this project, I made mobile-web app designs in Sketch and shared them via Zeplin. I can read HTML-CSS or React code, but not write it. I didn't believe myself but followed Barash's advice.
My home page wasn't responsive when I started. Here it was:)
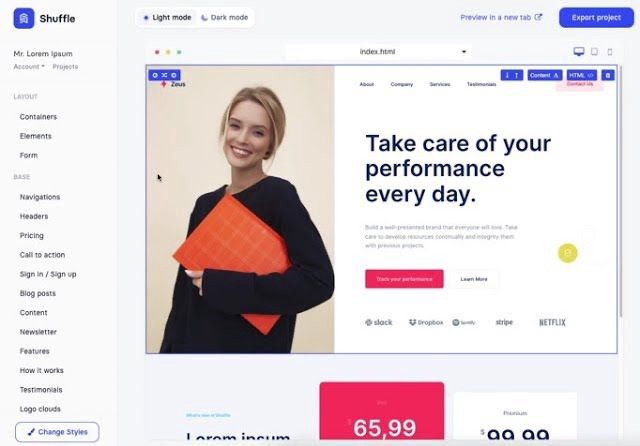
And then... Product Hunt had something I needed. Me-only! A website builder that gives you clean Tailwind CSS code and pre-made web components (like Elementor). Incredible.
I bought it right away because it was so easy to use. Best part: It's not just index.html. It includes all needed files. Like
postcss.config.js
README.md
package.json
among other things, tailwind.config.js
This is for non-techies.
Tailwind.build; which is Shuffle now, allows you to create and export projects for free (with limited features). You can try it by visiting their website.
After downloading the project, you can edit the text and graphics in Visual Studio (or another text editor). This HTML file can be hosted whenever.
Github is an easy way to host a landing page.
your project via Shuffle for export
your website's content, edit
Create a Gitlab, Github, or Bitbucket account.
to Github, upload your project folder.
Integrate Vercel with your Github account (or another platform below)
Allow them to guide you in steps.
Finally. If you push your code to Github using Github Desktop, you'll do it quickly and easily.
Speaking of; here are some hosting and serverless backend services for web applications and static websites for you host your landing pages for FREE!
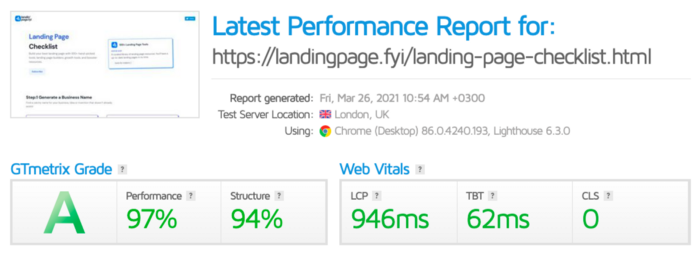
I host landingpage.fyi on Vercel but all is fine. You can choose any platform below with peace in mind.
Vercel
Render
Netlify
After connecting your project/repo to Vercel, you don’t have to do anything on Vercel. Vercel updates your live website when you update Github Desktop. Wow!
Tails came out while I was using tailwind.build. Although it's prettier, tailwind.build is more mobile-friendly. I couldn't resist their lovely parts. Tails :)
Tails have several well-designed parts. Some components looked awful on mobile, but this bug helped me understand Tailwind CSS.
Unlike Shuffle, Tails does not include files when you export such as config.js, main.js, README.md. It just gives you the HTML code. Suffle.dev is a bit ahead in this regard and with mobile-friendly blocks if you ask me. Of course, I took advantage of both.
creativebusinessnames.co is inactive, but I'll leave a deployment link :)
Adam Wathan's YouTube videos and Tailwind's official literature helped me, but I couldn't have done it without Tails and Shuffle. These tools helped me make landing pages. I shouldn't have started over.
So began my Tailwind CSS adventure. I didn't build landingpage. I didn't plan it to be this long; sorry.
I learnt a lot while I was playing around with Shuffle and Tails Builders.
Long story short I built landingpage.fyi with the help of these tools;
Learning, building, and distribution
Shuffle (Started with a Shuffle Template)
Tails (Used components from here)
Sketch (to handle icons, logos, and .svg’s)
metatags.io (Auto Generator Meta Tags)
Vercel (Hosting)
Github Desktop (Pushing code to Github -super easy-)
Visual Studio Code (Edit my code)
Mailerlite (Capture Emails)
Jarvis / Conversion.ai (%90 of the text on website written by AI 😇 )
CookieHub (Consent Management)
That's all. A few things:
The Outcome
.fyi Domain: Why?
I'm often asked this.
I don't know, but I wanted to include the landing page term. Popular TLDs are gone. I saw my alternatives. brief and catchy.
CSS Tailwind Resources
I'll share project resources like Tails and Shuffle.
Beginner Tailwind (I lately enrolled in this course but haven’t completed it yet.)
Thanks for reading my blog's first post. Please share if you like it.

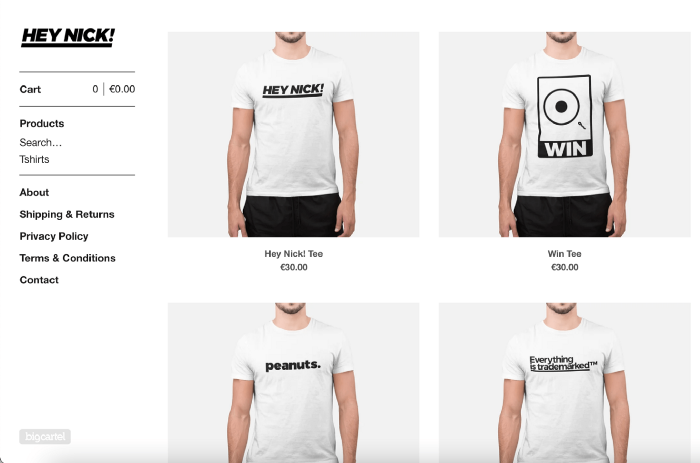
obimy.app
3 years ago
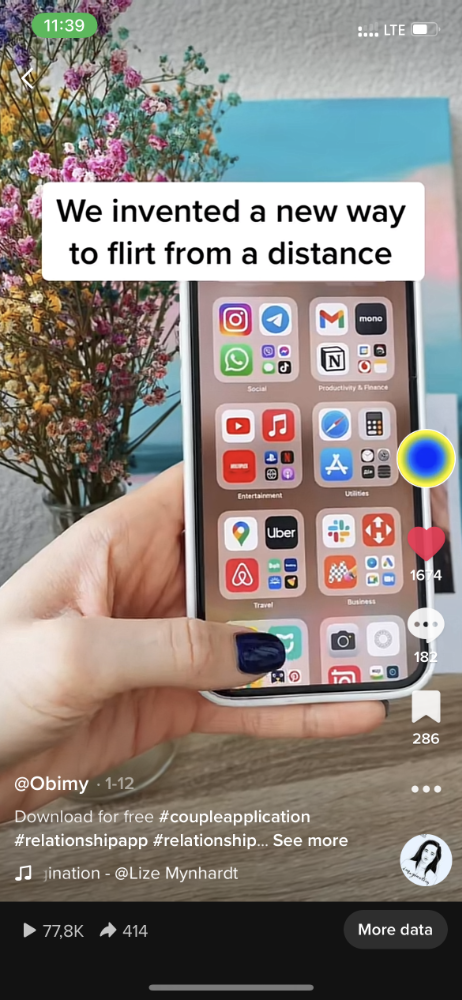
How TikTok helped us grow to 6 million users
This resulted to obimy's new audience.
Hi! obimy's official account. Here, we'll teach app developers and marketers. In 2022, our downloads increased dramatically, so we'll share what we learned.
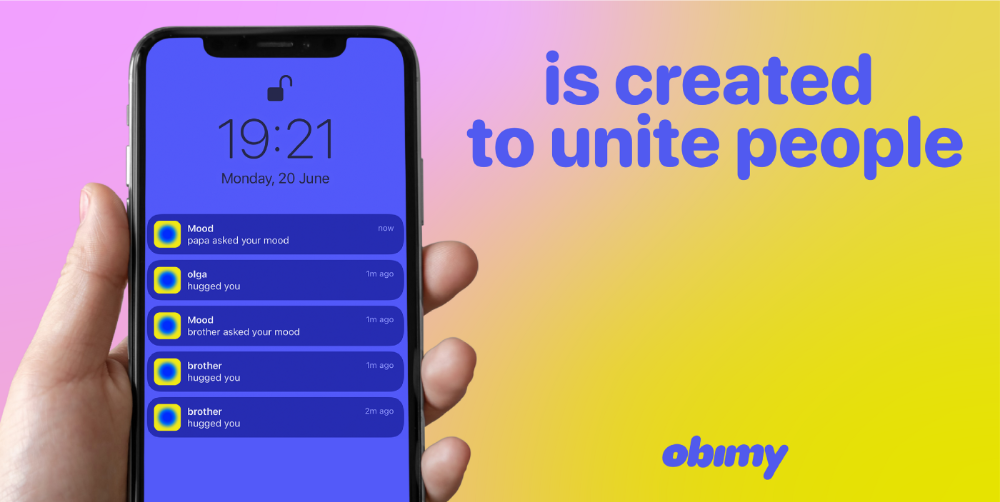
obimy is what we call a ‘senseger’. It's a new method to communicate digitally. Instead of text, obimy users connect through senses and moods. Feeling playful? Flirt with your partner, pat a pal, or dump water on a classmate. Each feeling is an interactive animation with vibration. It's a wordless app. App Store and Google Play have obimy.
We had 20,000 users in 2022. Two to five thousand of them opened the app monthly. Our DAU metric was 500.
We have 6 million users after 6 months. 500,000 individuals use obimy daily. obimy was the top lifestyle app this week in the U.S.
And TikTok helped.
TikTok fuels obimys' growth. It's why our app exploded. How and what did we learn? Our Head of Marketing, Anastasia Avramenko, knows.
our actions prior to TikTok
We wanted to achieve product-market fit through organic expansion. Quora, Reddit, Facebook Groups, Facebook Ads, Google Ads, Apple Search Ads, and social media activity were tested. Nothing worked. Our CPI was sometimes $4, so unit economics didn't work.
We studied our markets and made audience hypotheses. We promoted our goods and studied our audience through social media quizzes. Our target demographic was Americans in long-distance relationships. I designed quizzes like Test the Strength of Your Relationship to better understand the user base. After each quiz, we encouraged users to download the app to enhance their connection and bridge the distance.
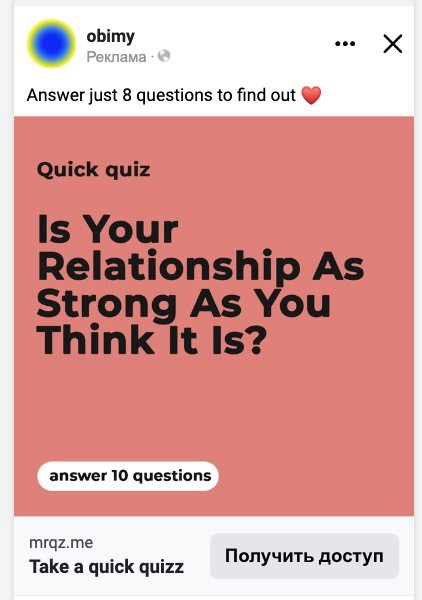
We got 1,000 responses for $50. This helped us comprehend the audience's grief and coping strategies (aka our rivals). I based action items on answers given. If you can't embrace a loved one, use obimy.
We also tried Facebook and Google ads. From the start, we knew it wouldn't work.
We were desperate to discover a free way to get more users.
Our journey to TikTok
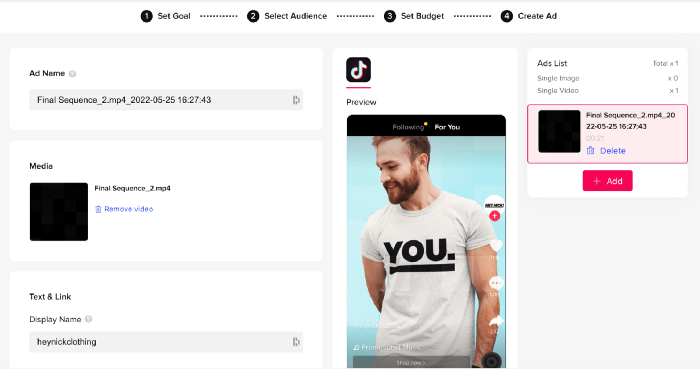
TikTok is a great venue for emerging creators. It also helped reach people. Before obimy, my TikTok videos garnered 12 million views without sponsored promotion.
We had to act. TikTok was required.
I wasn't a TikTok user before obimy. Initially, I uploaded promotional content. Call-to-actions appear strange next to dancing challenges and my money don't jiggle jiggle. I learned TikTok. Watch TikTok for an hour was on my to-do list. What a dream job!
Our most popular movies presented the app alongside text outlining what it does. We started promoting them in Europe and the U.S. and got a 16% CTR and $1 CPI, an improvement over our previous efforts.
Somehow, we were expanding. So we came up with new hypotheses, calls to action, and content.
Four months passed, yet we saw no organic growth.
Russia attacked Ukraine.
Our app aimed to be helpful. For now, we're focusing on our Ukrainian audience. I posted sloppy TikToks illustrating how obimy can help during shelling or air raids.
In two hours, Kostia sent me our visitor count. Our servers crashed.
Initially, we had several thousand daily users. Over 200,000 users joined obimy in a week. They posted obimy videos on TikTok, drawing additional users. We've also resumed U.S. video promotion.
We gained 2,000,000 new members with less than $100 in ads, primarily in the U.S. and U.K.
TikTok helped.
The figures
We were confident we'd chosen the ideal tool for organic growth.
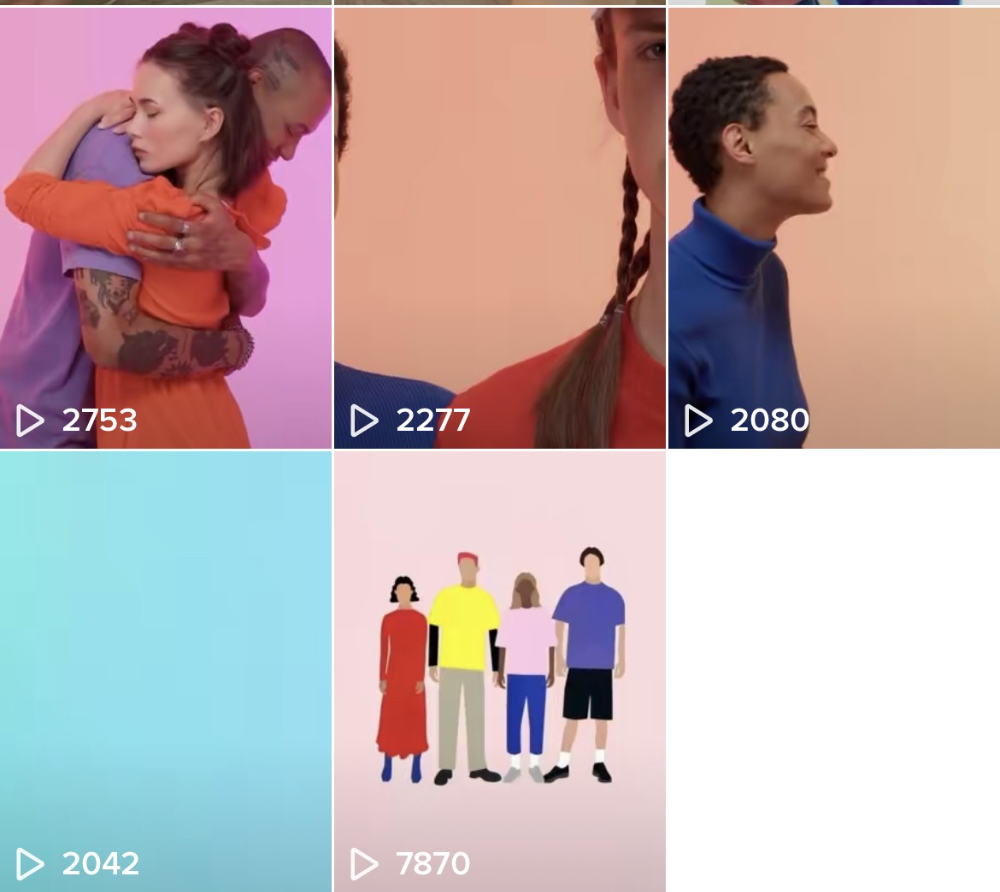
Over 45 million people have viewed our own videos plus a ton of user-generated content with the hashtag #obimy.
About 375 thousand people have liked all of our individual videos.
The number of downloads and the virality of videos are directly correlated.
Where are we now?
TikTok fuels our organic growth. We post 56 videos every week and pay to promote viral content.
We use UGC and influencers. We worked with Universal Music Italy on Eurovision. They offered to promote us through their million-follower TikTok influencers. We thought their followers would improve our audience, but it didn't matter. Integration didn't help us. Users that share obimy videos with their followers can reach several million views, which affects our download rate.
After the dust settled, we determined our key audience was 13-18-year-olds. They want to express themselves, but it's sometimes difficult. We're searching for methods to better engage with our users. We opened a Discord server to discuss anime and video games and gather app and content feedback.
TikTok helps us test product updates and hypotheses. Example: I once thought we might raise MAU by prompting users to add strangers as friends. Instead of asking our team to construct it, I made a TikTok urging users to share invite URLs. Users share links under every video we upload, embracing people worldwide.
Key lessons
Don't direct-sell. TikTok isn't for Instagram, Facebook, or YouTube promo videos. Conventional advertisements don't fit. Most users will swipe up and watch humorous doggos.
More product videos are better. Finally. So what?
Encourage interaction. Tagging friends in comments or making videos with the app promotes it more than any marketing spend.
Be odd and risqué. A user mistakenly sent a French kiss to their mom in one of our most popular videos.
TikTok helps test hypotheses and build your user base. It also helps develop apps. In our upcoming blog, we'll guide you through obimy's design revisions based on TikTok. Follow us on Twitter, Instagram, and TikTok.

Sammy Abdullah
3 years ago
How to properly price SaaS
Price Intelligently put out amazing content on pricing your SaaS product. This blog's link to the whole report is worth reading. Our key takeaways are below.

Don't base prices on the competition. Competitor-based pricing has clear drawbacks. Their pricing approach is yours. Your company offers customers something unique. Otherwise, you wouldn't create it. This strategy is static, therefore you can't add value by raising prices without outpricing competitors. Look, but don't touch is the competitor-based moral. You want to know your competitors' prices so you're in the same ballpark, but they shouldn't guide your selections. Competitor-based pricing also drives down prices.
Value-based pricing wins. This is customer-based pricing. Value-based pricing looks outward, not inward or laterally at competitors. Your clients are the best source of pricing information. By valuing customer comments, you're focusing on buyers. They'll decide if your pricing and packaging are right. In addition to asking consumers about cost savings or revenue increases, look at data like number of users, usage per user, etc.
Value-based pricing increases prices. As you learn more about the client and your worth, you'll know when and how much to boost rates. Every 6 months, examine pricing.
Cloning top customers. You clone your consumers by learning as much as you can about them and then reaching out to comparable people or organizations. You can't accomplish this without knowing your customers. Segmenting and reproducing them requires as much detail as feasible. Offer pricing plans and feature packages for 4 personas. The top plan should state Contact Us. Your highest-value customers want more advice and support.
Question your 4 personas. What's the one item you can't live without? Which integrations matter most? Do you do analytics? Is support important or does your company self-solve? What's too cheap? What's too expensive?
Not everyone likes per-user pricing. SaaS organizations often default to per-user analytics. About 80% of companies utilizing per-user pricing should use an alternative value metric because their goods don't give more value with more users, so charging for them doesn't make sense.
At least 3:1 LTV/CAC. Break even on the customer within 2 years, and LTV to CAC is greater than 3:1. Because customer acquisition costs are paid upfront but SaaS revenues accrue over time, SaaS companies face an early financial shortfall while paying back the CAC.
ROI should be >20:1. Indeed. Ensure the customer's ROI is 20x the product's cost. Microsoft Office costs $80 a year, but consumers would pay much more to maintain it.
A/B Testing. A/B testing is guessing. When your pricing page varies based on assumptions, you'll upset customers. You don't have enough customers anyway. A/B testing optimizes landing pages, design decisions, and other site features when you know the problem but not pricing.
Don't discount. It cheapens the product, makes it permanent, and increases churn. By discounting, you're ruining your pricing analysis.
You might also like

Hasan AboulHasan
3 years ago
High attachment products can help you earn money automatically.
Affiliate marketing is a popular online moneymaker. You promote others' products and get commissions. Affiliate marketing requires constant product promotion.
Affiliate marketing can be profitable even without much promotion. Yes, this is Autopilot Money.
How to Pick an Affiliate Program to Generate Income Autonomously
Autopilot moneymaking requires a recurring affiliate marketing program.
Finding the best product and testing it takes a lot of time and effort.
Here are three ways to choose the best service or product to promote:
Find a good attachment-rate product or service.
When choosing a product, ask if you can easily switch to another service. Attachment rate is how much people like a product.
Higher attachment rates mean better Autopilot products.
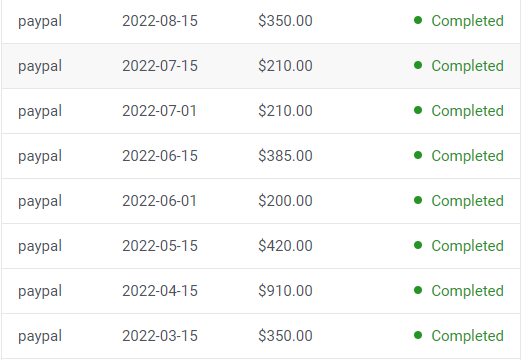
Consider promoting GetResponse. It's a 33% recurring commission email marketing tool. This means you get 33% of the customer's plan as long as he pays.
GetResponse has a high attachment rate because it's hard to leave and start over with another tool.
2. Pick a good or service with a lot of affiliate assets.
Check if a program has affiliate assets or creatives before joining.
Images and banners to promote the product in your business.
They save time; I look for promotional creatives. Creatives or affiliate assets are website banners or images. This reduces design time.
3. Select a service or item that consumers already adore.
New products are hard to sell. Choosing a trusted company's popular product or service is helpful.
As a beginner, let people buy a product they already love.
Online entrepreneurs and digital marketers love Systeme.io. It offers tools for creating pages, email marketing, funnels, and more. This product guarantees a high ROI.
Make the product known!
Affiliate marketers struggle to get traffic. Using affiliate marketing to make money is easier than you think if you have a solid marketing strategy.
Your plan should include:
1- Publish affiliate-related blog posts and SEO-optimize them
2- Sending new visitors product-related emails
3- Create a product resource page.
4-Review products
5-Make YouTube videos with links in the description.
6- Answering FAQs about your products and services on your blog and Quora.
7- Create an eCourse on how to use this product.
8- Adding Affiliate Banners to Your Website.
With these tips, you can promote your products and make money on autopilot.

Raad Ahmed
4 years ago
How We Just Raised $6M At An $80M Valuation From 100+ Investors Using A Link (Without Pitching)
Lawtrades nearly failed three years ago.
We couldn't raise Series A or enthusiasm from VCs.
We raised $6M (at a $80M valuation) from 100 customers and investors using a link and no pitching.
Step-by-step:
We refocused our business first.
Lawtrades raised $3.7M while Atrium raised $75M. By comparison, we seemed unimportant.
We had to close the company or try something new.
As I've written previously, a pivot saved us. Our initial focus on SMBs attracted many unprofitable customers. SMBs needed one-off legal services, meaning low fees and high turnover.
Tech startups were different. Their General Councels (GCs) needed near-daily support, resulting in higher fees and lower churn than SMBs.
We stopped unprofitable customers and focused on power users. To avoid dilution, we borrowed against receivables. We scaled our revenue 10x, from $70k/mo to $700k/mo.
Then, we reconsidered fundraising (and do it differently)
This time was different. Lawtrades was cash flow positive for most of last year, so we could dictate our own terms. VCs were still wary of legaltech after Atrium's shutdown (though they were thinking about the space).
We neither wanted to rely on VCs nor dilute more than 10% equity. So we didn't compete for in-person pitch meetings.
AngelList Roll-Up Vehicle (RUV). Up to 250 accredited investors can invest in a single RUV. First, we emailed customers the RUV. Why? Because I wanted to help the platform's users.
Imagine if Uber or Airbnb let all drivers or Superhosts invest in an RUV. Humans make the platform, theirs and ours. Giving people a chance to invest increases their loyalty.
We expanded after initial interest.
We created a Journey link, containing everything that would normally go in an investor pitch:
- Slides
- Trailer (from me)
- Testimonials
- Product demo
- Financials
We could also link to our AngelList RUV and send the pitch to an unlimited number of people. Instead of 1:1, we had 1:10,000 pitches-to-investors.
We posted Journey's link in RUV Alliance Discord. 600 accredited investors noticed it immediately. Within days, we raised $250,000 from customers-turned-investors.
Stonks, which live-streamed our pitch to thousands of viewers, was interested in our grassroots enthusiasm. We got $1.4M from people I've never met.
These updates on Pump generated more interest. Facebook, Uber, Netflix, and Robinhood executives all wanted to invest. Sahil Lavingia, who had rejected us, gave us $100k.
We closed the round with public support.
Without a single pitch meeting, we'd raised $2.3M. It was a result of natural enthusiasm: taking care of the people who made us who we are, letting them move first, and leveraging their enthusiasm with VCs, who were interested.
We used network effects to raise $3.7M from a founder-turned-VC, bringing the total to $6M at a $80M valuation (which, by the way, I set myself).
What flipping the fundraising script allowed us to do:
We started with private investors instead of 2–3 VCs to show VCs what we were worth. This gave Lawtrades the ability to:
- Without meetings, share our vision. Many people saw our Journey link. I ended up taking meetings with people who planned to contribute $50k+, but still, the ratio of views-to-meetings was outrageously good for us.
- Leverage ourselves. Instead of us selling ourselves to VCs, they did. Some people with large checks or late arrivals were turned away.
- Maintain voting power. No board seats were lost.
- Utilize viral network effects. People-powered.
- Preemptively halt churn by turning our users into owners. People are more loyal and respectful to things they own. Our users make us who we are — no matter how good our tech is, we need human beings to use it. They deserve to be owners.
I don't blame founders for being hesitant about this approach. Pump and RUVs are new and scary. But it won’t be that way for long. Our approach redistributed some of the power that normally lies entirely with VCs, putting it into our hands and our network’s hands.
This is the future — another way power is shifting from centralized to decentralized.

Ben Carlson
4 years ago
Bear market duration and how to invest during one
Bear markets don't last forever, but that's hard to remember. Jamie Cullen's illustration
A bear market is a 20% decline from peak to trough in stock prices.
The S&P 500 was down 24% from its January highs at its low point this year. Bear market.
The U.S. stock market has had 13 bear markets since WWII (including the current one). Previous 12 bear markets averaged –32.7% losses. From peak to trough, the stock market averaged 12 months. The average time from bottom to peak was 21 months.
In the past seven decades, a bear market roundtrip to breakeven has averaged less than three years.
Long-term averages can vary widely, as with all historical market data. Investors can learn from past market crashes.
Historical bear markets offer lessons.
Bear market duration
A bear market can cost investors money and time. Most of the pain comes from stock market declines, but bear markets can be long.
Here are the longest U.S. stock bear markets since World war 2:
Stock market crashes can make it difficult to break even. After the 2008 financial crisis, the stock market took 4.5 years to recover. After the dotcom bubble burst, it took seven years to break even.
The longer you're underwater in the market, the more suffering you'll experience, according to research. Suffering can lead to selling at the wrong time.
Bear markets require patience because stocks can take a long time to recover.
Stock crash recovery
Bear markets can end quickly. The Corona Crash in early 2020 is an example.
The S&P 500 fell 34% in 23 trading sessions, the fastest bear market from a high in 90 years. The entire crash lasted one month. Stocks broke even six months after bottoming. Stocks rose 100% from those lows in 15 months.
Seven bear markets have lasted two years or less since 1945.
The 2020 recovery was an outlier, but four other bear markets have made investors whole within 18 months.
During a bear market, you don't know if it will end quickly or feel like death by a thousand cuts.
Recessions vs. bear markets
Many people believe the U.S. economy is in or heading for a recession.
I agree. Four-decade high inflation. Since 1945, inflation has exceeded 5% nine times. Each inflationary spike caused a recession. Only slowing economic demand seems to stop price spikes.
This could happen again. Stocks seem to be pricing in a recession.
Recessions almost always cause a bear market, but a bear market doesn't always equal a recession. In 1946, the stock market fell 27% without a recession in sight. Without an economic slowdown, the stock market fell 22% in 1966. Black Monday in 1987 was the most famous stock market crash without a recession. Stocks fell 30% in less than a week. Many believed the stock market signaled a depression. The crash caused no slowdown.
Economic cycles are hard to predict. Even Wall Street makes mistakes.
Bears vs. bulls
Bear markets for U.S. stocks always end. Every stock market crash in U.S. history has been followed by new all-time highs.
How should investors view the recession? Investing risk is subjective.
You don't have as long to wait out a bear market if you're retired or nearing retirement. Diversification and liquidity help investors with limited time or income. Cash and short-term bonds drag down long-term returns but can ensure short-term spending.
Young people with years or decades ahead of them should view this bear market as an opportunity. Stock market crashes are good for net savers in the future. They let you buy cheap stocks with high dividend yields.
You need discipline, patience, and planning to buy stocks when it doesn't feel right.
Bear markets aren't fun because no one likes seeing their portfolio fall. But stock market downturns are a feature, not a bug. If stocks never crashed, they wouldn't offer such great long-term returns.