


More on Personal Growth

Theo Seeds
3 years ago
The nine novels that have fundamentally altered the way I view the world
I read 53 novels last year and hope to do so again.
Books are best if you love learning. You get a range of perspectives, unlike podcasts and YouTube channels where you get the same ones.
Book quality varies. I've read useless books. Most books teach me something.

These 9 novels have changed my outlook in recent years. They've made me rethink what I believed or introduced me to a fresh perspective that changed my worldview.
You can order these books yourself. Or, read my summaries to learn what I've synthesized.
Enjoy!
Fooled By Randomness
Nassim Taleb worked as a Wall Street analyst. He used options trading to bet on unlikely events like stock market crashes.
Using financial models, investors predict stock prices. The models assume constant, predictable company growth.
These models base their assumptions on historical data, so they assume the future will be like the past.
Fooled By Randomness argues that the future won't be like the past. We often see impossible market crashes like 2008's housing market collapse. The world changes too quickly to use historical data: by the time we understand how it works, it's changed.
Most people don't live to see history unfold. We think our childhood world will last forever. That goes double for stable societies like the U.S., which hasn't seen major turbulence in anyone's lifetime.
Fooled By Randomness taught me to expect the unexpected. The world is deceptive and rarely works as we expect. You can't always trust your past successes or what you've learned.
Antifragile
More Taleb. Some things, like the restaurant industry and the human body, improve under conditions of volatility and turbulence.
We didn't have a word for this counterintuitive concept until Taleb wrote Antifragile. The human body (which responds to some stressors, like exercise, by getting stronger) and the restaurant industry both benefit long-term from disorder (when economic turbulence happens, bad restaurants go out of business, improving the industry as a whole).
Many human systems are designed to minimize short-term variance because humans don't understand it. By eliminating short-term variation, we increase the likelihood of a major disaster.
Once, we put out every forest fire we found. Then, dead wood piled up in forests, causing catastrophic fires.
We don't like price changes, so politicians prop up markets with stimulus packages and printing money. This leads to a bigger crash later. Two years ago, we printed a ton of money for stimulus checks, and now we have double-digit inflation.
Antifragile taught me how important Plan B is. A system with one or two major weaknesses will fail. Make large systems redundant, foolproof, and change-responsive.
Reality is broken
We dread work. Work is tedious. Right?
Wrong. Work gives many people purpose. People are happiest when working. (That's why some are workaholics.)
Factory work saps your soul, office work is boring, and working for a large company you don't believe in and that operates unethically isn't satisfying.
Jane McGonigal says in Reality Is Broken that meaningful work makes us happy. People love games because they simulate good work. McGonigal says work should be more fun.
Some think they'd be happy on a private island sipping cocktails all day. That's not true. Without anything to do, most people would be bored. Unemployed people are miserable. Many retirees die within 2 years, much more than expected.
Instead of complaining, find meaningful work. If you don't like your job, it's because you're in the wrong environment. Find the right setting.
The Lean Startup
Before the airplane was invented, Harvard scientists researched flying machines. Who knew two North Carolina weirdos would beat them?
The Wright Brothers' plane design was key. Harvard researchers were mostly theoretical, designing an airplane on paper and trying to make it fly in theory. They'd build it, test it, and it wouldn't fly.
The Wright Brothers were different. They'd build a cheap plane, test it, and it'd crash. Then they'd learn from their mistakes, build another plane, and it'd crash.
They repeated this until they fixed all the problems and one of their planes stayed aloft.
Mistakes are considered bad. On the African savannah, one mistake meant death. Even today, if you make a costly mistake at work, you'll be fired as a scapegoat. Most people avoid failing.
In reality, making mistakes is the best way to learn.
Eric Reis offers an unintuitive recipe in The Lean Startup: come up with a hypothesis, test it, and fail. Then, try again with a new hypothesis. Keep trying, learning from each failure.
This is a great startup strategy. Startups are new businesses. Startups face uncertainty. Run lots of low-cost experiments to fail, learn, and succeed.
Don't fear failing. Low-cost failure is good because you learn more from it than you lose. As long as your worst-case scenario is acceptable, risk-taking is good.
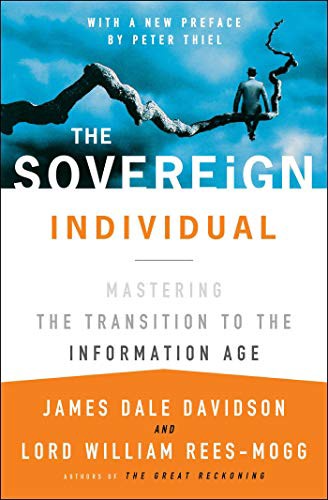
The Sovereign Individual
Today, nation-states rule the world. The UN recognizes 195 countries, and they claim almost all land outside of Antarctica.
We agree. For the past 2,000 years, much of the world's territory was ungoverned.
Why today? Because technology has created incentives for nation-states for most of the past 500 years. The logic of violence favors nation-states, according to James Dale Davidson, author of the Sovereign Individual. Governments have a lot to gain by conquering as much territory as possible, so they do.
Not always. During the Dark Ages, Europe was fragmented and had few central governments. Partly because of armor. With armor, a sword, and a horse, you couldn't be stopped. Large states were hard to form because they rely on the threat of violence.
When gunpowder became popular in Europe, violence changed. In a world with guns, assembling large armies and conquest are cheaper.
James Dale Davidson says the internet will make nation-states obsolete. Most of the world's wealth will be online and in people's heads, making capital mobile.
Nation-states rely on predatory taxation of the rich to fund large militaries and welfare programs.
When capital is mobile, people can live anywhere in the world, Davidson says, making predatory taxation impossible. They're not bound by their job, land, or factory location. Wherever they're treated best.
Davidson says that over the next century, nation-states will collapse because they won't have enough money to operate as they do now. He imagines a world of small city-states, like Italy before 1900. (or Singapore today).
We've already seen some movement toward a more Sovereign Individual-like world. The pandemic proved large-scale remote work is possible, freeing workers from their location. Many cities and countries offer remote workers incentives to relocate.
Many Western businesspeople live in tax havens, and more people are renouncing their US citizenship due to high taxes. Increasing globalization has led to poor economic conditions and resentment among average people in the West, which is why politicians like Trump and Sanders rose to popularity with angry rhetoric, even though Obama rose to popularity with a more hopeful message.
The Sovereign Individual convinced me that the future will be different than Nassim Taleb's. Large countries like the U.S. will likely lose influence in the coming decades, while Portugal, Singapore, and Turkey will rise. If the trend toward less freedom continues, people may flee the West en masse.
So a traditional life of college, a big firm job, hard work, and corporate advancement may not be wise. Young people should learn as much as possible and develop flexible skills to adapt to the future.
Sapiens
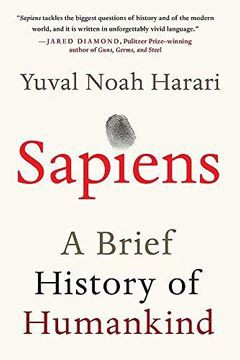
Sapiens is a history of humanity, from proto-humans in Ethiopia to our internet society today, with some future speculation.
Sapiens views humans (and Homo sapiens) as a unique species on Earth. We were animals 100,000 years ago. We're slowly becoming gods, able to affect the climate, travel to every corner of the Earth (and the Moon), build weapons that can kill us all, and wipe out thousands of species.
Sapiens examines what makes Homo sapiens unique. Humans can believe in myths like religion, money, and human-made entities like countries and LLCs.
These myths facilitate large-scale cooperation. Ants from the same colony can cooperate. Any two humans can trade, though. Even if they're not genetically related, large groups can bond over religion and nationality.
Combine that with intelligence, and you have a species capable of amazing feats.
Sapiens may make your head explode because it looks at the world without presupposing values, unlike most books. It questions things that aren't usually questioned and says provocative things.
It also shows how human history works. It may help you understand and predict the world. Maybe.
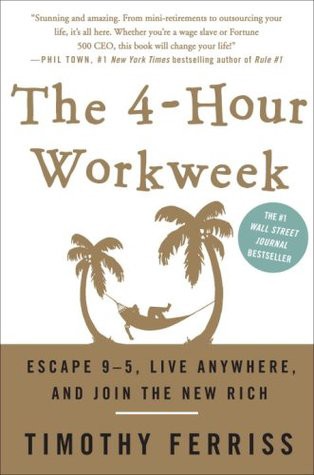
The 4-hour Workweek
Things can be done better.
Tradition, laziness, bad bosses, or incentive structures cause complacency. If you're willing to make changes and not settle for the status quo, you can do whatever you do better and achieve more in less time.
The Four-Hour Work Week advocates this. Tim Ferriss explains how he made more sales in 2 hours than his 8-hour-a-day colleagues.
By firing 2 of his most annoying customers and empowering his customer service reps to make more decisions, he was able to leave his business and travel to Europe.
Ferriss shows how to escape your 9-to-5, outsource your life, develop a business that feeds you with little time, and go on mini-retirement adventures abroad.
Don't accept the status quo. Instead, level up. Find a way to improve your results. And try new things.
Why Nations Fail
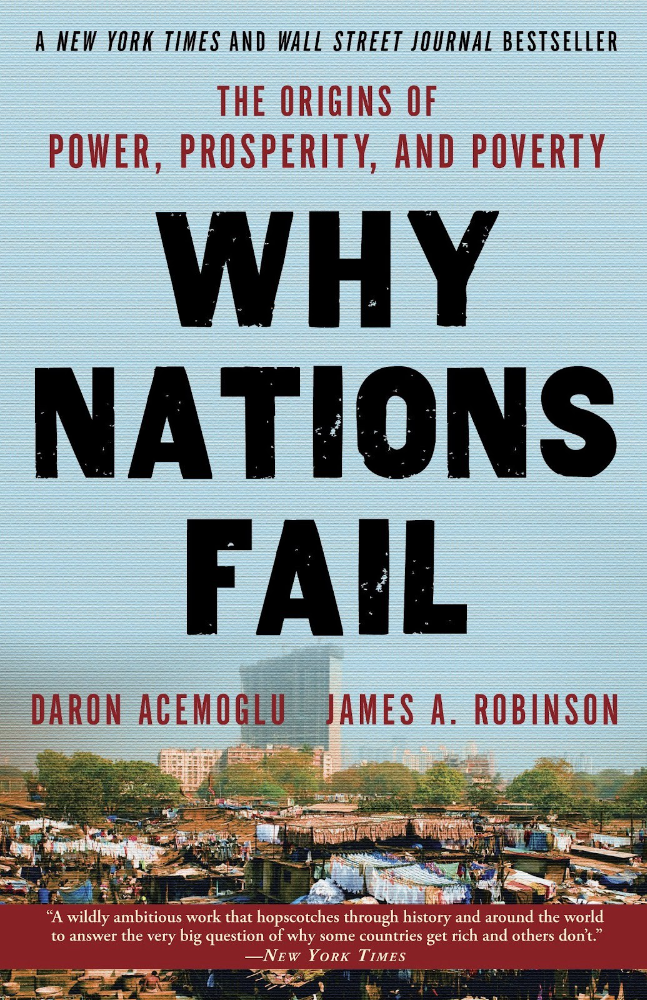
Nogales, Arizona and Mexico were once one town. The US/Mexico border was arbitrarily drawn.
Both towns have similar cultures and populations. Nogales, Arizona is well-developed and has a high standard of living. Nogales, Mexico is underdeveloped and has a low standard of living. Whoa!
Why Nations Fail explains how government-created institutions affect country development. Strong property rights, capitalism, and non-corrupt governments promote development. Countries without capitalism, strong property rights, or corrupt governments don't develop.
Successful countries must also embrace creative destruction. They must offer ordinary citizens a way to improve their lot by creating value for others, not reducing them to slaves, serfs, or peasants. Authors say that ordinary people could get rich on trading expeditions in 11th-century Venice.
East and West Germany and North and South Korea have different economies because their citizens are motivated differently. It explains why Chile, China, and Singapore grow so quickly after becoming market economies.
People have spent a lot of money on third-world poverty. According to Why Nations Fail, education and infrastructure aren't the answer. Developing nations must adopt free-market economic policies.
Elon Musk
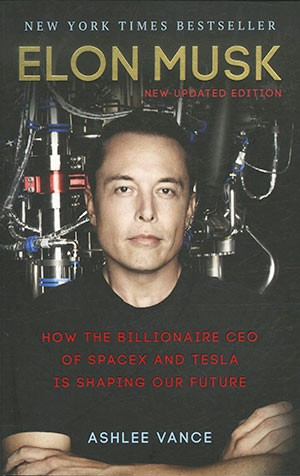
Elon Musk is the world's richest man, but that’s not a good way to describe him. Elon Musk is the world's richest man, which is like calling Steve Jobs a turtleneck-wearer or Benjamin Franklin a printer.
Elon Musk does cool sci-fi stuff to help humanity avoid existential threats.
Oil will run out. We've delayed this by developing better extraction methods. We only have so much nonrenewable oil.
Our society is doomed if it depends on oil. Elon Musk invested heavily in Tesla and SolarCity to speed the shift to renewable energy.
Musk worries about AI: we'll build machines smarter than us. We won't be able to stop these machines if something goes wrong, just like cows can't fight humans. Neuralink: we need to be smarter to compete with AI when the time comes.
If Earth becomes uninhabitable, we need a backup plan. Asteroid or nuclear war could strike Earth at any moment. We may not have much time to react if it happens in a few days. We must build a new civilization while times are good and resources are plentiful.
Short-term problems dominate our politics, but long-term issues are more important. Long-term problems can cause mass casualties and homelessness. Musk demonstrates how to think long-term.
The main reason people are impressed by Elon Musk, and why Ashlee Vances' biography influenced me so much, is that he does impossible things.
Electric cars were once considered unprofitable, but Tesla has made them mainstream. SpaceX is the world's largest private space company.
People lack imagination and dismiss ununderstood ideas as impossible. Humanity is about pushing limits. Don't worry if your dreams seem impossible. Try it.
Thanks for reading.

Alex Mathers
3 years ago Draft
12 practices of the zenith individuals I know

Calmness is a vital life skill.
It aids communication. It boosts creativity and performance.
I've studied calm people's habits for years. Commonalities:
Have learned to laugh at themselves.
Those who have something to protect can’t help but make it a very serious business, which drains the energy out of the room.
They are fixated on positive pursuits like making cool things, building a strong physique, and having fun with others rather than on depressing influences like the news and gossip.
Every day, spend at least 20 minutes moving, whether it's walking, yoga, or lifting weights.
Discover ways to take pleasure in life's challenges.
Since perspective is malleable, they change their view.
Set your own needs first.
Stressed people neglect themselves and wonder why they struggle.
Prioritize self-care.
Don't ruin your life to please others.
Make something.
Calm people create more than react.
They love creating beautiful things—paintings, children, relationships, and projects.
Hold your breath, please.
If you're stressed or angry, you may be surprised how much time you spend holding your breath and tightening your belly.
Release, breathe, and relax to find calm.
Stopped rushing.
Rushing is disadvantageous.
Calm people handle life better.
Are attuned to their personal dietary needs.
They avoid junk food and eat foods that keep them healthy, happy, and calm.
Don’t take anything personally.
Stressed people control everything.
Self-conscious.
Calm people put others and their work first.
Keep their surroundings neat.
Maintaining an uplifting and clutter-free environment daily calms the mind.
Minimise negative people.
Calm people are ruthless with their boundaries and avoid negative and drama-prone people.

Katrine Tjoelsen
3 years ago
8 Communication Hacks I Use as a Young Employee
Learn these subtle cues to gain influence.
Hate being ignored?
As a 24-year-old, I struggled at work. Attention-getting tips How to avoid being judged by my size, gender, and lack of wrinkles or gray hair?
I've learned seniority hacks. Influence. Within two years as a product manager, I led a team. I'm a Stanford MBA student.
These communication hacks can make you look senior and influential.
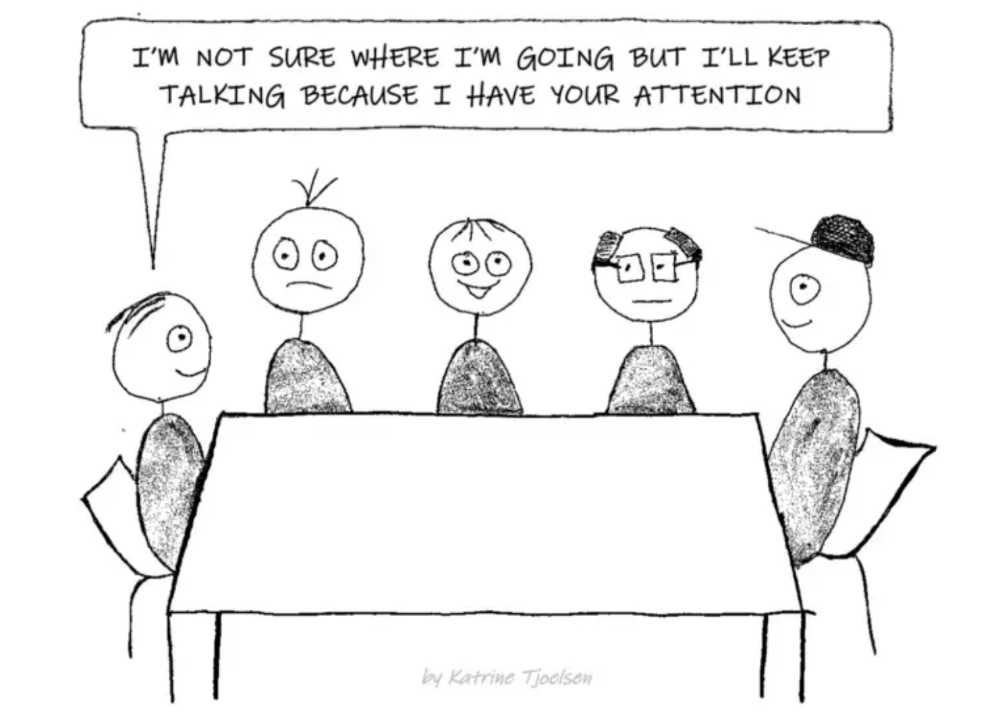
1. Slowly speak
We speak quickly because we're afraid of being interrupted.
When I doubt my ideas, I speak quickly. How can we slow down? Jamie Chapman says speaking slowly saps our energy.
Chapman suggests emphasizing certain words and pausing.
2. Interrupted? Stop the stopper
Someone interrupt your speech?
Don't wait. "May I finish?" No pause needed. Stop interrupting. I first tried this in Leadership Laboratory at Stanford. How quickly I gained influence amazed me.
Next time, try “May I finish?” If that’s not enough, try these other tips from Wendy R.S. O’Connor.
3. Context
Others don't always see what's obvious to you.
Through explanation, you help others see the big picture. If a senior knows it, you help them see where your work fits.
4. Don't ask questions in statements
“Your statement lost its effect when you ended it on a high pitch,” a group member told me. Upspeak, it’s called. I do it when I feel uncertain.
Upspeak loses influence and credibility. Unneeded. When unsure, we can say "I think." We can even ask a proper question.
Someone else's boasting is no reason to be dismissive. As leaders and colleagues, we should listen to our colleagues even if they use this speech pattern.
Give your words impact.
5. Signpost structure
Signposts improve clarity by providing structure and transitions.
Communication coach Alexander Lyon explains how to use "first," "second," and "third" He explains classic and summary transitions to help the listener switch topics.
Signs clarify. Clarity matters.
6. Eliminate email fluff
“Fine. When will the report be ready? — Jeff.”
Notice how senior leaders write short, direct emails? I often use formalities like "dear," "hope you're well," and "kind regards"
Formality is (usually) unnecessary.
7. Replace exclamation marks with periods
See how junior an exclamation-filled email looks:
Hi, all!
Hope you’re as excited as I am for tomorrow! We’re celebrating our accomplishments with cake! Join us tomorrow at 2 pm!
See you soon!
Why the exclamation points? Why not just one?
Hi, all.
Hope you’re as excited as I am for tomorrow. We’re celebrating our accomplishments with cake. Join us tomorrow at 2 pm!
See you soon.
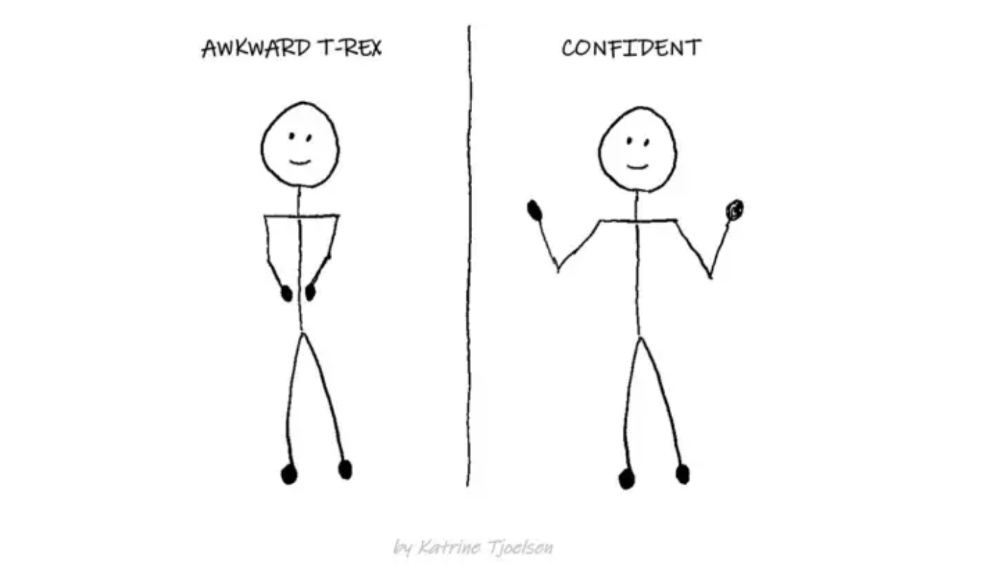
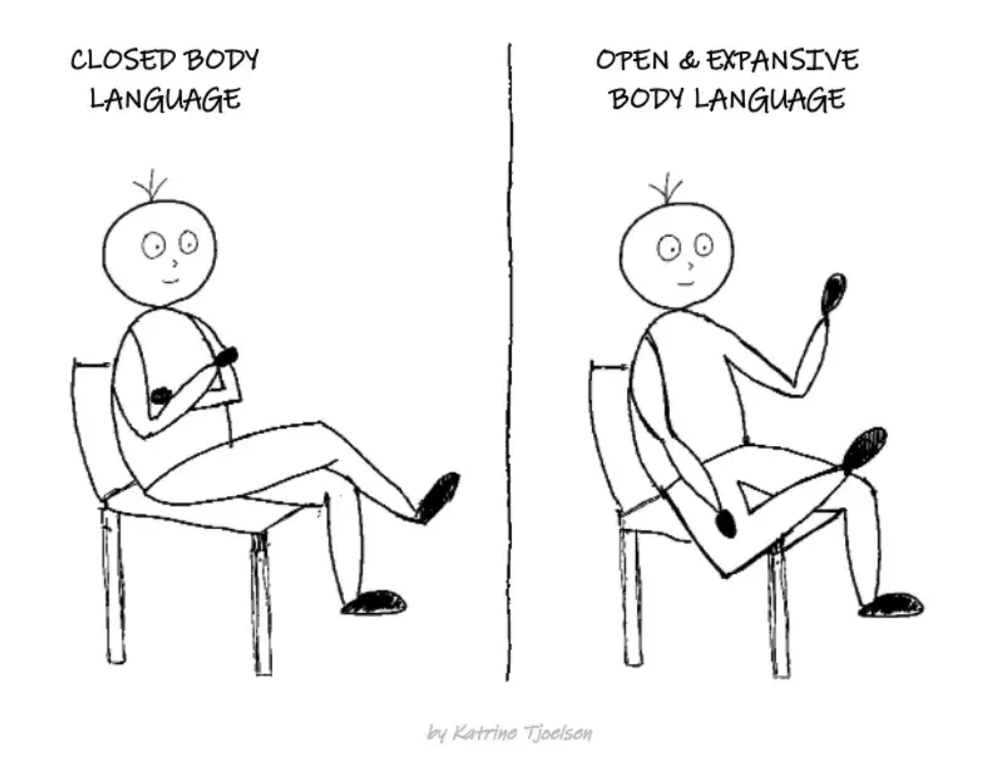
8. Take space
"Playing high" means having an open, relaxed body, says Stanford professor and author Deborah Gruenfield.
Crossed legs or looking small? Relax. Get bigger.
You might also like

Caspar Mahoney
3 years ago
Changing Your Mindset From a Project to a Product
Product game mindsets? How do these vary from Project mindset?

1950s spawned the Iron Triangle. Project people everywhere know and live by it. In stakeholder meetings, it is used to stretch the timeframe, request additional money, or reduce scope.
Quality was added to this triangle as things matured.
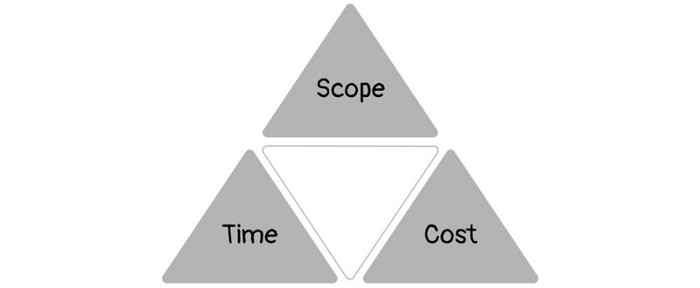
Quality was intended to be transformative, but none of these principles addressed why we conduct projects.
Value and benefits are key.
Product value is quantified by ROI, revenue, profit, savings, or other metrics. For me, every project or product delivery is about value.
Most project managers, especially those schooled 5-10 years or more ago (thousands working in huge corporations worldwide), understand the world in terms of the iron triangle. What does that imply? They worry about:
a) enough time to get the thing done.
b) have enough resources (budget) to get the thing done.
c) have enough scope to fit within (a) and (b) >> note, they never have too little scope, not that I have ever seen! although, theoretically, this could happen.
Boom—iron triangle.
To make the triangle function, project managers will utilize formal governance (Steering) to move those things. Increase money, scope, or both if time is short. Lacking funds? Increase time, scope, or both.
In current product development, shifting each item considerably may not yield value/benefit.
Even terrible. This approach will fail because it deprioritizes Value/Benefit by focusing the major stakeholders (Steering participants) and delivery team(s) on Time, Scope, and Budget restrictions.
Pre-agile, this problem was terrible. IT projects failed wildly. History is here.
Value, or benefit, is central to the product method. Product managers spend most of their time planning value-delivery paths.
Product people consider risk, schedules, scope, and budget, but value comes first. Let me illustrate.
Imagine managing internal products in an enterprise. Your core customer team needs a rapid text record of a chat to fix a problem. The consumer wants a feature/features added to a product you're producing because they think it's the greatest spot.
Project-minded, I may say;
Ok, I have budget as this is an existing project, due to run for a year. This is a new requirement to add to the features we’re already building. I think I can keep the deadline, and include this scope, as it sounds related to the feature set we’re building to give the desired result”.
This attitude repeats Scope, Time, and Budget.
Since it meets those standards, a project manager will likely approve it. If they have a backlog, they may add it and start specking it out assuming it will be built.
Instead, think like a product;
What problem does this feature idea solve? Is that problem relevant to the product I am building? Can that problem be solved quicker/better via another route ? Is it the most valuable problem to solve now? Is the problem space aligned to our current or future strategy? or do I need to alter/update the strategy?
A product mindset allows you to focus on timing, resource/cost, feasibility, feature detail, and so on after answering the aforementioned questions.
The above oversimplifies because
Leadership in discovery

Project managers are facilitators of ideas. This is as far as they normally go in the ‘idea’ space.
Business Requirements collection in classic project delivery requires extensive upfront documentation.
Agile project delivery analyzes requirements iteratively.
However, the project manager is a facilitator/planner first and foremost, therefore topic knowledge is not expected.
I mean business domain, not technical domain (to confuse matters, it is true that in some instances, it can be both technical and business domains that are important for a single individual to master).
Product managers are domain experts. They will become one if they are training/new.
They lead discovery.
Product Manager-led discovery is much more than requirements gathering.
Requirements gathering involves a Business Analyst interviewing people and documenting their requests.
The project manager calculates what fits and what doesn't using their Iron Triangle (presumably in their head) and reports back to Steering.
If this requirements-gathering exercise failed to identify requirements, what would a project manager do? or bewildered by project requirements and scope?
They would tell Steering they need a Business SME or Business Lead assigning or more of their time.
Product discovery requires the Product Manager's subject knowledge and a new mindset.
How should a Product Manager handle confusing requirements?
Product Managers handle these challenges with their talents and tools. They use their own knowledge to fill in ambiguity, but they have the discipline to validate those assumptions.
To define the problem, they may perform qualitative or quantitative primary research.
They might discuss with UX and Engineering on a whiteboard and test assumptions or hypotheses.
Do Product Managers escalate confusing requirements to Steering/Senior leaders? They would fix that themselves.
Product managers raise unclear strategy and outcomes to senior stakeholders. Open talks, soft skills, and data help them do this. They rarely raise requirements since they have their own means of handling them without top stakeholder participation.
Discovery is greenfield, exploratory, research-based, and needs higher-order stakeholder management, user research, and UX expertise.
Product Managers also aid discovery. They lead discovery. They will not leave customer/user engagement to a Business Analyst. Administratively, a business analyst could aid. In fact, many product organizations discourage business analysts (rely on PM, UX, and engineer involvement with end-users instead).
The Product Manager must drive user interaction, research, ideation, and problem analysis, therefore a Product professional must be skilled and confident.
Creating vs. receiving and having an entrepreneurial attitude

Product novices and project managers focus on details rather than the big picture. Project managers prefer spreadsheets to strategy whiteboards and vision statements.
These folks ask their manager or senior stakeholders, "What should we do?"
They then elaborate (in Jira, in XLS, in Confluence or whatever).
They want that plan populated fast because it reduces uncertainty about what's going on and who's supposed to do what.
Skilled Product Managers don't only ask folks Should we?
They're suggesting this, or worse, Senior stakeholders, here are some options. After asking and researching, they determine what value this product adds, what problems it solves, and what behavior it changes.
Therefore, to move into Product, you need to broaden your view and have courage in your ability to discover ideas, find insightful pieces of information, and collate them to form a valuable plan of action. You are constantly defining RoI and building Business Cases, so much so that you no longer create documents called Business Cases, it is simply ingrained in your work through metrics, intelligence, and insights.
Product Management is not a free lunch.
Plateless.
Plates and food must be prepared.
In conclusion, Product Managers must make at least three mentality shifts:
You put value first in all things. Time, money, and scope are not as important as knowing what is valuable.
You have faith in the field and have the ability to direct the search. YYou facilitate, but you don’t just facilitate. You wouldn't want to limit your domain expertise in that manner.
You develop concepts, strategies, and vision. You are not a waiter or an inbox where other people can post suggestions; you don't merely ask folks for opinion and record it. However, you excel at giving things that aren't clearly spoken or written down physical form.

Tanya Aggarwal
3 years ago
What I learned from my experience as a recent graduate working in venture capital

Every week I meet many people interested in VC. Many of them ask me what it's like to be a junior analyst in VC or what I've learned so far.
Looking back, I've learned many things as a junior VC, having gone through an almost-euphoric peak bull market, failed tech IPOs of 2019 including WeWorks' catastrophic fall, and the beginnings of a bearish market.
1. Network, network, network!
VCs spend 80% of their time networking. Junior VCs source deals or manage portfolios. You spend your time bringing startups to your fund or helping existing portfolio companies grow. Knowing stakeholders (corporations, star talent, investors) in your particular areas of investment helps you develop your portfolio.
Networking was one of my strengths. When I first started in the industry, I'd go to startup events and meet 50 people a month. Over time, I realized these relationships were shallow and I was only getting business cards. So I stopped seeing networking as a transaction. VC is a long-term game, so you should work with people you like. Now I know who I click with and can build deeper relationships with them. My network is smaller but more valuable than before.
2. The Most Important Metric Is Founder
People often ask how we pick investments. Why some companies can raise money and others can't is a mystery. The founder is the most important metric for VCs. When a company is young, the product, environment, and team all change, but the founder remains constant. VCs bet on the founder, not the company.
How do we decide which founders are best after 2-3 calls? When looking at a founder's profile, ask why this person can solve this problem. The founders' track record will tell. If the founder is a serial entrepreneur, you know he/she possesses the entrepreneur DNA and will likely succeed again. If it's his/her first startup, focus on industry knowledge to deliver the best solution.
3. A company's fate can be determined by macrotrends.
Macro trends are crucial. A company can have the perfect product, founder, and team, but if it's solving the wrong problem, it won't succeed. I've also seen average companies ride the wave to success. When you're on the right side of a trend, there's so much demand that more companies can get a piece of the pie.
In COVID-19, macro trends made or broke a company. Ed-tech and health-tech companies gained unicorn status and raised funding at inflated valuations due to sudden demand. With the easing of pandemic restrictions and the start of a bear market, many of these companies' valuations are in question.
4. Look for methods to ACTUALLY add value.
You only need to go on VC twitter (read: @vcstartterkit and @vcbrags) for 5 minutes or look at fin-meme accounts on Instagram to see how much VCs claim to add value but how little they actually do. VC is a long-term game, though. Long-term, founders won't work with you if you don't add value.
How can we add value when we're young and have no network? Leaning on my strengths helped me. Instead of viewing my age and limited experience as a disadvantage, I realized that I brought a unique perspective to the table.
As a VC, you invest in companies that will be big in 5-7 years, and millennials and Gen Z will have the most purchasing power. Because you can relate to that market, you can offer insights that most Partners at 40 can't. I added value by helping with hiring because I had direct access to university talent pools and by finding university students for product beta testing.
5. Develop your personal brand.
Generalists or specialists run most funds. This means that funds either invest across industries or have a specific mandate. Most funds are becoming specialists, I've noticed. Top-tier founders don't lack capital, so funds must find other ways to attract them. Why would a founder work with a generalist fund when a specialist can offer better industry connections and partnership opportunities?
Same for fund members. Founders want quality investors. Become a thought leader in your industry to meet founders. Create content and share your thoughts on industry-related social media. When I first started building my brand, I found it helpful to interview industry veterans to create better content than I could on my own. Over time, my content attracted quality founders so I didn't have to look for them.
These are my biggest VC lessons. This list isn't exhaustive, but it's my industry survival guide.

Aaron Dinin, PhD
2 years ago
The Advantages and Disadvantages of Having Investors Sign Your NDA
Startup entrepreneurs assume what risks when pitching?

Last week I signed four NDAs.
Four!
NDA stands for non-disclosure agreement. A legal document given to someone receiving confidential information. By signing, the person pledges not to share the information for a certain time. If they do, they may be in breach of contract and face legal action.
Companies use NDAs to protect trade secrets and confidential internal information from employees and contractors. Appropriate. If you manage a huge, successful firm, you don't want your employees selling their information to your competitors. To be true, business NDAs don't always prevent corporate espionage, but they usually make employees and contractors think twice before sharing.
I understand employee and contractor NDAs, but I wasn't asked to sign one. I counsel entrepreneurs, thus the NDAs I signed last week were from startups that wanted my feedback on their concepts.
I’m not a startup investor. I give startup guidance online. Despite that, four entrepreneurs thought their company ideas were so important they wanted me to sign a generically written legal form they probably acquired from a shady, spam-filled legal templates website before we could chat.
False. One company tried to get me to sign their NDA a few days after our conversation. I gently rejected, but their tenacity encouraged me. I considered sending retroactive NDAs to everyone I've ever talked to about one of my startups in case they establish a successful company based on something I said.
Two of the other three NDAs were from nearly identical companies. Good thing I didn't sign an NDA for the first one, else they may have sued me for talking to the second one as though I control the firms people pitch me.
I wasn't talking to the fourth NDA company. Instead, I received an unsolicited email from someone who wanted comments on their fundraising pitch deck but required me to sign an NDA before sending it.
That's right, before I could read a random Internet stranger's unsolicited pitch deck, I had to sign his NDA, potentially limiting my ability to discuss what was in it.
You should understand. Advisors, mentors, investors, etc. talk to hundreds of businesses each year. They cannot manage all the companies they deal with, thus they cannot risk legal trouble by talking to someone. Well, if I signed NDAs for all the startups I spoke with, half of the 300+ articles I've written on Medium over the past several years could get me sued into the next century because I've undoubtedly addressed topics in my articles that I discussed with them.
The four NDAs I received last week are part of a recent trend of entrepreneurs sending out NDAs before meetings, despite the practical and legal issues. They act like asking someone to sign away their right to talk about all they see and hear in a day is as straightforward as asking for a glass of water.
Given this inflow of NDAs, I wanted to briefly remind entrepreneurs reading this blog about the merits and cons of requesting investors (or others in the startup ecosystem) to sign your NDA.
Benefits of having investors sign your NDA include:
None. Zero. Nothing.
Disadvantages of requesting investor NDAs:
You'll come off as an amateur who has no idea what it takes to launch a successful firm.
Investors won't trust you with their money since you appear to be a complete amateur.
Printing NDAs will be a waste of paper because no genuine entrepreneur will ever sign one.
I apologize for missing any cons. Please leave your remarks.