


More on Leadership

Nir Zicherman
3 years ago
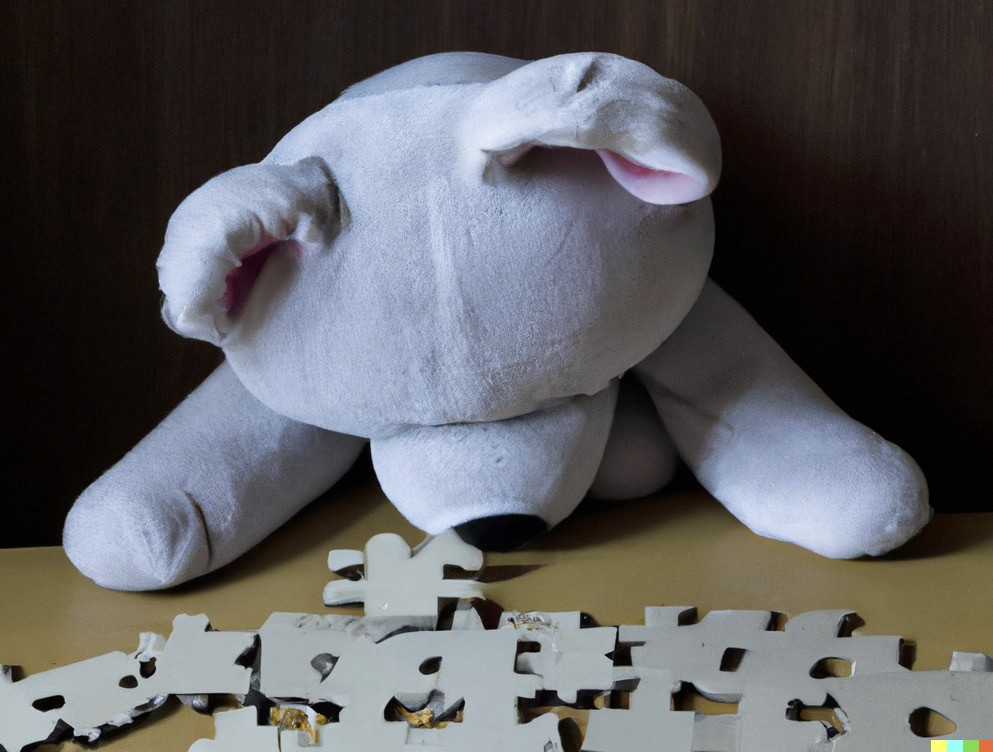
The Great Organizational Conundrum
Only two of the following three options can be achieved: consistency, availability, and partition tolerance
Someone told me that growing from 30 to 60 is the biggest adjustment for a team or business.
I remember thinking, That's random. Each company is unique. I've seen teams of all types confront the same issues during development periods. With new enterprises starting every year, we should be better at navigating growing difficulties.
As a team grows, its processes and systems break down, requiring reorganization or declining results. Why always? Why isn't there a perfect scaling model? Why hasn't that been found?
The Three Things Productive Organizations Must Have
Any company should be efficient and productive. Three items are needed:
First, it must verify that no two team members have conflicting information about the roadmap, strategy, or any input that could affect execution. Teamwork is required.
Second, it must ensure that everyone can receive the information they need from everyone else quickly, especially as teams become more specialized (an inevitability in a developing organization). It requires everyone's accessibility.
Third, it must ensure that the organization can operate efficiently even if a piece is unavailable. It's partition-tolerant.
From my experience with the many teams I've been on, invested in, or advised, achieving all three is nearly impossible. Why a perfect organization model cannot exist is clear after analysis.
The CAP Theorem: What is it?
Eric Brewer of Berkeley discovered the CAP Theorem, which argues that a distributed data storage should have three benefits. One can only have two at once.
The three benefits are consistency, availability, and partition tolerance, which implies that even if part of the system is offline, the remainder continues to work.
This notion is usually applied to computer science, but I've realized it's also true for human organizations. In a post-COVID world, many organizations are hiring non-co-located staff as they grow. CAP Theorem is more important than ever. Growing teams sometimes think they can develop ways to bypass this law, dooming themselves to a less-than-optimal team dynamic. They should adopt CAP to maximize productivity.
Path 1: Consistency and availability equal no tolerance for partitions
Let's imagine you want your team to always be in sync (i.e., for someone to be the source of truth for the latest information) and to be able to share information with each other. Only division into domains will do.
Numerous developing organizations do this, especially after the early stage (say, 30 people) when everyone may wear many hats and be aware of all the moving elements. After a certain point, it's tougher to keep generalists aligned than to divide them into specialized tasks.
In a specialized, segmented team, leaders optimize consistency and availability (i.e. every function is up-to-speed on the latest strategy, no one is out of sync, and everyone is able to unblock and inform everyone else).
Partition tolerance suffers. If any component of the organization breaks down (someone goes on vacation, quits, underperforms, or Gmail or Slack goes down), productivity stops. There's no way to give the team stability, availability, and smooth operation during a hiccup.
Path 2: Partition Tolerance and Availability = No Consistency
Some businesses avoid relying too heavily on any one person or sub-team by maximizing availability and partition tolerance (the organization continues to function as a whole even if particular components fail). Only redundancy can do that. Instead of specializing each member, the team spreads expertise so people can work in parallel. I switched from Path 1 to Path 2 because I realized too much reliance on one person is risky.
What happens after redundancy? Unreliable. The more people may run independently and in parallel, the less anyone can be the truth. Lack of alignment or updated information can lead to people executing slightly different strategies. So, resources are squandered on the wrong work.
Path 3: Partition and Consistency "Tolerance" equates to "absence"
The third, least-used path stresses partition tolerance and consistency (meaning answers are always correct and up-to-date). In this organizational style, it's most critical to maintain the system operating and keep everyone aligned. No one is allowed to read anything without an assurance that it's up-to-date (i.e. there’s no availability).
Always short-lived. In my experience, a business that prioritizes quality and scalability over speedy information transmission can get bogged down in heavy processes that hinder production. Large-scale, this is unsustainable.
Accepting CAP
When two puzzle pieces fit, the third won't. I've watched developing teams try to tackle these difficulties, only to find, as their ancestors did, that they can never be entirely solved. Idealized solutions fail in reality, causing lost effort, confusion, and lower production.
As teams develop and change, they should embrace CAP, acknowledge there is a limit to productivity in a scaling business, and choose the best two-out-of-three path.

Looi Qin En
3 years ago
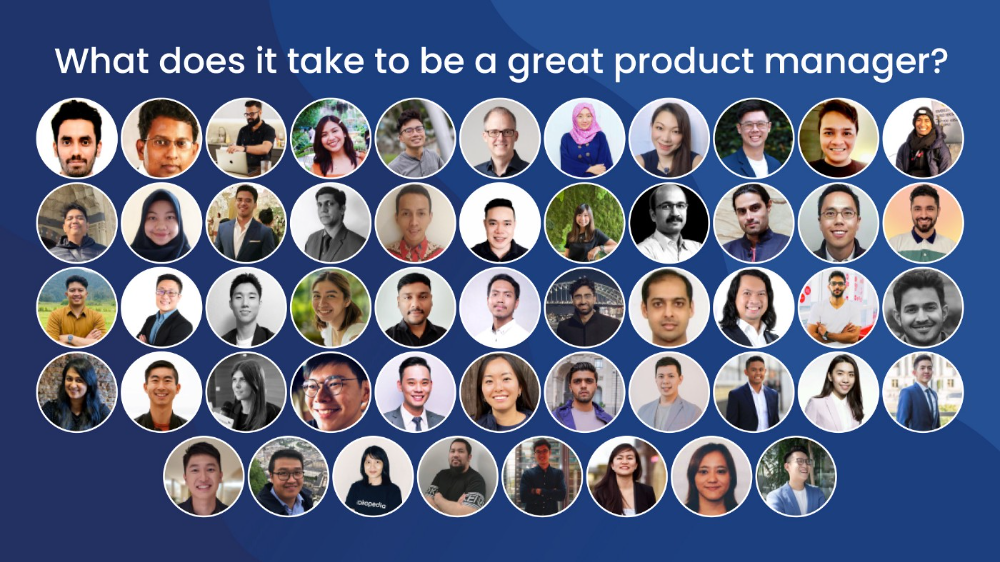
I polled 52 product managers to find out what qualities make a great Product Manager
Great technology opens up an universe of possibilities.
Need a friend? WhatsApp, Telegram, Slack, etc.
Traveling? AirBnB, Expedia, Google Flights, etc.
Money transfer? Use digital banking, e-wallet, or crypto applications
Products inspire us. How do we become great?
I asked product managers in my network:
What does it take to be a great product manager?
52 product managers from 40+ prominent IT businesses in Southeast Asia responded passionately. Many of the PMs I've worked with have built fantastic products, from unicorns (Lazada, Tokopedia, Ovo) to incumbents (Google, PayPal, Experian, WarnerMedia) to growing (etaily, Nium, Shipper).
TL;DR:
Soft talents are more important than hard skills. Technical expertise was hardly ever stressed by product managers, and empathy was mentioned more than ten times. Janani from Xendit expertly recorded the moment. A superb PM must comprehend that their empathy for the feelings of their users must surpass all logic and data.
Constant attention to the needs of the user. Many people concur that the closer a PM gets to their customer/user, the more likely it is that the conclusion will be better. There were almost 30 references to customers and users. Focusing on customers has the advantage because it is hard to overshoot, as Rajesh from Lazada puts it best.
Setting priorities is invaluable. Prioritization is essential because there are so many problems that a PM must deal with every day. My favorite quotation on this is from Rakuten user Yee Jie. Viki, A competent product manager extinguishes fires. A good product manager lets things burn and then prioritizes.
This summary isn't enough to capture what excellent PMs claim it requires. Read below!
What qualities make a successful product manager?
Themed quotes are alphabetized by author.
Embrace your user/customer
Aeriel Dela Paz, Rainmaking Venture Architect, ex-GCash Product Head
Great PMs know what customers need even when they don’t say it directly. It’s about reading between the lines and going through the numbers to address that need.
Anders Nordahl, OrkestraSCS's Product Manager
Understanding the vision of your customer is as important as to get the customer to buy your vision
Angel Mendoza, MetaverseGo's Product Head
Most people think that to be a great product manager, you must have technical know-how. It’s textbook and I do think it is helpful to some extent, but for me the secret sauce is EMPATHY — the ability to see and feel things from someone else’s perspective. You can’t create a solution without deeply understanding the problem.
Senior Product Manager, Tokopedia
Focus on delivering value and helping people (consumer as well as colleague) and everything else will follow
Darren Lau, Deloitte Digital's Head of Customer Experience
Start with the users, and work backwards. Don’t have a solution looking for a problem
Darryl Tan, Grab Product Manager
I would say that a great product manager is able to identify the crucial problems to solve through strong user empathy and synthesis of insights
Diego Perdana, Kitalulus Senior Product Manager
I think to be a great product manager you need to be obsessed with customer problems and most important is solve the right problem with the right solution
Senior Product Manager, AirAsia
Lot of common sense + Customer Obsession. The most important role of a Product manager is to bring clarity of a solution. Your product is good if it solves customer problems. Your product is great if it solves an eco-system problem and disrupts the business in a positive way.
Edward Xie, Mastercard Managing Consultant, ex-Shopee Product Manager
Perfect your product, but be prepared to compromise for right users
AVP Product, Shipper
For me, a great product manager need to be rational enough to find the business opportunities while obsessing the customers.
Janani Gopalakrishnan is a senior product manager of a stealth firm.
While as a good PM it’s important to be data-driven, to be a great PM one needs to understand that their empathy for their users’ emotions must exceed all logic and data. Great PMs also make these product discussions thrive within the team by intently listening to all the members thoughts and influence the team’s skin in the game positively.
Director, Product Management, Indeed
Great product managers put their users first. They discover problems that matter most to their users and inspire their team to find creative solutions.
Grab's Senior Product Manager Lakshay Kalra
Product management is all about finding and solving most important user problems
Quipper's Mega Puji Saraswati
First of all, always remember the value of “user first” to solve what user really needs (the main problem) for guidance to arrange the task priority and develop new ideas. Second, ownership. Treat the product as your “2nd baby”, and the team as your “2nd family”. Third, maintain a good communication, both horizontally and vertically. But on top of those, always remember to have a work — life balance, and know exactly the priority in life :)
Senior Product Manager, Prosa.AI Miswanto Miswanto
A great Product Manager is someone who can be the link between customer needs with the readiness and flexibility of the team. So that it can provide, build, and produce a product that is useful and helps the community to carry out their daily activities. And He/She can improve product quality ongoing basis or continuous to help provide solutions for users or our customer.
Lead Product Manager, Tokopedia, Oriza Wahyu Utami
Be a great listener, be curious and be determined. every great product manager have the ability to listen the pain points and understand the problems, they are always curious on the users feedback, and they also very determined to look for the solutions that benefited users and the business.
99 Group CPO Rajesh Sangati
The advantage of focusing on customers: it’s impossible to overshoot
Ray Jang, founder of Scenius, formerly of ByteDance
The difference between good and great product managers is that great product managers are willing to go the unsexy and unglamorous extra mile by rolling up their sleeves and ironing out all minutiae details of the product such that when the user uses the product, they can’t help but say “This was made for me.”
BCG Digital Ventures' Sid Narayanan
Great product managers ensure that what gets built and shipped is at the intersection of what creates value for the customer and for the business that’s building the product…often times, especially in today’s highly liquid funding environment, the unit economics, aka ensuring that what gets shipped creates value for the business and is sustainable, gets overlooked
Stephanie Brownlee, BCG Digital Ventures Product Manager
There is software in the world that does more harm than good to people and society. Great Product Managers build products that solve problems not create problems
Experiment constantly
Delivery Hero's Abhishek Muralidharan
Embracing your failure is the key to become a great Product Manager
DeliveryHero's Anuraag Burman
Product Managers should be thick skinned to deal with criticism and the stomach to take risk and face failures.
DataSpark Product Head Apurva Lawale
Great product managers enjoy the creative process with their team to deliver intuitive user experiences to benefit users.
Dexter Zhuang, Xendit Product Manager
The key to creating winning products is building what customers want as quickly as you can — testing and learning along the way.
PayPal's Jay Ko
To me, great product managers always remain relentlessly curious. They are empathetic leaders and problem solvers that glean customer insights into building impactful products
Home Credit Philippines' Jedd Flores
Great Product Managers are the best dreamers; they think of what can be possible for the customers, for the company and the positive impact that it will have in the industry that they’re part of
Set priorities first, foremost, foremost.
HBO Go Product Manager Akshay Ishwar
Good product managers strive to balance the signal to noise ratio, Great product managers know when to turn the dials for each up exactly
Zuellig Pharma's Guojie Su
Have the courage to say no. Managing egos and request is never easy and rejecting them makes it harder but necessary to deliver the best value for the customers.
Ninja Van's John Prawira
(1) PMs should be able to ruthlessly prioritize. In order to be effective, PMs should anchor their product development process with their north stars (success metrics) and always communicate with a purpose. (2) User-first when validating assumptions. PMs should validate assumptions early and often to manage risk when leading initiatives with a focus on generating the highest impact to solving a particular user pain-point. We can’t expect a product/feature launch to be perfect (there might be bugs or we might not achieve our success metric — which is where iteration comes in), but we should try our best to optimize on user-experience earlier on.
Nium Product Manager Keika Sugiyama
I’d say a great PM holds the ability to balance ruthlessness and empathy at the same time. It’s easier said than done for sure!
ShopBack product manager Li Cai
Great product managers are like great Directors of movies. They do not create great products/movies by themselves. They deliver it by Defining, Prioritising, Energising the team to deliver what customers love.
Quincus' Michael Lim
A great product manager, keeps a pulse on the company’s big picture, identifies key problems, and discerns its rightful prioritization, is able to switch between the macro perspective to micro specifics, and communicates concisely with humility that influences naturally for execution
Mathieu François-Barseghian, SVP, Citi Ventures
“You ship your org chart”. This is Conway’s Law short version (1967!): the fundamental socio-technical driver behind innovation successes (Netflix) and failures (your typical bank). The hype behind micro-services is just another reflection of Conway’s Law
Mastercard's Regional Product Manager Nikhil Moorthy
A great PM should always look to build products which are scalable & viable , always keep the end consumer journey in mind. Keeping things simple & having a MVP based approach helps roll out products faster. One has to test & learn & then accordingly enhance / adapt, these are key to success
Rendy Andi, Tokopedia Product Manager
Articulate a clear vision and the path to get there, Create a process that delivers the best results and Be serious about customers.
Senior Product Manager, DANA Indonesia
Own the problem, not the solution — Great PMs are outstanding problem preventers. Great PMs are discerning about which problems to prevent, which problems to solve, and which problems not to solve
Tat Leong Seah, LionsBot International Senior UX Engineer, ex-ViSenze Product Manager
Prioritize outcomes for your users, not outputs of your system” or more succinctly “be agile in delivering value; not features”
Senior Product Manager, Rakuten Viki
A good product manager puts out fires. A great product manager lets fires burn and prioritize from there
acquire fundamental soft skills
Oracle NetSuite's Astrid April Dominguez
Personally, i believe that it takes grit, empathy, and optimistic mindset to become a great PM
Ovo Lead Product Manager Boy Al Idrus
Contrary to popular beliefs, being a great product manager doesn’t have anything to do with technicals, it sure plays a part but most important weapons are: understanding pain points of users, project management, sympathy in leadership and business critical skills; these 4 aspects would definitely help you to become a great product manager.
PwC Product Manager Eric Koh
Product managers need to be courageous to be successful. Courage is required to dive deep, solving big problems at its root and also to think far and dream big to achieve bold visions for your product
Ninja Van's Product Director
In my opinion the two most important ingredients to become a successful product manager is: 1. Strong critical thinking 2. Strong passion for the work. As product managers, we typically need to solve very complex problems where the answers are often very ambiguous. The work is tough and at times can be really frustrating. The 2 ingredients I mentioned earlier will be critical towards helping you to slowly discover the solution that may become a game changer.
PayPal's Lead Product Manager
A great PM has an eye of a designer, the brain of an engineer and the tongue of a diplomat
Product Manager Irene Chan
A great Product Manager is able to think like a CEO of the company. Visionary with Agile Execution in mind
Isabella Yamin, Rakuten Viki Product Manager
There is no one model of being a great product person but what I’ve observed from people I’ve had the privilege working with is an overflowing passion for the user problem, sprinkled with a knack for data and negotiation
Google product manager Jachin Cheng
Great product managers start with abundant intellectual curiosity and grow into a classic T-shape. Horizontally: generalists who range widely, communicate fluidly and collaborate easily cross-functionally, connect unexpected dots, and have the pulse both internally and externally across users, stakeholders, and ecosystem players. Vertically: deep product craftsmanship comes from connecting relentless user obsession with storytelling, business strategy with detailed features and execution, inspiring leadership with risk mitigation, and applying the most relevant tools to solving the right problems.
Jene Lim, Experian's Product Manager
3 Cs and 3 Rs. Critical thinking , Customer empathy, Creativity. Resourcefulness, Resilience, Results orientation.
Nirenj George, Envision Digital's Security Product Manager
A great product manager is someone who can lead, collaborate and influence different stakeholders around the product vision, and should be able to execute the product strategy based on customer insights, as well as take ownership of the product roadmap to create a greater impact on customers.
Grab's Lead Product Manager
Product Management is a multi-dimensional role that looks very different across each product team so each product manager has different challenges to deal with but what I have found common among great product managers is ability to create leverage through their efforts to drive outsized impacts for their products. This leverage is built using data with intuition, building consensus with stakeholders, empowering their teams and focussed efforts on needle moving work.
NCS Product Manager Umar Masagos
To be a great product manager, one must master both the science and art of Product Management. On one hand, you need have a strong understanding of the tools, metrics and data you need to drive your product. On the other hand, you need an in-depth understanding of your organization, your target market and target users, which is often the more challenging aspect to master.
M1 product manager Wei Jiao Keong
A great product manager is multi-faceted. First, you need to have the ability to see the bigger picture, yet have a keen eye for detail. Secondly, you are empathetic and is able to deliver products with exceptional user experience while being analytical enough to achieve business outcomes. Lastly, you are highly resourceful and independent yet comfortable working cross-functionally.
Yudha Utomo, ex-Senior Product Manager, Tokopedia
A great Product Manager is essentially an effective note-taker. In order to achieve the product goals, It is PM’s job to ensure objective has been clearly conveyed, efforts are assessed, and tasks are properly tracked and managed. PM can do this by having top-notch documentation skills.

Joseph Mavericks
3 years ago
5 books my CEO read to make $30M
Offices without books are like bodies without souls.
After 10 years, my CEO sold his company for $30 million. I've shared many of his lessons on medium. You could ask him anything at his always-open office. He also said we could use his office for meetings while he was away. When I used his office for work, I was always struck by how many books he had.
Books are useful in almost every aspect of learning. Building a business, improving family relationships, learning a new language, a new skill... Books teach, guide, and structure. Whether fiction or nonfiction, books inspire, give ideas, and develop critical thinking skills.
My CEO prefers non-fiction and attends a Friday book club. This article discusses 5 books I found in his office that impacted my life/business. My CEO sold his company for $30 million, but I've built a steady business through blogging and video making.
I recall events and lessons I learned from my CEO and how they relate to each book, and I explain how I applied the book's lessons to my business and life.
Note: This post has no affiliate links.
1. The One Thing — Gary Keller

Gary Keller, a real estate agent, wanted more customers. So he and his team brainstormed ways to get more customers. They decided to write a bestseller about work and productivity. The more people who saw the book, the more customers they'd get.
Gary Keller focused on writing the best book on productivity, work, and efficiency for months. His business experience. Keller's business grew after the book's release.
The author summarizes the book in one question.
"What's the one thing that will make everything else easier or unnecessary?"
When I started my blog and business alongside my 9–5, I quickly identified my one thing: writing. My business relied on it, so it had to be great. Without writing, there was no content, traffic, or business.
My CEO focused on funding when he started his business. Even in his final years, he spent a lot of time on the phone with investors, either to get more money or to explain what he was doing with it. My CEO's top concern was money, and the other super important factors were handled by separate teams.
Product tech and design
Incredible customer support team
Excellent promotion team
Profitable sales team
My CEO didn't always focus on one thing and ignore the rest. He was on all of those teams when I started my job. He'd start his day in tech, have lunch with marketing, and then work in sales. He was in his office on the phone at night.
He eventually realized his errors. Investors told him he couldn't do everything for the company. If needed, he had to change internally. He learned to let go, mind his own business, and focus for the next four years. Then he sold for $30 million.
The bigger your project/company/idea, the more you'll need to delegate to stay laser-focused. I started something new every few months for 10 years before realizing this. So much to do makes it easy to avoid progress. Once you identify the most important aspect of your project and enlist others' help, you'll be successful.
2. Eat That Frog — Brian Tracy
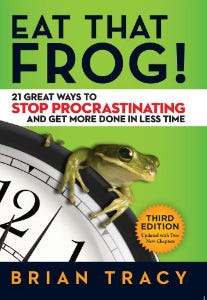
The author quote sums up book's essence:
Mark Twain said that if you eat a live frog in the morning, it's probably the worst thing that will happen to you all day. Your "frog" is the biggest, most important task you're most likely to procrastinate on.
"Frog" and "One Thing" are both about focusing on what's most important. Eat That Frog recommends doing the most important task first thing in the morning.
I shared my CEO's calendar in an article 10 months ago. Like this:

CEO's average week (some information crossed out for confidentiality)
Notice anything about 8am-8:45am? Almost every day is the same (except Friday). My CEO started his day with a management check-in for 2 reasons:
Checking in with all managers is cognitively demanding, and my CEO is a morning person.
In a young startup where everyone is busy, the morning management check-in was crucial. After 10 am, you couldn't gather all managers.
When I started my blog, writing was my passion. I'm a morning person, so I woke up at 6 am and started writing by 6:30 am every day for a year. This allowed me to publish 3 articles a week for 52 weeks to build my blog and audience. After 2 years, I'm not stopping.
3. Deep Work — Cal Newport
Deep work is focusing on a cognitively demanding task without distractions (like a morning management meeting). It helps you master complex information quickly and produce better results faster. In a competitive world 10 or 20 years ago, focus wasn't a huge advantage. Smartphones, emails, and social media made focus a rare, valuable skill.
Most people can't focus anymore. Screens light up, notifications buzz, emails arrive, Instagram feeds... Many people don't realize they're interrupted because it's become part of their normal workflow.
Cal Newport mentions Bill Gates' "Think Weeks" in Deep Work.
Microsoft CEO Bill Gates would isolate himself (often in a lakeside cottage) twice a year to read and think big thoughts.
Inside Bill's Brain on Netflix shows Newport's lakeside cottage. I've always wanted a lakeside cabin to work in. My CEO bought a lakehouse after selling his company, but now he's retired.
As a company grows, you can focus less on it. In a previous section, I said investors told my CEO to get back to basics and stop micromanaging. My CEO's commitment and ability to get work done helped save the company. His deep work and new frameworks helped us survive the corona crisis (more on this later).
The ability to deep work will be a huge competitive advantage in the next century. Those who learn to work deeply will likely be successful while everyone else is glued to their screens, Bluetooth-synced to their watches, and playing Candy Crush on their tablets.
4. The 7 Habits of Highly Effective People — Stephen R. Covey
It took me a while to start reading this book because it seemed like another shallow self-help bible. I kept finding this book when researching self-improvement. I tried it because it was everywhere.
Stephen Covey taught me 2 years ago to have a personal mission statement.
A 7 Habits mission statement describes the life you want to lead, the character traits you want to embody, and the impact you want to have on others. shortform.com
I've had many lunches with my CEO and talked about Vipassana meditation and Sunday forest runs, but I've never seen his mission statement. I'm sure his family is important, though. In the above calendar screenshot, you can see he always included family events (in green) so we could all see those time slots. We couldn't book him then. Although he never spent as much time with his family as he wanted, he always made sure to be on time for his kid's birthday rather than a conference call.
My CEO emphasized his company's mission. Your mission statement should answer 3 questions.
What does your company do?
How does it do it?
Why does your company do it?
As a graphic designer, I had to create mission-statement posters. My CEO hung posters in each office.
5. Measure What Matters — John Doerr

This book is about Andrew Grove's OKR strategy, developed in 1968. When he joined Google's early investors board, he introduced it to Larry Page and Sergey Brin. Google still uses OKR.
Objective Key Results
Objective: It explains your goals and desired outcome. When one goal is reached, another replaces it. OKR objectives aren't technical, measured, or numerical. They must be clear.
Key Result should be precise, technical, and measurable, unlike the Objective. It shows if the Goal is being worked on. Time-bound results are quarterly or yearly.
Our company almost sank several times. Sales goals were missed, management failed, and bad decisions were made. On a Monday, our CEO announced we'd implement OKR to revamp our processes.
This was a year before the pandemic, and I'm certain we wouldn't have sold millions or survived without this change. This book impacted the company the most, not just management but all levels. Organization and transparency improved. We reached realistic goals. Happy investors. We used the online tool Gtmhub to implement OKR across the organization.

My CEO's company went from near bankruptcy to being acquired for $30 million in 2 years after implementing OKR.
I hope you enjoyed this booklist. Here's a recap of the 5 books and the lessons I learned from each.
The 7 Habits of Highly Effective People — Stephen R. Covey
Have a mission statement that outlines your goals, character traits, and impact on others.
Deep Work — Cal Newport
Focus is a rare skill; master it. Deep workers will succeed in our hyper-connected, distracted world.
The One Thing — Gary Keller
What can you do that will make everything else easier or unnecessary? Once you've identified it, focus on it.
Eat That Frog — Brian Tracy
Identify your most important task the night before and do it first thing in the morning. You'll have a lighter day.
Measure What Matters — John Doerr
On a timeline, divide each long-term goal into chunks. Divide those slices into daily tasks (your goals). Time-bound results are quarterly or yearly. Objectives aren't measured or numbered.
Thanks for reading. Enjoy the ride!
You might also like

Ellane W
3 years ago
The Last To-Do List Template I'll Ever Need, Years in the Making
The holy grail of plain text task management is finally within reach

Plain text task management? Are you serious?? Dedicated task managers exist for a reason, you know. Sheesh.
—Oh, I know. Believe me, I know! But hear me out.
I've managed projects and tasks in plain text for more than four years. Since reorganizing my to-do list, plain text task management is within reach.
Data completely yours? One billion percent. Beef it up with coding? Be my guest.
Enter: The List
The answer? A list. That’s it!
Write down tasks. Obsidian, Notenik, Drafts, or iA Writer are good plain text note-taking apps.
List too long? Of course, it is! A large list tells you what to do. Feel the itch and friction. Then fix it.
But I want to be able to distinguish between work and personal life! List two things.
However, I need to know what should be completed first. Put those items at the top.
However, some things keep coming up, and I need to be reminded of them! Put those in your calendar and make an alarm for them.
But since individual X hasn't completed task Y, I can't proceed with this. Create a Waiting section on your list by dividing it.
But I must know what I'm supposed to be doing right now! Read your list(s). Check your calendar. Think critically.
Before I begin a new one, I remind myself that "Listory Never Repeats."
There’s no such thing as too many lists if all are needed. There is such a thing as too many lists if you make them before they’re needed. Before they complain that their previous room was small or too crowded or needed a new light.
A list that feels too long has a voice; it’s telling you what to do next.
I use one Master List. It's a control panel that tells me what to focus on short-term. If something doesn't need semi-immediate attention, it goes on my Backlog list.
Todd Lewandowski's DWTS (Done, Waiting, Top 3, Soon) performance deserves praise. His DWTS to-do list structure has transformed my plain-text task management. I didn't realize it was upside down.
This is my take on it:
D = Done
Move finished items here. If they pile up, clear them out every week or month. I have a Done Archive folder.
W = Waiting
Things seething in the background, awaiting action. Stir them occasionally so they don't burn.
T = Top 3
Three priorities. Personal comes first, then work. There will always be a top 3 (no more than 5) in every category. Projects, not chores, usually.
S = Soon
This part is action-oriented. It's for anything you can accomplish to finish one of the Top 3. This collection includes thoughts and project lists. The sole requirement is that they should be short-term goals.
Some of you have probably concluded this isn't for you. Please read Todd's piece before throwing out the baby. Often. You shouldn't miss a newborn.
As much as Dancing With The Stars helps me recall this method, I may try switching their order. TSWD; Drilling Tunnel Seismic? Serenity After Task?
Master List Showcase
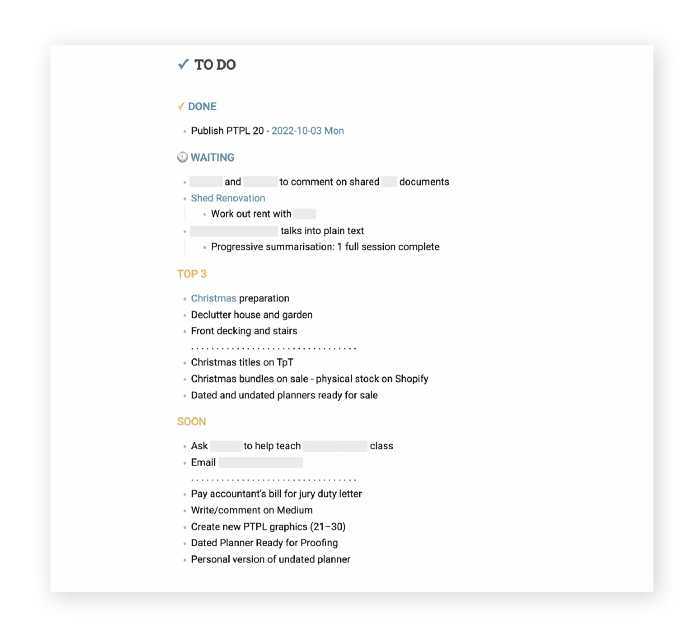
My Master List lives alone in its own file, but sometimes appears in other places. It's included in my Weekly List template. Here's a (soon-to-be-updated) demo vault of my Obsidian planning setup to download for free.
Here's the code behind my weekly screenshot:
## [[Master List - 2022|✓]]  TO DO

![[Master List - 2022]]
FYI, I use the Minimal Theme in Obsidian, with a few tweaks.
You may note I'm utilizing a checkmark as a link. For me, that's easier than locating the proper spot to click on the embed.
Blue headings for Done and Waiting are links. Done links to the Done Archive page and Waiting to a general waiting page.
Read my full article here.

CoinTelegraph
4 years ago
2 NFT-based blockchain games that could soar in 2022
NFTs look ready to rule 2022, and the recent pivot toward NFT utility in P2E gaming could make blockchain gaming this year’s sector darling.
After the popularity of decentralized finance (DeFi) came the rise of nonfungible tokens (NFTs), and to the surprise of many, NFTs took the spotlight and now remain front and center with the highest volume in sales occurring at the start of January 2022.
While 2021 became the year of NFTs, GameFi applications did surpass DeFi in terms of user popularity. According to data from DappRadar, Bloomberg gathered:
Nearly 50% of active cryptocurrency wallets connected to decentralized applications in November were for playing games. The percentage of wallets linked to decentralized finance, or DeFi, dapps fell to 45% during the same period, after months of being the leading dapp use case.
Blockchain play-to-earn (P2E) game Axie infinity skyrocketed and kicked off a gaming craze that is expected to continue all throughout 2022. Crypto pundits and gaming advocates have high expectations for P2E blockchain-based games and there’s bound to be a few sleeping giants that will dominate the sector.
Let’s take a look at five blockchain games that could make waves in 2022.
DeFi Kingdoms
The inspiration for DeFi Kingdoms came from simple beginnings — a passion for investing that lured the developers to blockchain technology. DeFi Kingdoms was born as a visualization of liquidity pool investing where in-game ‘gardens’ represent literal and figurative token pairings and liquidity pool mining.
As shown in the game, investors have a portion of their LP share within a plot filled with blooming plants. By attaching the concept of growth to DeFi protocols within a play-and-earn model, DeFi Kingdoms puts a twist on “playing” a game.
Built on the Harmony Network, DeFi Kingdoms became the first project on the network to ever top the DappRadar charts. This could be attributed to an influx of individuals interested in both DeFi and blockchain games or it could be attributed to its recent in-game utility token JEWEL surging.
JEWEL is a utility token that allows users to purchase NFTs in-game buffs to increase a base-level stat. It is also used for liquidity mining to grant users the opportunity to make more JEWEL through staking.
JEWEL is also a governance token that gives holders a vote in the growth and evolution of the project. In the past four months, the token price surged from $1.23 to an all-time high of $22.52. At the time of writing, JEWEL is down by nearly 16%, trading at $19.51.
Surging approximately 1,487% from its humble start of $1.23 four months ago in September, JEWEL token price has increased roughly 165% this last month alone, according to data from CoinGecko.
Guild of Guardians
Guild of Guardians is one of the more anticipated blockchain games in 2022 and it is built on ImmutableX, the first layer-two solution built on Ethereum that focuses on NFTs. Aiming to provide more access, it will operate as a free-to-play mobile role-playing game, modeling the P2E mechanics.
Similar to blockchain games like Axie Infinity, Guild of Guardians in-game assets can be exchanged. The project seems to be of interest to many gamers and investors with its NFT founder sale and token launch generating nearly $10 million in volume.
Launching its in-game token in October of 2021, the Guild of Guardians (GOG) tokens are ERC-20 tokens known as ‘gems’ inside the game. Gems are what power key features in the game such as minting in-game NFTs and interacting with the marketplace, and are available to earn while playing.
For the last month, the Guild of Guardians token has performed rather steadily after spiking to its all-time high of $2.81 after its launch. Despite the token being down over 50% from its all-time high, at the time of writing, some members of the community are looking forward to the possibility of staking and liquidity pools, which are features that tend to help stabilize token prices.

DC Palter
2 years ago
Why Are There So Few Startups in Japan?
Japan's startup challenge: 7 reasons

Every day, another Silicon Valley business is bought for a billion dollars, making its founders rich while growing the economy and improving consumers' lives.
Google, Amazon, Twitter, and Medium dominate our daily lives. Tesla automobiles and Moderna Covid vaccinations.
The startup movement started in Silicon Valley, California, but the rest of the world is catching up. Global startup buzz is rising. Except Japan.
644 of CB Insights' 1170 unicorns—successful firms valued at over $1 billion—are US-based. China follows with 302 and India third with 108.
Japan? 6!
1% of US startups succeed. The third-largest economy is tied with small Switzerland for startup success.
Mexico (8), Indonesia (12), and Brazil (12) have more successful startups than Japan (16). South Korea has 16. Yikes! Problem?
Why Don't Startups Exist in Japan More?
Not about money. Japanese firms invest in startups. To invest in startups, big Japanese firms create Silicon Valley offices instead of Tokyo.
Startups aren't the issue either. Local governments are competing to be Japan's Shirikon Tani, providing entrepreneurs financing, office space, and founder visas.
Startup accelerators like Plug and Play in Tokyo, Osaka, and Kyoto, the Startup Hub in Kobe, and Google for Startups are many.
Most of the companies I've encountered in Japan are either local offices of foreign firms aiming to expand into the Japanese market or small businesses offering local services rather than disrupting a staid industry with new ideas.
There must be a reason Japan can develop world-beating giant corporations like Toyota, Nintendo, Shiseido, and Suntory but not inventive startups.
Culture, obviously. Japanese culture excels in teamwork, craftsmanship, and quality, but it hates moving fast, making mistakes, and breaking things.
If you have a brilliant idea in Silicon Valley, quit your job, get money from friends and family, and build a prototype. To fund the business, you approach angel investors and VCs.
Most non-startup folks don't aware that venture capitalists don't want good, profitable enterprises. That's wonderful if you're developing a solid small business to consult, open shops, or make a specialty product. However, you must pay for it or borrow money. Venture capitalists want moon rockets. Silicon Valley is big or bust. Almost 90% will explode and crash. The few successes are remarkable enough to make up for the failures.
Silicon Valley's high-risk, high-reward attitude contrasts with Japan's incrementalism. Japan makes the best automobiles and cleanrooms, but it fails to produce new items that grow the economy.
Changeable? Absolutely. But, what makes huge manufacturing enterprises successful and what makes Japan a safe and comfortable place to live are inextricably connected with the lack of startups.
Barriers to Startup Development in Japan
These are the 7 biggest obstacles to Japanese startup success.
Unresponsive Employment Market
While the lifelong employment system in Japan is evolving, the average employee stays at their firm for 12 years (15 years for men at large organizations) compared to 4.3 years in the US. Seniority, not experience or aptitude, determines career routes, making it tough to quit a job to join a startup and then return to corporate work if it fails.
Conservative Buyers
Even if your product is buggy and undocumented, US customers will migrate to a cheaper, superior one. Japanese corporations demand perfection from their trusted suppliers and keep with them forever. Startups need income fast, yet product evaluation takes forever.
Failure intolerance
Japanese business failures harm lives. Failed forever. It hinders risk-taking. Silicon Valley embraces failure. Build another startup if your first fails. Build a third if that fails. Every setback is viewed as a learning opportunity for success.
4. No Corporate Purchases
Silicon Valley industrial giants will buy fast-growing startups for a lot of money. Many huge firms have stopped developing new goods and instead buy startups after the product is validated.
Japanese companies prefer in-house product development over startup acquisitions. No acquisitions mean no startup investment and no investor reward.
Startup investments can also be monetized through stock market listings. Public stock listings in Japan are risky because the Nikkei was stagnant for 35 years while the S&P rose 14x.
5. Social Unity Above Wealth
In Silicon Valley, everyone wants to be rich. That creates a competitive environment where everyone wants to succeed, but it also promotes fraud and societal problems.
Japan values communal harmony above individual success. Wealthy folks and overachievers are avoided. In Japan, renegades are nearly impossible.
6. Rote Learning Education System
Japanese high school graduates outperform most Americans. Nonetheless, Japanese education is known for its rote memorization. The American system, which fails too many kids, emphasizes creativity to create new products.
Immigration.
Immigrants start 55% of successful Silicon Valley firms. Some come for university, some to escape poverty and war, and some are recruited by Silicon Valley startups and stay to start their own.
Japan is difficult for immigrants to start a business due to language barriers, visa restrictions, and social isolation.
How Japan Can Promote Innovation
Patchwork solutions to deep-rooted cultural issues will not work. If customers don't buy things, immigration visas won't aid startups. Startups must have a chance of being acquired for a huge sum to attract investors. If risky startups fail, employees won't join.
Will Japan never have a startup culture?
Once a consensus is reached, Japan changes rapidly. A dwindling population and standard of living may lead to such consensus.
Toyota and Sony were firms with renowned founders who used technology to transform the world. Repeatable.
Silicon Valley is flawed too. Many people struggle due to wealth disparities, job churn and layoffs, and the tremendous ups and downs of the economy caused by stock market fluctuations.
The founders of the 10% successful startups are heroes. The 90% that fail and return to good-paying jobs with benefits are never mentioned.
Silicon Valley startup culture and Japanese corporate culture are opposites. Each have pros and cons. Big Japanese corporations make the most reliable, dependable, high-quality products yet move too slowly. That's good for creating cars, not social networking apps.
Can innovation and success be encouraged without eroding social cohesion? That can motivate software firms to move fast and break things while recognizing the beauty and precision of expert craftsmen? A hybrid culture where Japan can make the world's best and most original items. Hopefully.