


More on Entrepreneurship/Creators
Benjamin Lin
3 years ago
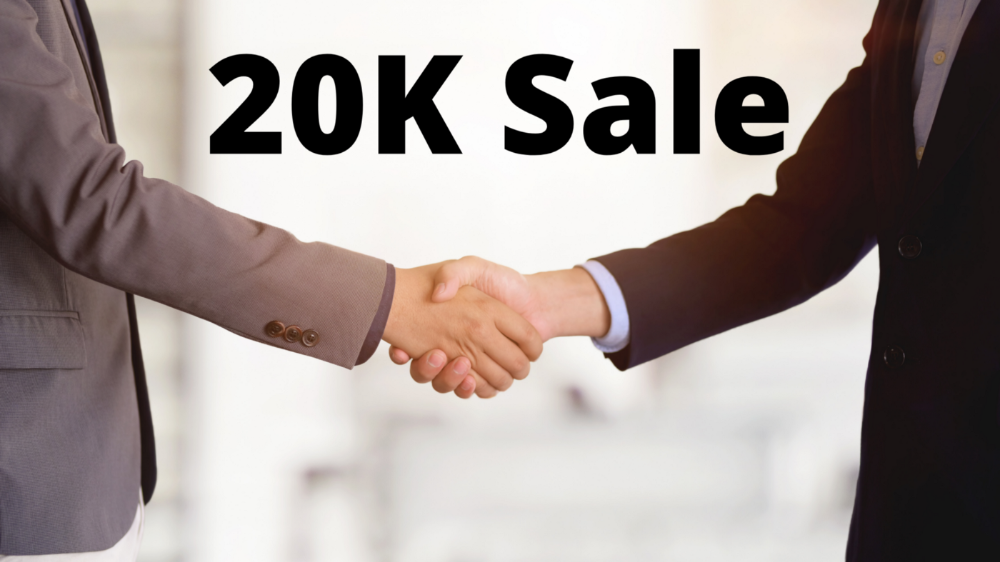
I sold my side project for $20,000: 6 lessons I learned
How I monetized and sold an abandoned side project for $20,000
The Origin Story
I've always wanted to be an entrepreneur but never succeeded. I often had business ideas, made a landing page, and told my buddies. Never got customers.
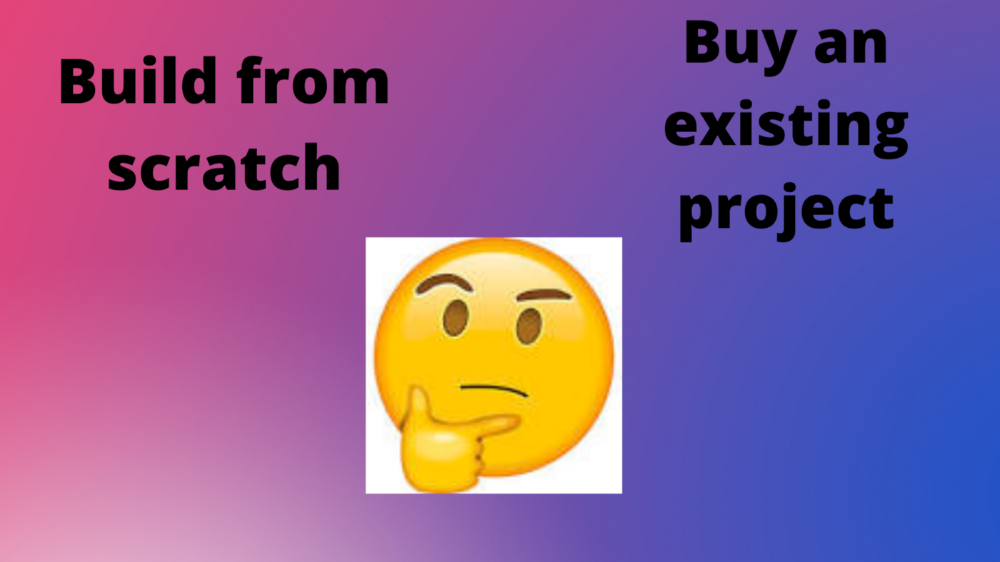
In April 2021, I decided to try again with a new strategy. I noticed that I had trouble acquiring an initial set of customers, so I wanted to start by acquiring a product that had a small user base that I could grow.
I found a SaaS marketplace called MicroAcquire.com where you could buy and sell SaaS products. I liked Shareit.video, an online Loom-like screen recorder.
Shareit.video didn't generate revenue, but 50 people visited daily to record screencasts.
Purchasing a Failed Side Project
I eventually bought Shareit.video for $12,000 from its owner.
$12,000 was probably too much for a website without revenue or registered users.
I thought time was most important. I could have recreated the website, but it would take months. $12,000 would give me an organized code base and a working product with a few users to monetize.
I considered buying a screen recording website and trying to grow it versus buying a new car or investing in crypto with the $12K.
Buying the website would make me a real entrepreneur, which I wanted more than anything.
Putting down so much money would force me to commit to the project and prevent me from quitting too soon.
A Year of Development
I rebranded the website to be called RecordJoy and worked on it with my cousin for about a year. Within a year, we made $5000 and had 3000 users.
We spent $3500 on ads, hosting, and software to run the business.
AppSumo promoted our $120 Life Time Deal in exchange for 30% of the revenue.
We put RecordJoy on maintenance mode after 6 months because we couldn't find a scalable user acquisition channel.
We improved SEO and redesigned our landing page, but nothing worked.

Despite not being able to grow RecordJoy any further, I had already learned so much from working on the project so I was fine with putting it on maintenance mode. RecordJoy still made $500 a month, which was great lunch money.
Getting Taken Over
One of our customers emailed me asking for some feature requests and I replied that we weren’t going to add any more features in the near future. They asked if we'd sell.
We got on a call with the customer and I asked if he would be interested in buying RecordJoy for 15k. The customer wanted around $8k but would consider it.
Since we were negotiating with one buyer, we put RecordJoy on MicroAcquire to see if there were other offers.
We quickly received 10+ offers. We got 18.5k. There was also about $1000 in AppSumo that we could not withdraw, so we agreed to transfer that over for $600 since about 40% of our sales on AppSumo usually end up being refunded.
Lessons Learned
First, create an acquisition channel
We couldn't discover a scalable acquisition route for RecordJoy. If I had to start another project, I'd develop a robust acquisition channel first. It might be LinkedIn, Medium, or YouTube.
Purchase Power of the Buyer Affects Acquisition Price
Some of the buyers we spoke to were individuals looking to buy side projects, as well as companies looking to launch a new product category. Individual buyers had less budgets than organizations.
Customers of AppSumo vary.
AppSumo customers value lifetime deals and low prices, which may not be a good way to build a business with recurring revenue. Designed for AppSumo users, your product may not connect with other users.
Try to increase acquisition trust
Acquisition often fails. The buyer can go cold feet, cease communicating, or run away with your stuff. Trusting the buyer ensures a smooth asset exchange. First acquisition meeting was unpleasant and price negotiation was tight. In later meetings, we spent the first few minutes trying to get to know the buyer’s motivations and background before jumping into the negotiation, which helped build trust.
Operating expenses can reduce your earnings.
Monitor operating costs. We were really happy when we withdrew the $5000 we made from AppSumo and Stripe until we realized that we had spent $3500 in operating fees. Spend money on software and consultants to help you understand what to build.
Don't overspend on advertising
We invested $1500 on Google Ads but made little money. For a side project, it’s better to focus on organic traffic from SEO rather than paid ads unless you know your ads are going to have a positive ROI.

Aaron Dinin, PhD
2 years ago
The Advantages and Disadvantages of Having Investors Sign Your NDA
Startup entrepreneurs assume what risks when pitching?

Last week I signed four NDAs.
Four!
NDA stands for non-disclosure agreement. A legal document given to someone receiving confidential information. By signing, the person pledges not to share the information for a certain time. If they do, they may be in breach of contract and face legal action.
Companies use NDAs to protect trade secrets and confidential internal information from employees and contractors. Appropriate. If you manage a huge, successful firm, you don't want your employees selling their information to your competitors. To be true, business NDAs don't always prevent corporate espionage, but they usually make employees and contractors think twice before sharing.
I understand employee and contractor NDAs, but I wasn't asked to sign one. I counsel entrepreneurs, thus the NDAs I signed last week were from startups that wanted my feedback on their concepts.
I’m not a startup investor. I give startup guidance online. Despite that, four entrepreneurs thought their company ideas were so important they wanted me to sign a generically written legal form they probably acquired from a shady, spam-filled legal templates website before we could chat.
False. One company tried to get me to sign their NDA a few days after our conversation. I gently rejected, but their tenacity encouraged me. I considered sending retroactive NDAs to everyone I've ever talked to about one of my startups in case they establish a successful company based on something I said.
Two of the other three NDAs were from nearly identical companies. Good thing I didn't sign an NDA for the first one, else they may have sued me for talking to the second one as though I control the firms people pitch me.
I wasn't talking to the fourth NDA company. Instead, I received an unsolicited email from someone who wanted comments on their fundraising pitch deck but required me to sign an NDA before sending it.
That's right, before I could read a random Internet stranger's unsolicited pitch deck, I had to sign his NDA, potentially limiting my ability to discuss what was in it.
You should understand. Advisors, mentors, investors, etc. talk to hundreds of businesses each year. They cannot manage all the companies they deal with, thus they cannot risk legal trouble by talking to someone. Well, if I signed NDAs for all the startups I spoke with, half of the 300+ articles I've written on Medium over the past several years could get me sued into the next century because I've undoubtedly addressed topics in my articles that I discussed with them.
The four NDAs I received last week are part of a recent trend of entrepreneurs sending out NDAs before meetings, despite the practical and legal issues. They act like asking someone to sign away their right to talk about all they see and hear in a day is as straightforward as asking for a glass of water.
Given this inflow of NDAs, I wanted to briefly remind entrepreneurs reading this blog about the merits and cons of requesting investors (or others in the startup ecosystem) to sign your NDA.
Benefits of having investors sign your NDA include:
None. Zero. Nothing.
Disadvantages of requesting investor NDAs:
You'll come off as an amateur who has no idea what it takes to launch a successful firm.
Investors won't trust you with their money since you appear to be a complete amateur.
Printing NDAs will be a waste of paper because no genuine entrepreneur will ever sign one.
I apologize for missing any cons. Please leave your remarks.

Stephen Moore
3 years ago
Adam Neumanns is working to create the future of living in a classic example of a guy failing upward.
The comeback tour continues…
First, he founded a $47 billion co-working company (sorry, a “tech company”).
He established WeLive to disrupt apartment life.
Then he created WeGrow, a school that tossed aside the usual curriculum to feed children's souls and release their potential.
He raised the world’s consciousness.
Then he blew it all up (without raising the world’s consciousness). (He bought a wave pool.)
Adam Neumann's WeWork business burned investors' money. The founder sailed off with unimaginable riches, leaving long-time employees with worthless stocks and the company bleeding money. His track record, which includes a failing baby clothing company, should have stopped investors cold.
Once the dust settled, folks went on. We forgot about the Neumanns! We forgot about the private jets, company retreats, many houses, and WeWork's crippling. In that moment, the prodigal son of entrepreneurship returned, choosing the blockchain as his industry. His homecoming tour began with Flowcarbon, which sold Goddess Nature Tokens to lessen companies' carbon footprints.
Did it work?
Of course not.
Despite receiving $70 million from Andreessen Horowitz's a16z, the project has been halted just two months after its announcement.
This triumph should lower his grade.
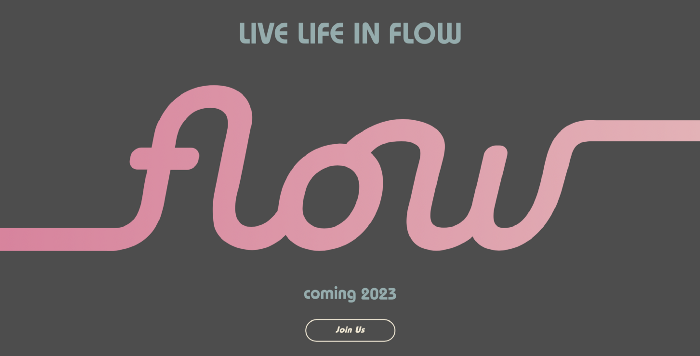
Neumann seems to have moved on and has another revolutionary idea for the future of living. Flow (not Flowcarbon) aims to help people live in flow and will launch in 2023. It's the classic Neumann pitch: lofty goals, yogababble, and charisma to attract investors.
It's a winning formula for one investment fund. a16z has backed the project with its largest single check, $350 million. It has a splash page and 3,000 rental units, but is valued at over $1 billion. The blog post praised Neumann for reimagining the office and leading a paradigm-shifting global company.
Flow's mission is to solve the nation's housing crisis. How? Idk. It involves offering community-centric services in apartment properties to the same remote workforce he once wooed with free beer and a pingpong table. Revolutionary! It seems the goal is to apply WeWork's goals of transforming physical spaces and building community to apartments to solve many of today's housing problems.
The elevator pitch probably sounded great.
At least a16z knows it's a near-impossible task, calling it a seismic shift. Marc Andreessen opposes affordable housing in his wealthy Silicon Valley town. As details of the project emerge, more investors will likely throw ethics and morals out the window to go with the flow, throwing money at a man known for burning through it while building toxic companies, hoping he can bank another fantasy valuation before it all crashes.
Insanity is repeating the same action and expecting a different result. Everyone on the Neumann hype train needs to sober up.
Like WeWork, this venture Won’tWork.
Like before, it'll cause a shitstorm.
You might also like

Scott Galloway
3 years ago
First Health
ZERO GRACE/ZERO MALICE
Amazon's purchase of One Medical could speed up American healthcare
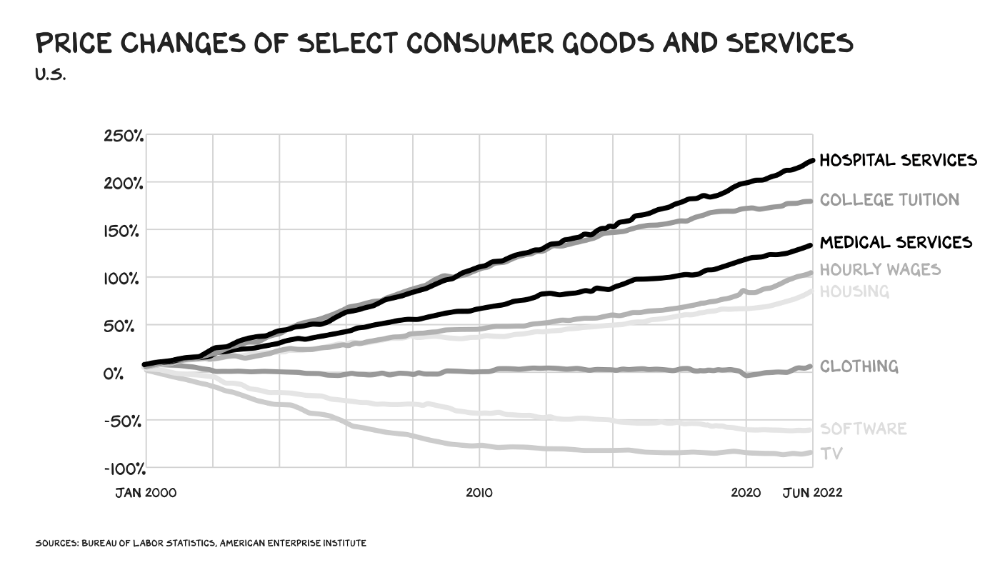
The U.S. healthcare industry is a 7-ton seal bleeding at sea. Predators are circling. Unearned margin: price increases relative to inflation without quality improvements. Amazon is the 11-foot megalodon with 7-inch teeth. Amazon is no longer circling... but attacking.
In 2020 dollars, per capita U.S. healthcare spending increased from $2,968 in 1980 to $12,531. The result is a massive industry with 13% of the nation's workers and a fifth of GDP.
Doctor No
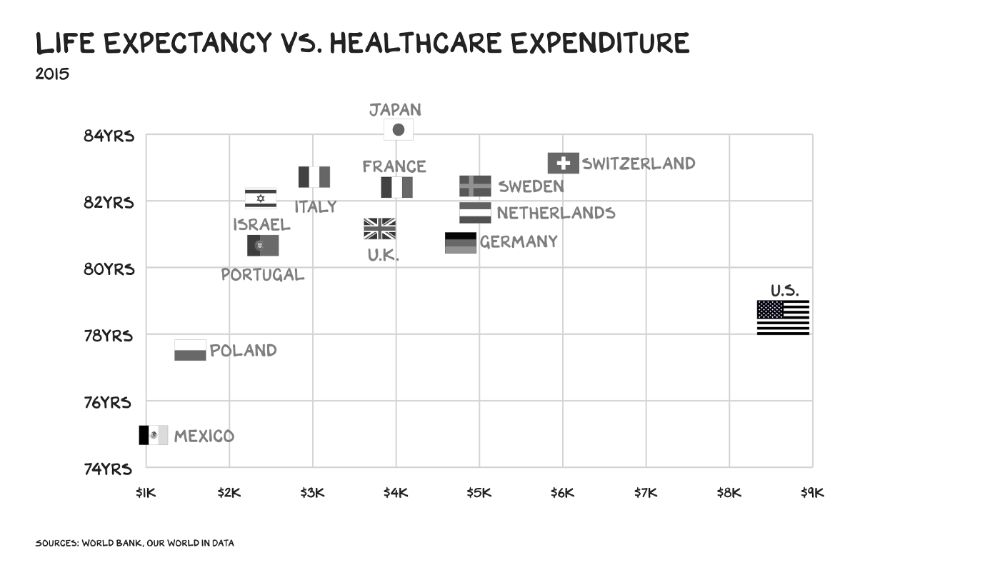
In 40 years, healthcare has made progress. From 73.7 in 1980 to 78.8 in 2019, life expectancy rose (before Covid knocked it back down a bit). Pharmacological therapies have revolutionized, and genetic research is paying off. The financial return, improvement split by cost increases, is terrible. No country has expense rises like the U.S., and no one spends as much per capita as we do. Developed countries have longer life expectancies, healthier populations, and less economic hardship.
Two-thirds of U.S. personal bankruptcies are due to medical expenses and/or missed work. Mom or Dad getting cancer could bankrupt many middle-class American families. 40% of American adults delayed or skipped needed care due to cost. Every healthcare improvement seems to have a downside. Same pharmacological revolution that helped millions caused opioid epidemic. Our results are poor in many areas: The U.S. has a high infant mortality rate.
Healthcare is the second-worst retail industry in the country. Gas stations are #1. Imagine walking into a Best Buy to buy a TV and a Blue Shirt associate requests you fill out the same 14 pages of paperwork you filled out yesterday. Then you wait in a crowded room until they call you, 20 minutes after the scheduled appointment you were asked to arrive early for, to see the one person in the store who can talk to you about TVs, who has 10 minutes for you. The average emergency room wait time in New York is 6 hours and 10 minutes.
If it's bad for the customer, it's worse for the business. Physicians spend 27% of their time helping patients; 49% on EHRs. Documentation, order entry, billing, and inbox management. Spend a decade getting an M.D., then become a bureaucrat.
No industry better illustrates scale diseconomies. If we got the same return on healthcare spending as other countries, we'd all live to 100. We could spend less, live longer and healthier, and pay off the national debt in 15 years. U.S. healthcare is the worst ever.
What now? Competition is at the heart of capitalism, the worst system of its kind.
Priority Time
Amazon is buying One Medical for $3.9 billion. I think this deal will liberate society. Two years in, I think One Medical is great. When I got Covid, I pressed the One Medical symbol on my phone; a nurse practitioner prescribed Paxlovid and told me which pharmacies had it in stock.
Amazon enables the company's vision. One Medical's stock is down to $10 from $40 at the start of 2021. Last year, it lost $250 million and needs cash (Amazon has $60 billion). ONEM must grow. The service has 736,000 members. Half of U.S. households have Amazon Prime. Finally, delivery. One Medical is a digital health/physical office hybrid, but you must pick up medication at the pharmacy. Upgrade your Paxlovid delivery time after a remote consultation. Amazon's core competency means it'll happen. Healthcare speed and convenience will feel alien.
It's been a long, winding road to disruption. Amazon, JPMorgan, and Berkshire Hathaway formed Haven four years ago to provide better healthcare for their 1.5 million employees. It rocked healthcare stocks the morning of the press release, but folded in 2021.
Amazon Care is an employee-focused service. Home-delivered virtual health services and nurses. It's doing well, expanding nationwide, and providing healthcare for other companies. Hilton is Amazon Care's biggest customer. The acquisition of One Medical will bring 66 million Prime households capital, domain expertise, and billing infrastructure. Imagine:
"Alexa, I'm hot and my back hurts."
"Connecting you to a Prime doctor now."
Want to vs. Have to
I predicted Amazon entering healthcare years ago. Why? For the same reason Apple is getting into auto. Amazon's P/E is 56, double Walmart's. The corporation must add $250 billion in revenue over the next five years to retain its share price. White-label clothes or smart home products won't generate as much revenue. It must enter a huge market without scale, operational competence, and data skills.
Current Situation
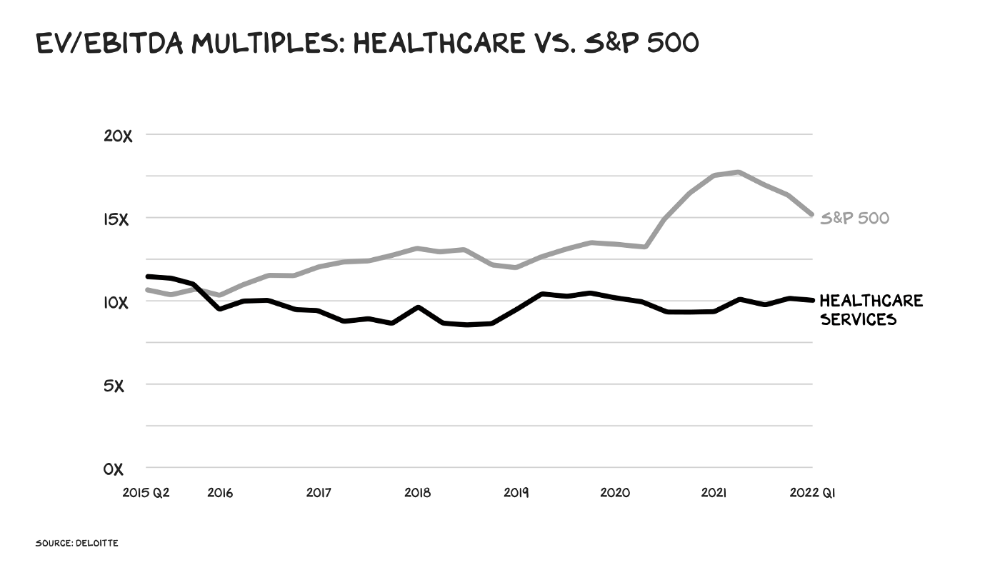
Healthcare reform benefits both consumers and investors. In 2015, healthcare services had S&P 500-average multiples. The market is losing faith in public healthcare businesses' growth. Healthcare services have lower EV/EBITDA multiples than the S&P 500.
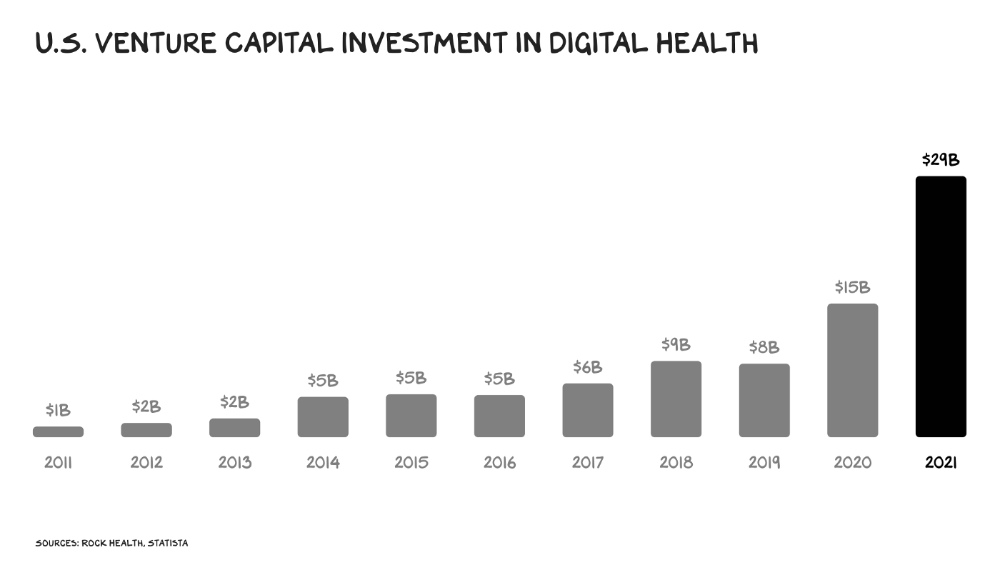
Amazon isn't the only prey-hunter. Walmart and Alibaba are starting pharmacies. Uber is developing medical transportation. Private markets invested $29 billion in telehealth last year, up 95% from 2020.
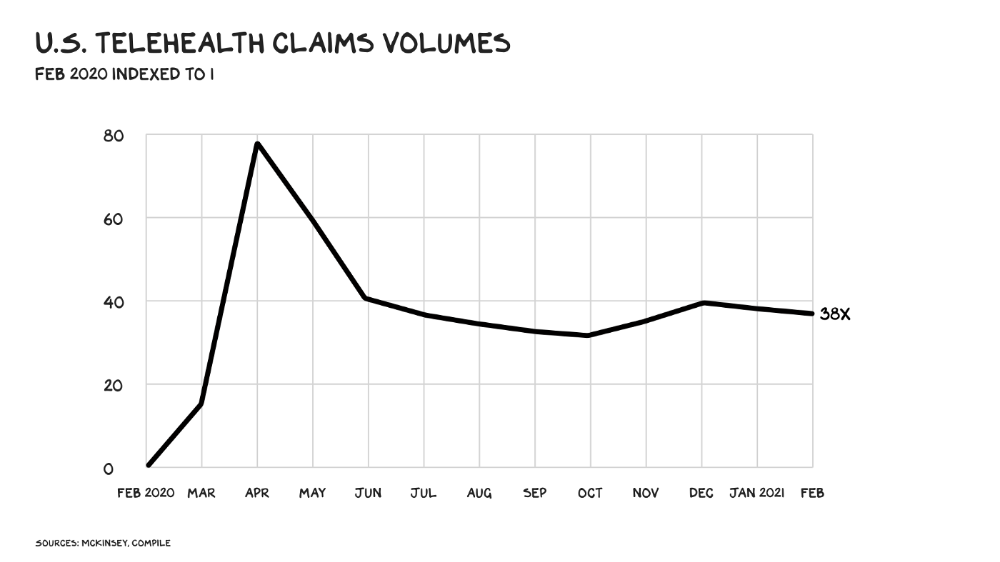
The pandemic accelerated telehealth, the immediate unlock. After the first positive Covid case in the U.S., services that had to be delivered in person shifted to Zoom... We lived. We grew. Video house calls continued after in-person visits were allowed. McKinsey estimates telehealth visits are 38 times pre-pandemic levels. Doctors adopted the technology, regulators loosened restrictions, and patients saved time. We're far from remote surgery, but many patient visits are unnecessary. A study of 40 million patients during lockdown found that for chronic disease patients, online visits didn't affect outcomes. This method of care will only improve.
Amazon's disruption will be significant and will inspire a flood of capital, startups, and consumer brands. Mark Cuban launched a pharmacy that eliminates middlemen in January. Outcome? A 90-day supply of acid-reflux medication costs $17. Medicare could have saved $3.6 billion by buying generic drugs from Cuban's pharmacy. Other apex predators will look at different limbs of the carcass for food. Nike could enter healthcare via orthopedics, acupuncture, and chiropractic. LVMH, L'Oréal, and Estée Lauder may launch global plastic surgery brands. Hilton and Four Seasons may open hospitals. Lennar and Pulte could build "Active Living" communities that Nana would leave feet first, avoiding the expense and tragedy of dying among strangers.
Risks
Privacy matters: HIV status is different from credit card and billing address. Most customers (60%) feel fine sharing personal health data via virtual technologies, though. Unavoidable. 85% of doctors believe data-sharing and interoperability will become the norm. Amazon is the most trusted tech company for handling personal data. Not Meta: Amazon.
What about antitrust, then?
Amazon should be required to spin off AWS and/or Amazon Fulfillment and banned from promoting its own products. It should be allowed to acquire hospitals. One Medical's $3.9 billion acquisition is a drop in the bucket compared to UnitedHealth's $498 billion market valuation.
Antitrust enforcement shouldn't assume some people/firms are good/bad. It should recognize that competition is good and focus on making markets more competitive in each deal. The FTC should force asset divestitures in e-commerce, digital marketing, and social media. These companies can also promote competition in a social ill.
U.S. healthcare makes us fat, depressed, and broke. Competition has produced massive value and prosperity across most of our economy.
Dear Amazon … bring it.

Stephen Rivers
3 years ago
Because of regulations, the $3 million Mercedes-AMG ONE will not (officially) be available in the United States or Canada.
We asked Mercedes to clarify whether "customers" refers to people who have expressed interest in buying the AMG ONE but haven't made a down payment or paid in full for a production slot, and a company spokesperson told that it's the latter – "Actual customers for AMG ONE in the United States and Canada."
The Mercedes-AMG ONE has finally arrived in manufacturing form after numerous delays. This may be the most complicated and magnificent hypercar ever created, but according to Mercedes, those roads will not be found in the United States or Canada.
Despite all of the well-deserved excitement around the gorgeous AMG ONE, there was no word on when US customers could expect their cars. Our Editor-in-Chief became aware of this and contacted Mercedes to clarify the matter. Mercedes-hypercar AMG's with the F1-derived 1,049 HP 1.6-liter V6 engine will not be homologated for the US market, they've confirmed.
Mercedes has informed its customers in the United States and Canada that the ONE will not be arriving to North America after all, as of today, June 1, 2022. The whole text of the letter is included below, so sit back and wait for Mercedes to explain why we (or they) won't be getting (or seeing) the hypercar. Mercedes claims that all 275 cars it wants to produce have already been reserved, with net pricing in Europe starting at €2.75 million (about US$2.93 million at today's exchange rates), before country-specific taxes.
"The AMG-ONE was created with one purpose in mind: to provide a straight technology transfer of the World Championship-winning Mercedes-AMG Petronas Formula 1 E PERFORMANCE drive unit to the road." It's the first time a complete Formula 1 drive unit has been integrated into a road car.
Every component of the AMG ONE has been engineered to redefine high performance, with 1,000+ horsepower, four electric motors, and a blazing top speed of more than 217 mph. While the engine's beginnings are in competition, continuous research and refinement has left us with a difficult choice for the US market.
We determined that following US road requirements would considerably damage its performance and overall driving character in order to preserve the distinctive nature of its F1 powerplant. We've made the strategic choice to make the automobile available for road use in Europe, where it complies with all necessary rules."
If this is the first time US customers have heard about it, which it shouldn't be, we understand if it's a bit off-putting. The AMG ONE could very probably be Mercedes' final internal combustion hypercar of this type.
Nonetheless, we wouldn't be surprised if a few make their way to the United States via the federal government's "Show and Display" exemption provision. This legislation permits the importation of automobiles such as the AMG ONE, but only for a total of 2,500 miles per year.
The McLaren Speedtail, the Koenigsegg One:1, and the Bugatti EB110 are among the automobiles that have been imported under this special rule. We just hope we don't have to wait too long to see the ONE in the United States.

Jim Clyde Monge
3 years ago
Can You Sell Images Created by AI?
Some AI-generated artworks sell for enormous sums of money.
But can you sell AI-Generated Artwork?
Simple answer: yes.
However, not all AI services enable allow usage and redistribution of images.
Let's check some of my favorite AI text-to-image generators:
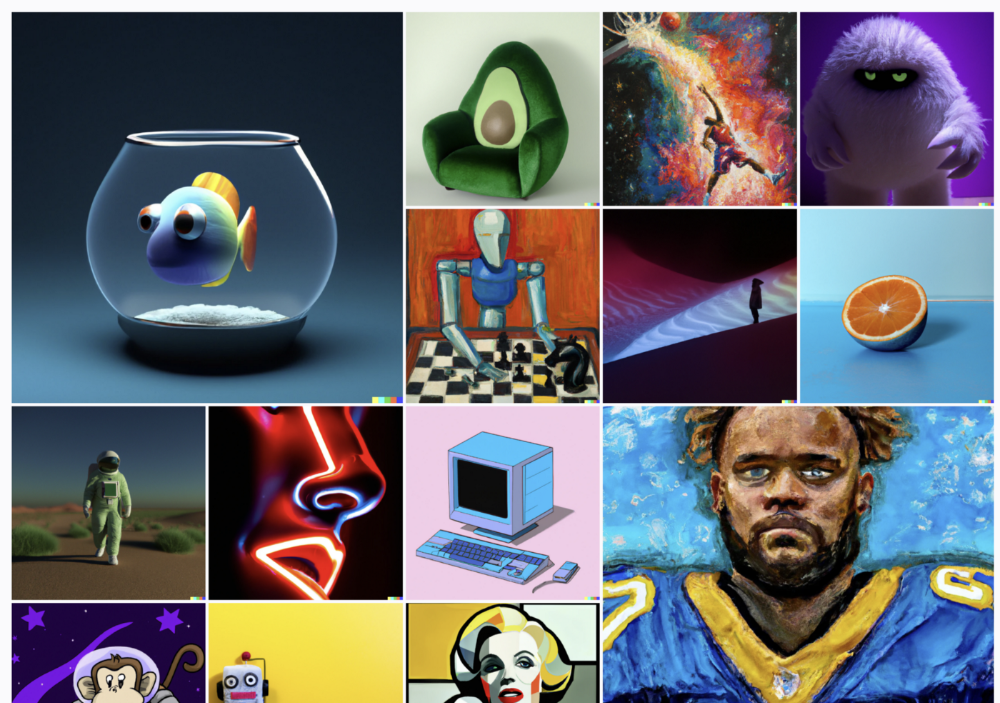
Dall-E2 by OpenAI
The AI art generator Dall-E2 is powerful. Since it’s still in beta, you can join the waitlist here.
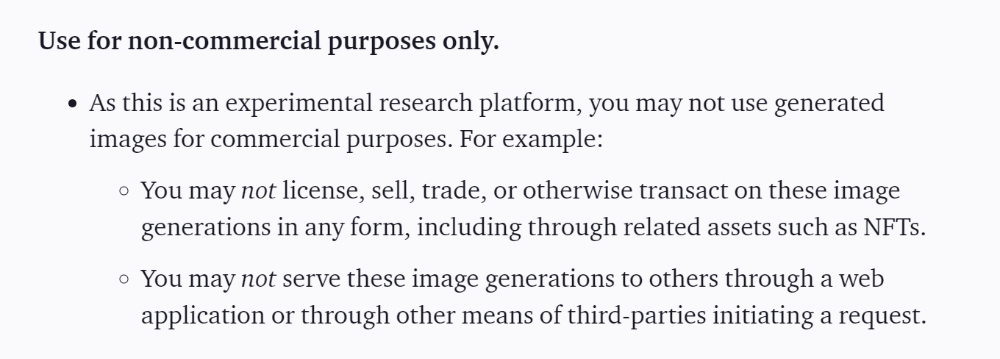
OpenAI DOES NOT allow the use and redistribution of any image for commercial purposes.
Here's the policy as of April 6, 2022.
Here are some images from Dall-E2’s webpage to show its art quality.
Several Reddit users reported receiving pricing surveys from OpenAI.
This suggests the company may bring out a subscription-based tier and a commercial license to sell images soon.
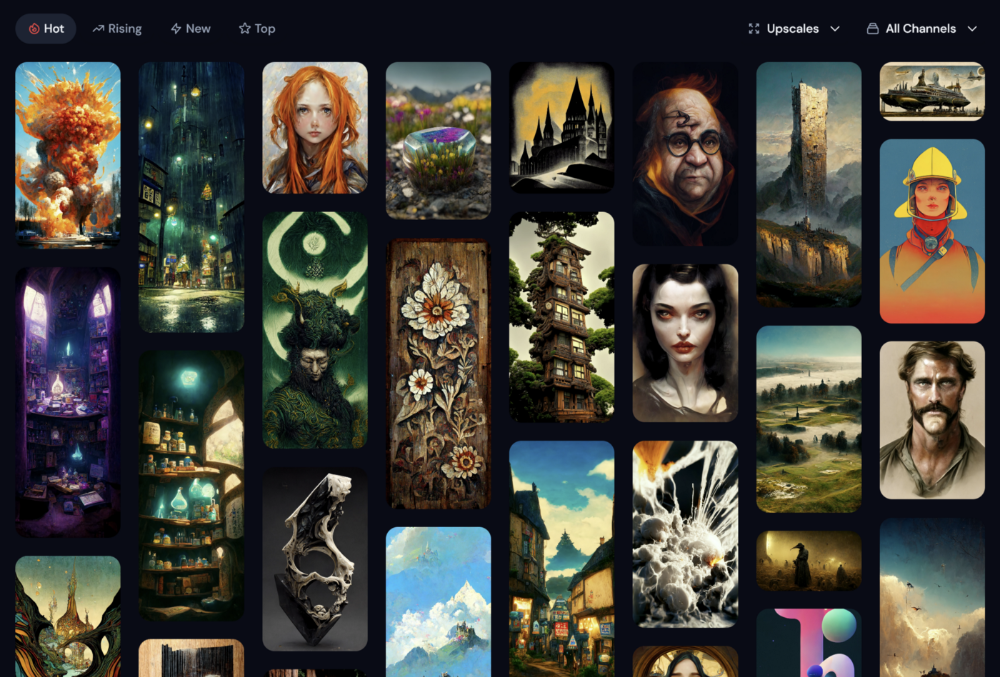
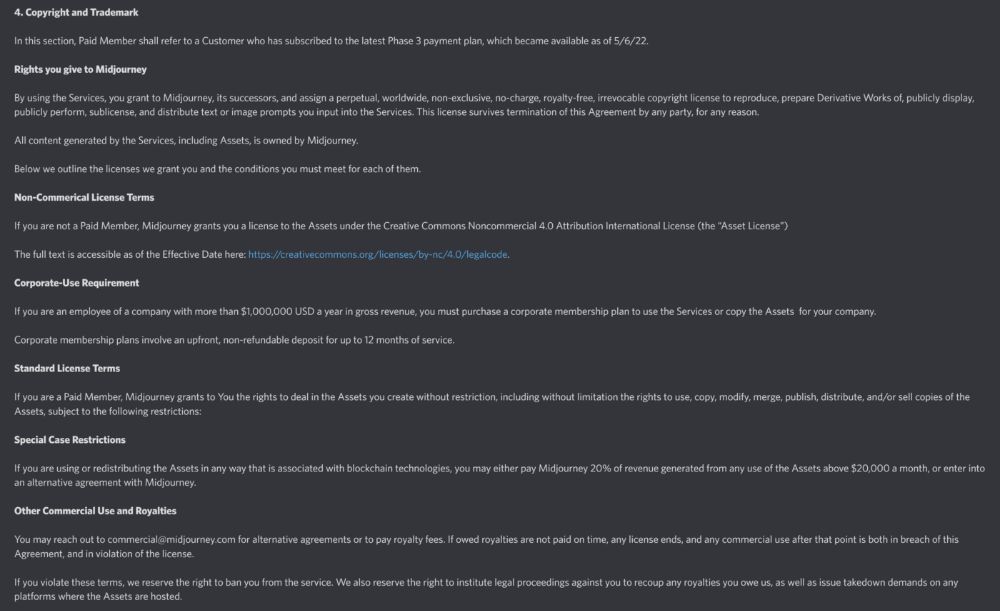
MidJourney
I like Midjourney's art generator. It makes great AI images. Here are some samples:
Standard Licenses are available for $10 per month.
Standard License allows you to use, copy, modify, merge, publish, distribute, and/or sell copies of the images, except for blockchain technologies.
If you utilize or distribute the Assets using blockchain technology, you must pay MidJourney 20% of revenue above $20,000 a month or engage in an alternative agreement.
Here's their copyright and trademark page.
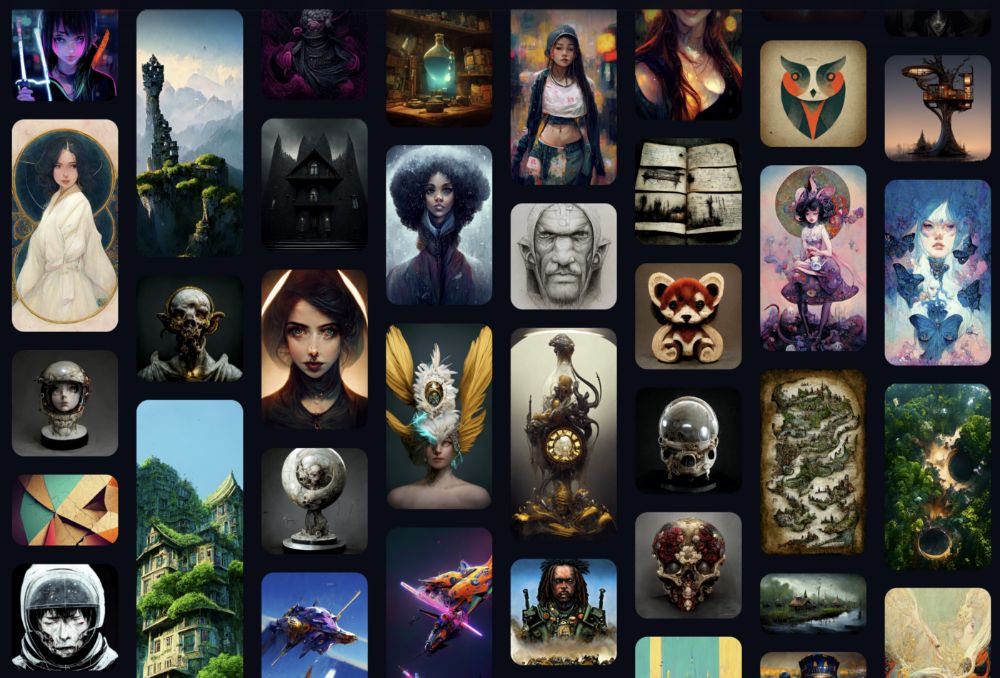
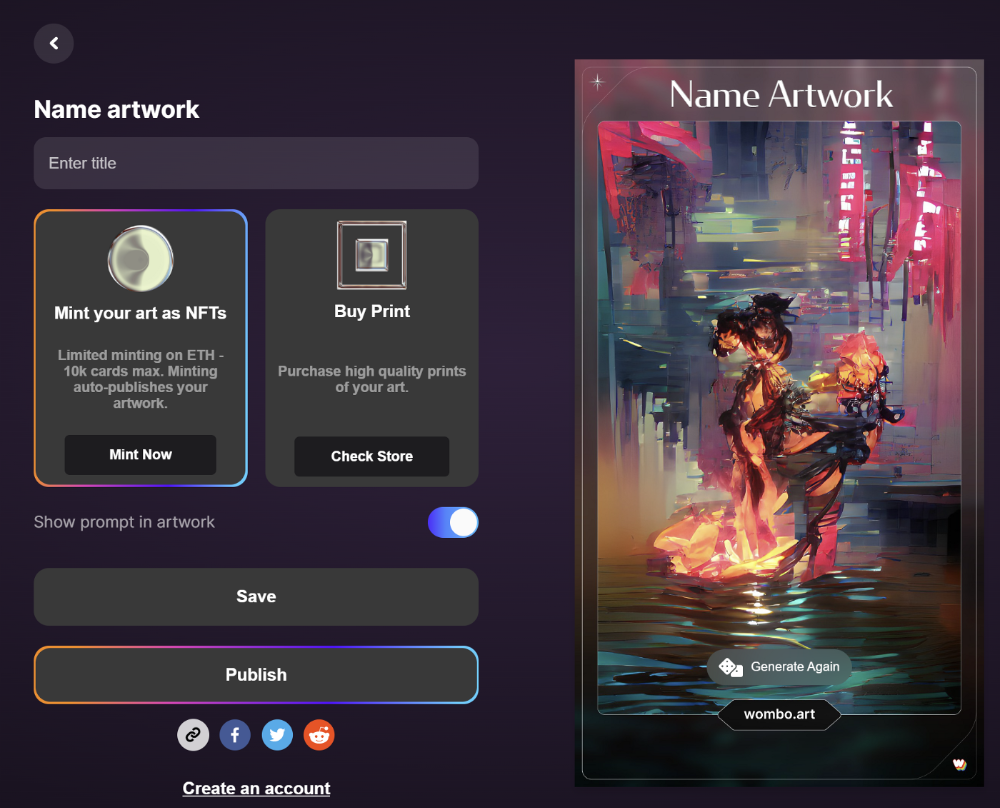
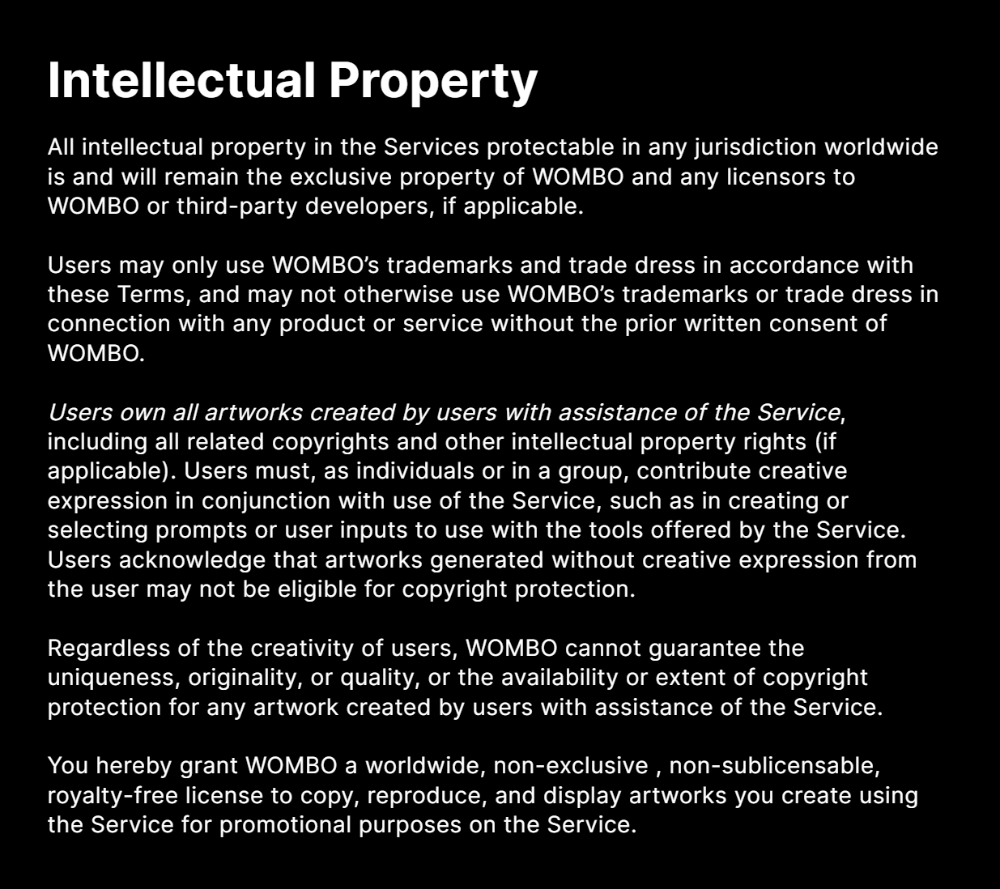
Dream by Wombo
Dream is one of the first public AI art generators.
This AI program is free, easy to use, and Wombo gives a royalty-free license to copy or share artworks.
Users own all artworks generated by the tool. Including all related copyrights or intellectual property rights.
Here’s Wombos' intellectual property policy.
Final Reflections
AI is creating a new sort of art that's selling well. It’s becoming popular and valued, despite some skepticism.
Now that you know MidJourney and Wombo let you sell AI-generated art, you need to locate buyers. There are several ways to achieve this, but that’s for another story.