


More on Entrepreneurship/Creators

Victoria Kurichenko
3 years ago
Here's what happened after I launched my second product on Gumroad.
One-hour ebook sales, affiliate relationships, and more.

If you follow me, you may know I started a new ebook in August 2022.
Despite publishing on this platform, my website, and Quora, I'm not a writer.
My writing speed is slow, 2,000 words a day, and I struggle to communicate cohesively.
In April 2022, I wrote a successful guide on How to Write Google-Friendly Blog Posts.
I had no email list or social media presence. I've made $1,600+ selling ebooks.
Evidence:
My first digital offering isn't a book.
It's an actionable guide with my tried-and-true process for writing Google-friendly content.
I'm not bragging.
Established authors like Tim Denning make more from my ebook sales with one newsletter.
This experience taught me writing isn't a privilege.
Writing a book and making money online doesn't require expertise.
Many don't consult experts. They want someone approachable.
Two years passed before I realized my own limits.
I have a brain, two hands, and Internet to spread my message.
I wrote and published a second ebook after the first's success.
On Gumroad, I released my second digital product.
Here's my complete Gumroad evaluation.
Gumroad is a marketplace for content providers to develop and sell sales pages.
Gumroad handles payments and client requests. It's helpful when someone sends a bogus payment receipt requesting an ebook (actual story!).
You'll forget administrative concerns after your first ebook sale.
After my first ebook sale, I did this: I made additional cash!
After every sale, I tell myself, "I built a new semi-passive revenue source."
This thinking shift helps me become less busy while increasing my income and quality of life.
Besides helping others, folks sell evergreen digital things to earn passive money.
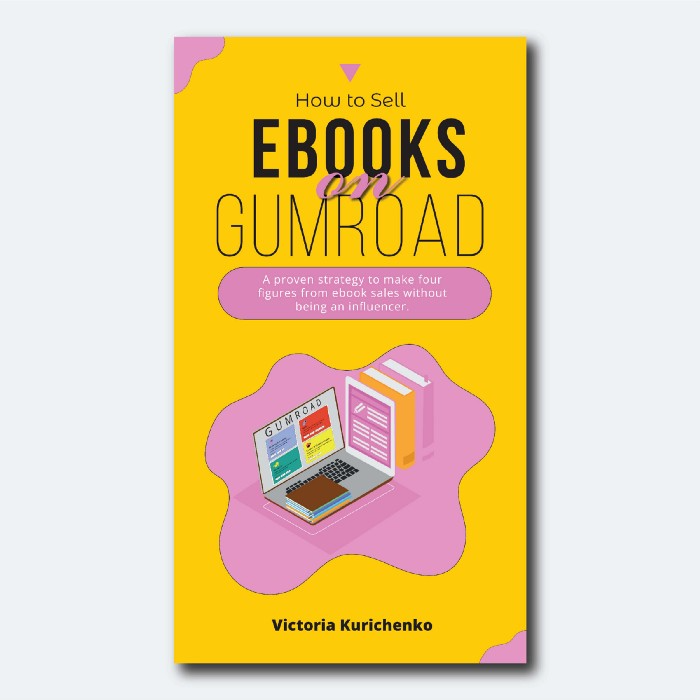
It's in my second ebook.
I explain how I built and sold 50+ copies of my SEO writing ebook without being an influencer.
I show how anyone can sell ebooks on Gumroad and automate their sales process.
This is my ebook.
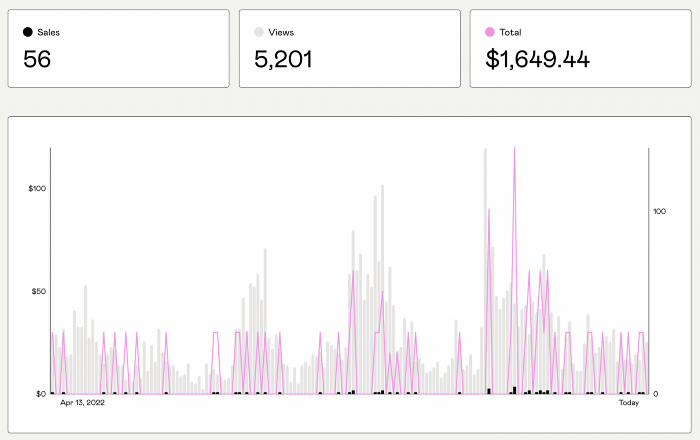
After publicizing the ebook release, I sold three copies within an hour.
Wow, or meh?
I don’t know.
The answer is different for everyone.
These three sales came from a small email list of 40 motivated fans waiting for my ebook release.
I had bigger plans.
I'll market my ebook on Medium, my website, Quora, and email.
I'm testing affiliate partnerships this time.
One of my ebook buyers is now promoting it for 40% commission.
Become my affiliate if you think your readers would like my ebook.
My ebook is a few days old, but I'm interested to see where it goes.
My SEO writing book started without an email list, affiliates, or 4,000 website visitors. I've made four figures.
I'm slowly expanding my communication avenues to have more impact.
Even a small project can open doors you never knew existed.
So began my writing career.
In summary
If you dare, every concept can become a profitable trip.
Before, I couldn't conceive of creating an ebook.
How to Sell eBooks on Gumroad is my second digital product.
Marketing and writing taught me that anything can be sold online.

Micah Daigle
3 years ago
Facebook is going away. Here are two explanations for why it hasn't been replaced yet.
And tips for anyone trying.

We see the same story every few years.
BREAKING NEWS: [Platform X] launched a social network. With Facebook's reputation down, the new startup bets millions will switch.
Despite the excitement surrounding each new platform (Diaspora, Ello, Path, MeWe, Minds, Vero, etc.), no major exodus occurred.
Snapchat and TikTok attracted teens with fresh experiences (ephemeral messaging and rapid-fire videos). These features aren't Facebook, even if Facebook replicated them.
Facebook's core is simple: you publish items (typically text/images) and your friends (generally people you know IRL) can discuss them.
It's cool. Sometimes I don't want to, but sh*t. I like it.
Because, well, I like many folks I've met. I enjoy keeping in touch with them and their banter.
I dislike Facebook's corporation. I've been cautiously optimistic whenever a Facebook-killer surfaced.
None succeeded.
Why? Two causes, I think:
People couldn't switch quickly enough, which is reason #1
Your buddies make a social network social.
Facebook started in self-contained communities (college campuses) then grew outward. But a new platform can't.
If we're expected to leave Facebook, we want to know that most of our friends will too.
Most Facebook-killers had bottlenecks. You have to waitlist or jump through hoops (e.g. setting up a server).
Same outcome. Upload. Chirp.
After a week or two of silence, individuals returned to Facebook.
Reason #2: The fundamental experience was different.
Even when many of our friends joined in the first few weeks, it wasn't the same.
There were missing features or a different UX.
Want to reply with a meme? No photos in comments yet. (Trying!)
Want to tag a friend? Nope, sorry. 2019!
Want your friends to see your post? You must post to all your friends' servers. Good luck!
It's difficult to introduce a platform with 100% of the same features as one that's been there for 20 years, yet customers want a core experience.
If you can't, they'll depart.
The causes that led to the causes
Having worked on software teams for 14+ years, I'm not surprised by these challenges. They are a natural development of a few tech sector meta-problems:
Lean startup methodology
Silicon Valley worships lean startup. It's a way of developing software that involves testing a stripped-down version with a limited number of people before selecting what to build.
Billion people use Facebook's functions. They aren't tested. It must work right away*
*This may seem weird to software people, but it's how non-software works! You can't sell a car without wheels.
2. Creativity
Startup entrepreneurs build new things, not copies. I understand. Reinventing the wheel is boring.
We know what works. Different experiences raise adoption friction. Once millions have transferred, more features (and a friendlier UX) can be implemented.
3. Cost scaling
True. Building a product that can sustain hundreds of millions of users in weeks is expensive and complex.
Your lifeboats must have the same capacity as the ship you're evacuating. It's required.
4. Pure ideologies
People who work on Facebook-alternatives are (understandably) critical of Facebook.
They build an open-source, fully-distributed, data-portable, interface-customizable, offline-capable, censorship-proof platform.
Prioritizing these aims can prevent replicating the straightforward experience users expect. Github, not Facebook, is for techies only.
What about the business plan, though?
Facebook-killer attempts have followed three models.
Utilize VC funding to increase your user base, then monetize them later. (If you do this, you won't kill Facebook; instead, Facebook will become you.)
Users must pay to utilize it. (This causes a huge bottleneck and slows the required quick expansion, preventing it from seeming like a true social network.)
Make it a volunteer-run, open-source endeavor that is free. (This typically denotes that something is cumbersome, difficult to operate, and is only for techies.)
Wikipedia is a fourth way.
Wikipedia is one of the most popular websites and a charity. No ads. Donations support them.
A Facebook-killer managed by a good team may gather millions (from affluent contributors and the crowd) for their initial phase of development. Then it might sustain on regular donations, ethical transactions (e.g. fees on commerce, business sites, etc.), and government grants/subsidies (since it would essentially be a public utility).
When you're not aiming to make investors rich, it's remarkable how little money you need.
If you want to build a Facebook competitor, follow these tips:
Drop the lean startup philosophy. Wait until you have a finished product before launching. Build it, thoroughly test it for bugs, and then release it.
Delay innovating. Wait till millions of people have switched before introducing your great new features. Make it nearly identical for now.
Spend money climbing. Make sure that guests can arrive as soon as they are invited. Never keep them waiting. Make things easy for them.
Make it accessible to all. Even if doing so renders it less philosophically pure, it shouldn't require technical expertise to utilize.
Constitute a nonprofit. Additionally, develop community ownership structures. Profit maximization is not the only strategy for preserving valued assets.
Last thoughts
Nobody has killed Facebook, but Facebook is killing itself.
The startup is burying the newsfeed to become a TikTok clone. Meta itself seems to be ditching the platform for the metaverse.
I wish I was happy, but I'm not. I miss (understandably) removed friends' postings and remarks. It could be a ghost town in a few years. My dance moves aren't TikTok-worthy.
Who will lead? It's time to develop a social network for the people.
Greetings if you're working on it. I'm not a company founder, but I like to help hard-working folks.
Benjamin Lin
3 years ago
I sold my side project for $20,000: 6 lessons I learned
How I monetized and sold an abandoned side project for $20,000

The Origin Story
I've always wanted to be an entrepreneur but never succeeded. I often had business ideas, made a landing page, and told my buddies. Never got customers.
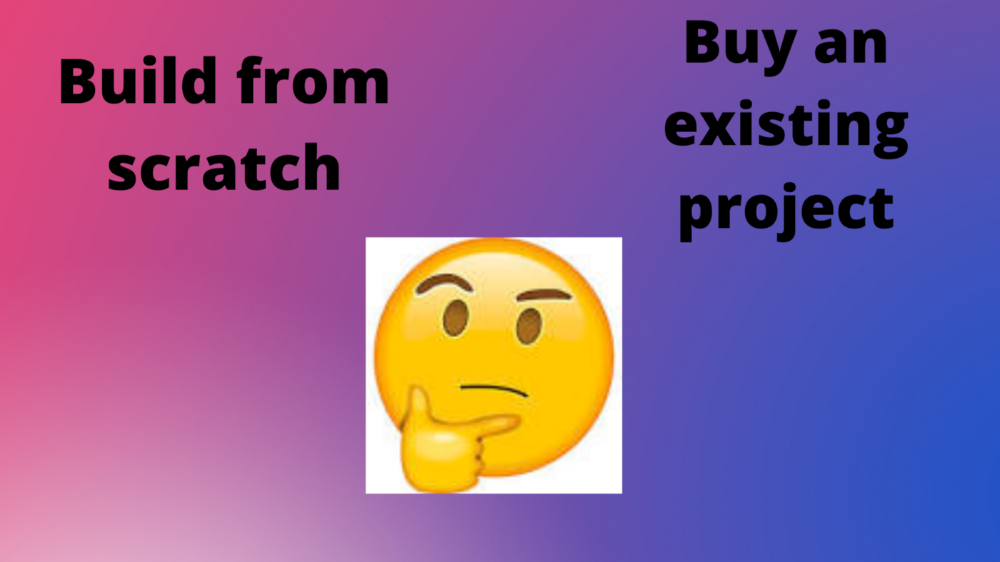
In April 2021, I decided to try again with a new strategy. I noticed that I had trouble acquiring an initial set of customers, so I wanted to start by acquiring a product that had a small user base that I could grow.
I found a SaaS marketplace called MicroAcquire.com where you could buy and sell SaaS products. I liked Shareit.video, an online Loom-like screen recorder.
Shareit.video didn't generate revenue, but 50 people visited daily to record screencasts.
Purchasing a Failed Side Project
I eventually bought Shareit.video for $12,000 from its owner.
$12,000 was probably too much for a website without revenue or registered users.
I thought time was most important. I could have recreated the website, but it would take months. $12,000 would give me an organized code base and a working product with a few users to monetize.
I considered buying a screen recording website and trying to grow it versus buying a new car or investing in crypto with the $12K.
Buying the website would make me a real entrepreneur, which I wanted more than anything.
Putting down so much money would force me to commit to the project and prevent me from quitting too soon.
A Year of Development
I rebranded the website to be called RecordJoy and worked on it with my cousin for about a year. Within a year, we made $5000 and had 3000 users.
We spent $3500 on ads, hosting, and software to run the business.
AppSumo promoted our $120 Life Time Deal in exchange for 30% of the revenue.
We put RecordJoy on maintenance mode after 6 months because we couldn't find a scalable user acquisition channel.
We improved SEO and redesigned our landing page, but nothing worked.

Despite not being able to grow RecordJoy any further, I had already learned so much from working on the project so I was fine with putting it on maintenance mode. RecordJoy still made $500 a month, which was great lunch money.
Getting Taken Over
One of our customers emailed me asking for some feature requests and I replied that we weren’t going to add any more features in the near future. They asked if we'd sell.
We got on a call with the customer and I asked if he would be interested in buying RecordJoy for 15k. The customer wanted around $8k but would consider it.
Since we were negotiating with one buyer, we put RecordJoy on MicroAcquire to see if there were other offers.

We quickly received 10+ offers. We got 18.5k. There was also about $1000 in AppSumo that we could not withdraw, so we agreed to transfer that over for $600 since about 40% of our sales on AppSumo usually end up being refunded.
Lessons Learned
First, create an acquisition channel
We couldn't discover a scalable acquisition route for RecordJoy. If I had to start another project, I'd develop a robust acquisition channel first. It might be LinkedIn, Medium, or YouTube.
Purchase Power of the Buyer Affects Acquisition Price
Some of the buyers we spoke to were individuals looking to buy side projects, as well as companies looking to launch a new product category. Individual buyers had less budgets than organizations.
Customers of AppSumo vary.
AppSumo customers value lifetime deals and low prices, which may not be a good way to build a business with recurring revenue. Designed for AppSumo users, your product may not connect with other users.
Try to increase acquisition trust
Acquisition often fails. The buyer can go cold feet, cease communicating, or run away with your stuff. Trusting the buyer ensures a smooth asset exchange. First acquisition meeting was unpleasant and price negotiation was tight. In later meetings, we spent the first few minutes trying to get to know the buyer’s motivations and background before jumping into the negotiation, which helped build trust.
Operating expenses can reduce your earnings.
Monitor operating costs. We were really happy when we withdrew the $5000 we made from AppSumo and Stripe until we realized that we had spent $3500 in operating fees. Spend money on software and consultants to help you understand what to build.
Don't overspend on advertising
We invested $1500 on Google Ads but made little money. For a side project, it’s better to focus on organic traffic from SEO rather than paid ads unless you know your ads are going to have a positive ROI.
You might also like

Marcus Lu
3 years ago
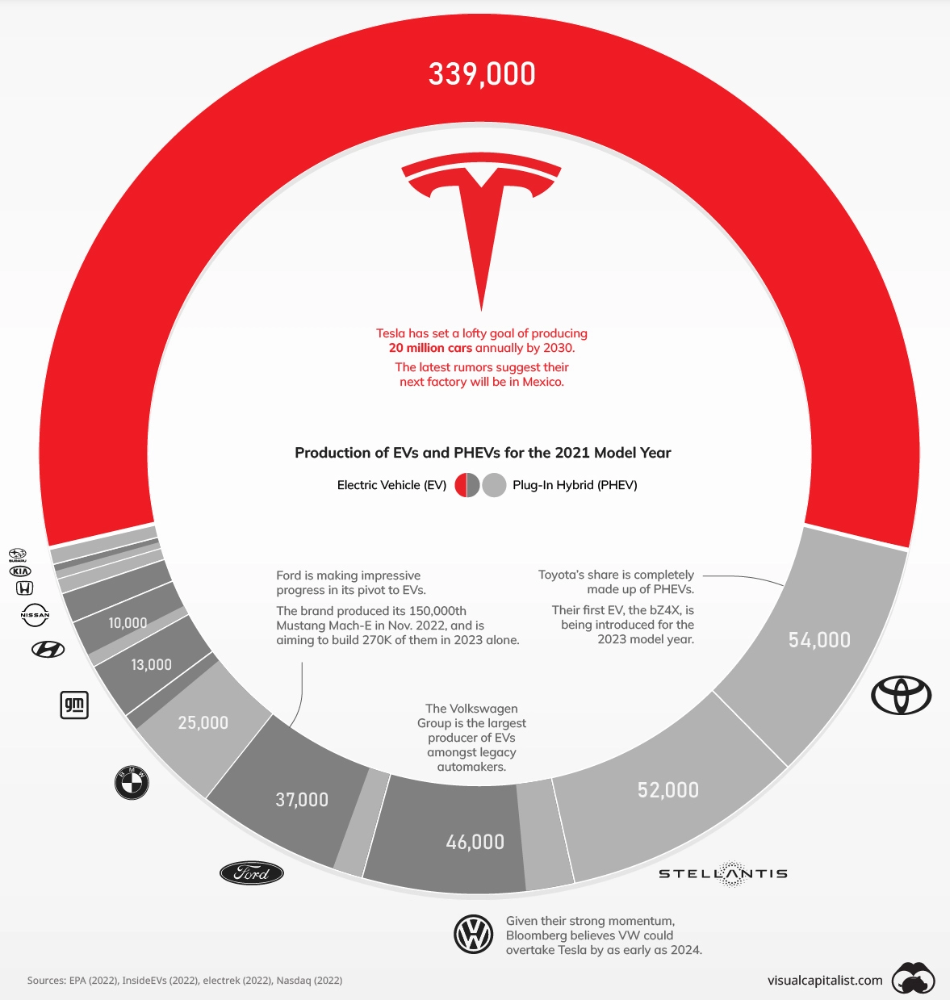
The Brand Structure of U.S. Electric Vehicle Production
Will Tesla be able to maintain its lead in the EV market for very long?
This is one of the most pressing issues in the American auto sector today. One positive aspect of Tesla is the company's devoted customer base and recognizable name recognition (similar to Apple). It also invests more in research and development per vehicle than its rivals and has a head start in EV production.
Conversely, established automakers like Volkswagen are actively plotting their strategy to surpass Tesla. As the current market leaders, they have decades of experience in the auto industry and are spending billions to catch up.
We've visualized data from the EPA's 2022 Automotive Trends Report to bring you up to speed on this developing story.
Info for the Model Year of 2021
The full production data used in this infographic is for the 2021 model year, but it comes from a report for 2022.
Combined EV and PHEV output is shown in the table below (plug-in hybrid electric vehicle).
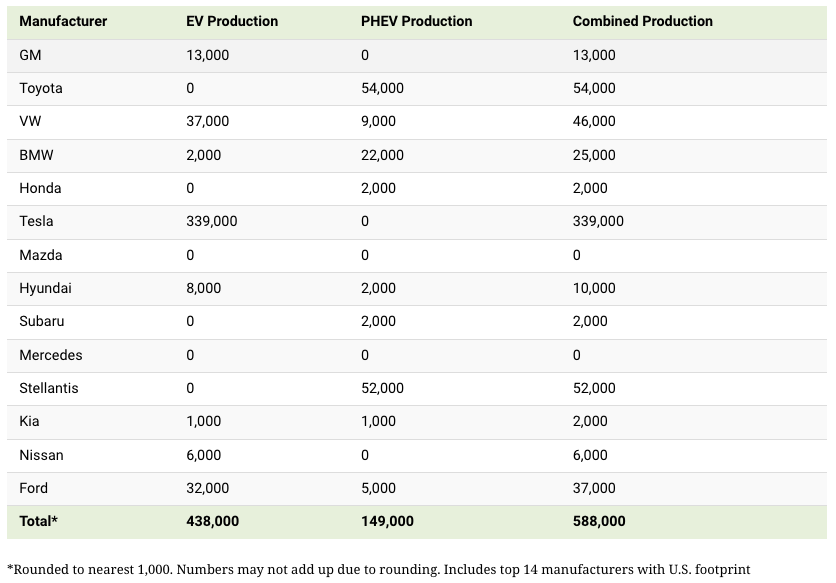
It is important to note that Toyota and Stellantis, the two largest legacy automakers in this dataset, only produced PHEVs. Toyota's first electric vehicle, the bZ4X, won't hit the market until 2023.
Stellantis seems to be falling even further behind, despite having enormous unrealized potential in its Jeep and Ram brands. Stellantis CEO Carlos Tavares said in a recent interview that the firm has budgeted $36 billion for electrification and software.
Legacy Brands with the Most Momentum
In the race to develop electric vehicles, some long-standing manufacturers have gotten the jump on their rivals.
Volkswagen, one of these storied manufacturers, has made a significant investment in electric vehicles (EVs) in the wake of the Dieselgate scandal. The company plans to roll out multiple EV models, including the ID.3 hatchback, ID.4 SUV, and ID. Buzz, with the goal of producing 22 million EVs by 2028. (an electric revival of the classic Microbus).
Even Ford is keeping up, having just announced an EV investment of $22 billion between 2021 and 2025. In November of 2022, the company manufactured their 150,000th Mustang Mach-E, and by the end of 2023, they hoped to have 270,000 of them in circulation.
Additionally, over 200,000 F-150 Lightnings have been reserved since Ford announced the truck. The Lightning is scheduled to have a production run of 15,000 in 2022, 55,000 in 2023, and 80,000 in 2024. Ford's main competitor in the electric pickup truck segment, Rivian, is on track to sell 25,000 vehicles by 2022.

Katrine Tjoelsen
3 years ago
8 Communication Hacks I Use as a Young Employee
Learn these subtle cues to gain influence.
Hate being ignored?
As a 24-year-old, I struggled at work. Attention-getting tips How to avoid being judged by my size, gender, and lack of wrinkles or gray hair?
I've learned seniority hacks. Influence. Within two years as a product manager, I led a team. I'm a Stanford MBA student.
These communication hacks can make you look senior and influential.
1. Slowly speak
We speak quickly because we're afraid of being interrupted.
When I doubt my ideas, I speak quickly. How can we slow down? Jamie Chapman says speaking slowly saps our energy.
Chapman suggests emphasizing certain words and pausing.
2. Interrupted? Stop the stopper
Someone interrupt your speech?
Don't wait. "May I finish?" No pause needed. Stop interrupting. I first tried this in Leadership Laboratory at Stanford. How quickly I gained influence amazed me.
Next time, try “May I finish?” If that’s not enough, try these other tips from Wendy R.S. O’Connor.
3. Context
Others don't always see what's obvious to you.
Through explanation, you help others see the big picture. If a senior knows it, you help them see where your work fits.
4. Don't ask questions in statements
“Your statement lost its effect when you ended it on a high pitch,” a group member told me. Upspeak, it’s called. I do it when I feel uncertain.
Upspeak loses influence and credibility. Unneeded. When unsure, we can say "I think." We can even ask a proper question.
Someone else's boasting is no reason to be dismissive. As leaders and colleagues, we should listen to our colleagues even if they use this speech pattern.
Give your words impact.
5. Signpost structure
Signposts improve clarity by providing structure and transitions.
Communication coach Alexander Lyon explains how to use "first," "second," and "third" He explains classic and summary transitions to help the listener switch topics.
Signs clarify. Clarity matters.

6. Eliminate email fluff
“Fine. When will the report be ready? — Jeff.”
Notice how senior leaders write short, direct emails? I often use formalities like "dear," "hope you're well," and "kind regards"
Formality is (usually) unnecessary.
7. Replace exclamation marks with periods
See how junior an exclamation-filled email looks:
Hi, all!
Hope you’re as excited as I am for tomorrow! We’re celebrating our accomplishments with cake! Join us tomorrow at 2 pm!
See you soon!
Why the exclamation points? Why not just one?
Hi, all.
Hope you’re as excited as I am for tomorrow. We’re celebrating our accomplishments with cake. Join us tomorrow at 2 pm!
See you soon.
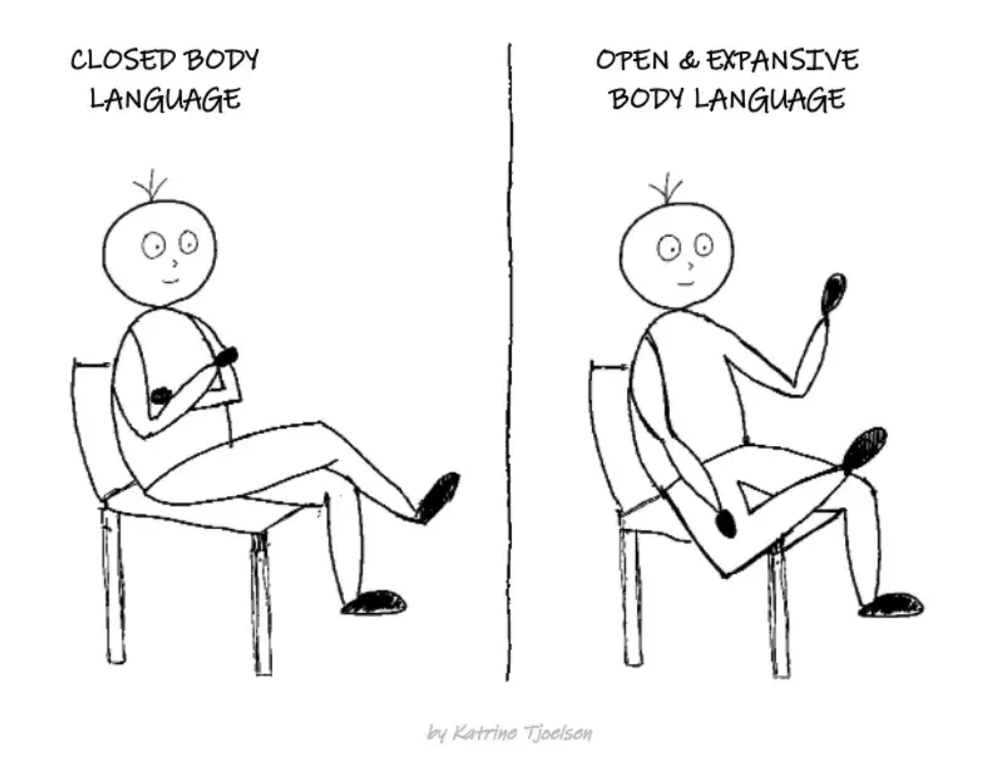
8. Take space
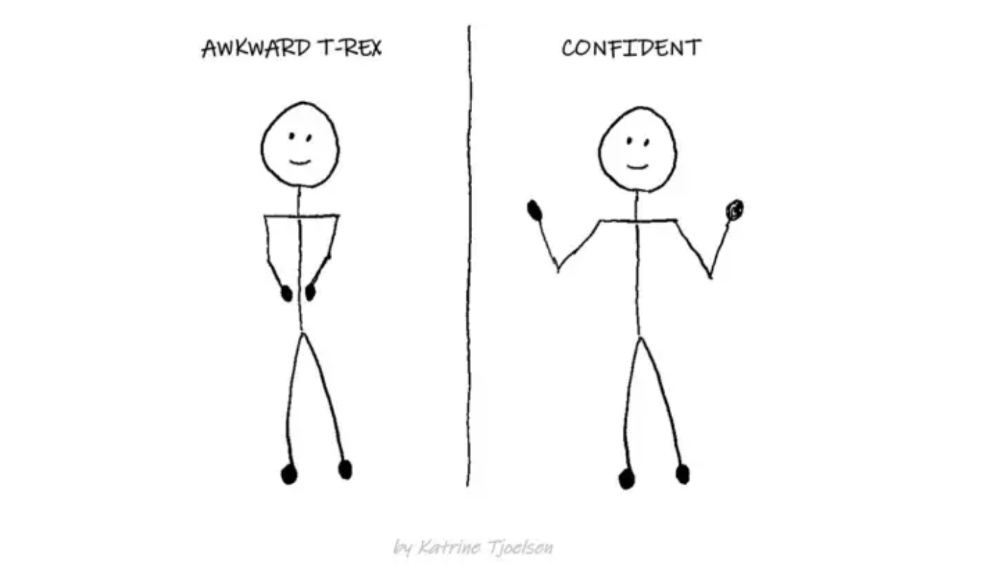
"Playing high" means having an open, relaxed body, says Stanford professor and author Deborah Gruenfield.
Crossed legs or looking small? Relax. Get bigger.

Ray Dalio
3 years ago
The latest “bubble indicator” readings.
As you know, I like to turn my intuition into decision rules (principles) that can be back-tested and automated to create a portfolio of alpha bets. I use one for bubbles. Having seen many bubbles in my 50+ years of investing, I described what makes a bubble and how to identify them in markets—not just stocks.
A bubble market has a high degree of the following:
- High prices compared to traditional values (e.g., by taking the present value of their cash flows for the duration of the asset and comparing it with their interest rates).
- Conditons incompatible with long-term growth (e.g., extrapolating past revenue and earnings growth rates late in the cycle).
- Many new and inexperienced buyers were drawn in by the perceived hot market.
- Broad bullish sentiment.
- Debt financing a large portion of purchases.
- Lots of forward and speculative purchases to profit from price rises (e.g., inventories that are more than needed, contracted forward purchases, etc.).
I use these criteria to assess all markets for bubbles. I have periodically shown you these for stocks and the stock market.
What Was Shown in January Versus Now
I will first describe the picture in words, then show it in charts, and compare it to the last update in January.
As of January, the bubble indicator showed that a) the US equity market was in a moderate bubble, but not an extreme one (ie., 70 percent of way toward the highest bubble, which occurred in the late 1990s and late 1920s), and b) the emerging tech companies (ie. As well, the unprecedented flood of liquidity post-COVID financed other bubbly behavior (e.g. SPACs, IPO boom, big pickup in options activity), making things bubbly. I showed which stocks were in bubbles and created an index of those stocks, which I call “bubble stocks.”
Those bubble stocks have popped. They fell by a third last year, while the S&P 500 remained flat. In light of these and other market developments, it is not necessarily true that now is a good time to buy emerging tech stocks.
The fact that they aren't at a bubble extreme doesn't mean they are safe or that it's a good time to get long. Our metrics still show that US stocks are overvalued. Once popped, bubbles tend to overcorrect to the downside rather than settle at “normal” prices.
The following charts paint the picture. The first shows the US equity market bubble gauge/indicator going back to 1900, currently at the 40% percentile. The charts also zoom in on the gauge in recent years, as well as the late 1920s and late 1990s bubbles (during both of these cases the gauge reached 100 percent ).
The chart below depicts the average bubble gauge for the most bubbly companies in 2020. Those readings are down significantly.
The charts below compare the performance of a basket of emerging tech bubble stocks to the S&P 500. Prices have fallen noticeably, giving up most of their post-COVID gains.
The following charts show the price action of the bubble slice today and in the 1920s and 1990s. These charts show the same market dynamics and two key indicators. These are just two examples of how a lot of debt financing stock ownership coupled with a tightening typically leads to a bubble popping.
Everything driving the bubbles in this market segment is classic—the same drivers that drove the 1920s bubble and the 1990s bubble. For instance, in the last couple months, it was how tightening can act to prick the bubble. Review this case study of the 1920s stock bubble (starting on page 49) from my book Principles for Navigating Big Debt Crises to grasp these dynamics.
The following charts show the components of the US stock market bubble gauge. Since this is a proprietary indicator, I will only show you some of the sub-aggregate readings and some indicators.
Each of these six influences is measured using a number of stats. This is how I approach the stock market. These gauges are combined into aggregate indices by security and then for the market as a whole. The table below shows the current readings of these US equity market indicators. It compares current conditions for US equities to historical conditions. These readings suggest that we’re out of a bubble.
1. How High Are Prices Relatively?
This price gauge for US equities is currently around the 50th percentile.
2. Is price reduction unsustainable?
This measure calculates the earnings growth rate required to outperform bonds. This is calculated by adding up the readings of individual securities. This indicator is currently near the 60th percentile for the overall market, higher than some of our other readings. Profit growth discounted in stocks remains high.
Even more so in the US software sector. Analysts' earnings growth expectations for this sector have slowed, but remain high historically. P/Es have reversed COVID gains but remain high historical.
3. How many new buyers (i.e., non-existing buyers) entered the market?
Expansion of new entrants is often indicative of a bubble. According to historical accounts, this was true in the 1990s equity bubble and the 1929 bubble (though our data for this and other gauges doesn't go back that far). A flood of new retail investors into popular stocks, which by other measures appeared to be in a bubble, pushed this gauge above the 90% mark in 2020. The pace of retail activity in the markets has recently slowed to pre-COVID levels.
4. How Broadly Bullish Is Sentiment?
The more people who have invested, the less resources they have to keep investing, and the more likely they are to sell. Market sentiment is now significantly negative.
5. Are Purchases Being Financed by High Leverage?
Leveraged purchases weaken the buying foundation and expose it to forced selling in a downturn. The leverage gauge, which considers option positions as a form of leverage, is now around the 50% mark.
6. To What Extent Have Buyers Made Exceptionally Extended Forward Purchases?
Looking at future purchases can help assess whether expectations have become overly optimistic. This indicator is particularly useful in commodity and real estate markets, where forward purchases are most obvious. In the equity markets, I look at indicators like capital expenditure, or how much businesses (and governments) invest in infrastructure, factories, etc. It reflects whether businesses are projecting future demand growth. Like other gauges, this one is at the 40th percentile.
What one does with it is a tactical choice. While the reversal has been significant, future earnings discounting remains high historically. In either case, bubbles tend to overcorrect (sell off more than the fundamentals suggest) rather than simply deflate. But I wanted to share these updated readings with you in light of recent market activity.