


More on Marketing

Emma Jade
3 years ago
6 hacks to create content faster
Content gurus' top time-saving hacks.

I'm a content strategist, writer, and graphic designer. Time is more valuable than money.
Money is always available. Even if you're poor. Ways exist.
Time is passing, and one day we'll run out.
Sorry to be morbid.
In today's digital age, you need to optimize how you create content for your organization. Here are six content creation hacks.
1. Use templates
Use templates to streamline your work whether generating video, images, or documents.
Setup can take hours. Using a free resource like Canva, you can create templates for any type of material.
This will save you hours each month.
2. Make a content calendar
You post without a plan? A content calendar solves 50% of these problems.
You can prepare, organize, and plan your material ahead of time so you're not scrambling when you remember, "Shit, it's Mother's Day!"
3. Content Batching
Batching content means creating a lot in one session. This is helpful for video content that requires a lot of setup time.
Batching monthly content saves hours. Time is a valuable resource.
When working on one type of task, it's easy to get into a flow state. This saves time.
4. Write Caption
On social media, we generally choose the image first and then the caption. Writing captions first sometimes work better, though.
Writing the captions first can allow you more creative flexibility and be easier if you're not excellent with language.
Say you want to tell your followers something interesting.
Writing a caption first is easier than choosing an image and then writing a caption to match.
Not everything works. You may have already-created content that needs captioning. When you don't know what to share, think of a concept, write the description, and then produce a video or graphic.
Cats can be skinned in several ways..
5. Repurpose
Reuse content when possible. You don't always require new stuff. In fact, you’re pretty stupid if you do #SorryNotSorry.
Repurpose old content. All those blog entries, videos, and unfinished content on your desk or hard drive.
This blog post can be turned into a social media infographic. Canva's motion graphic function can animate it. I can record a YouTube video regarding this issue for a podcast. I can make a post on each point in this blog post and turn it into an eBook or paid course.
And it doesn’t stop there.
My point is, to think outside the box and really dig deep into ways you can leverage the content you’ve already created.
6. Schedule Them
If you're still manually posting content, get help. When you batch your content, schedule it ahead of time.
Some scheduling apps are free or cheap. No excuses.
Don't publish and ghost.
Scheduling saves time by preventing you from doing it manually. But if you never engage with your audience, the algorithm won't reward your material.
Be online and engage your audience.
Content Machine
Use these six content creation hacks. They help you succeed and save time.

Guillaume Dumortier
3 years ago
Mastering the Art of Rhetoric: A Guide to Rhetorical Devices in Successful Headlines and Titles
Unleash the power of persuasion and captivate your audience with compelling headlines.
As the old adage goes, "You never get a second chance to make a first impression."
In the world of content creation and social ads, headlines and titles play a critical role in making that first impression.
A well-crafted headline can make the difference between an article being read or ignored, a video being clicked on or bypassed, or a product being purchased or passed over.
To make an impact with your headlines, mastering the art of rhetoric is essential. In this post, we'll explore various rhetorical devices and techniques that can help you create headlines that captivate your audience and drive engagement.
tl;dr : Headline Magician will help you craft the ultimate headline titles powered by rhetoric devices
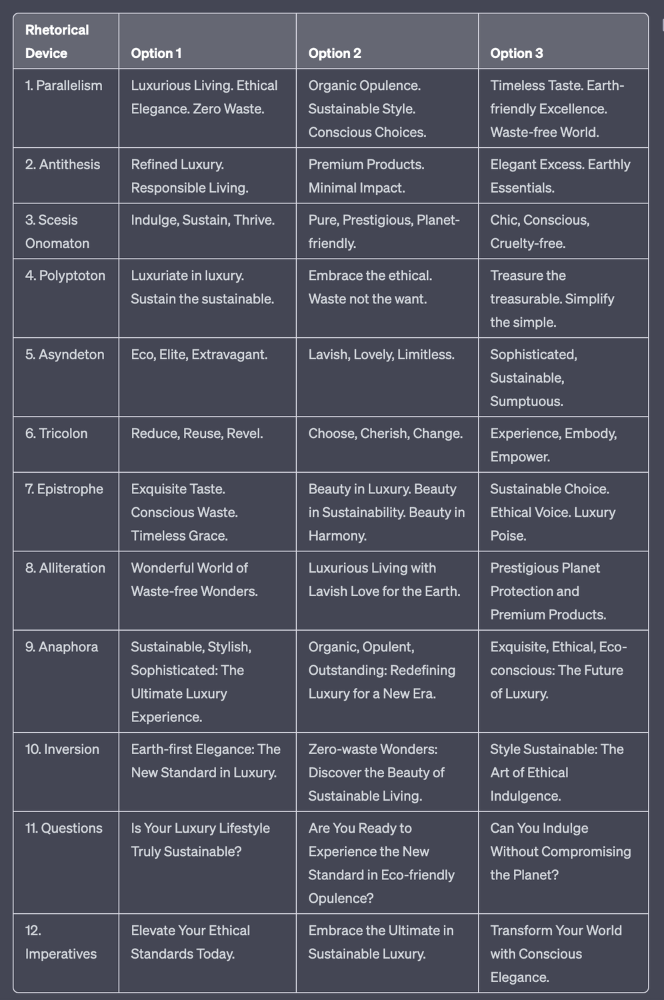
Example with a high-end luxury organic zero-waste skincare brand
✍️ The Power of Alliteration
Alliteration is the repetition of the same consonant sound at the beginning of words in close proximity. This rhetorical device lends itself well to headlines, as it creates a memorable, rhythmic quality that can catch a reader's attention.
By using alliteration, you can make your headlines more engaging and easier to remember.
Examples:
"Crafting Compelling Content: A Comprehensive Course"
"Mastering the Art of Memorable Marketing"
🔁 The Appeal of Anaphora
Anaphora is the repetition of a word or phrase at the beginning of successive clauses. This rhetorical device emphasizes a particular idea or theme, making it more memorable and persuasive.
In headlines, anaphora can be used to create a sense of unity and coherence, which can draw readers in and pique their interest.
Examples:
"Create, Curate, Captivate: Your Guide to Social Media Success"
"Innovation, Inspiration, and Insight: The Future of AI"
🔄 The Intrigue of Inversion
Inversion is a rhetorical device where the normal order of words is reversed, often to create an emphasis or achieve a specific effect.
In headlines, inversion can generate curiosity and surprise, compelling readers to explore further.
Examples:
"Beneath the Surface: A Deep Dive into Ocean Conservation"
"Beyond the Stars: The Quest for Extraterrestrial Life"
⚖️ The Persuasive Power of Parallelism
Parallelism is a rhetorical device that involves using similar grammatical structures or patterns to create a sense of balance and symmetry.
In headlines, parallelism can make your message more memorable and impactful, as it creates a pleasing rhythm and flow that can resonate with readers.
Examples:
"Eat Well, Live Well, Be Well: The Ultimate Guide to Wellness"
"Learn, Lead, and Launch: A Blueprint for Entrepreneurial Success"
⏭️ The Emphasis of Ellipsis
Ellipsis is the omission of words, typically indicated by three periods (...), which suggests that there is more to the story.
In headlines, ellipses can create a sense of mystery and intrigue, enticing readers to click and discover what lies behind the headline.
Examples:
"The Secret to Success... Revealed"
"Unlocking the Power of Your Mind... A Step-by-Step Guide"
🎭 The Drama of Hyperbole
Hyperbole is a rhetorical device that involves exaggeration for emphasis or effect.
In headlines, hyperbole can grab the reader's attention by making bold, provocative claims that stand out from the competition. Be cautious with hyperbole, however, as overuse or excessive exaggeration can damage your credibility.
Examples:
"The Ultimate Guide to Mastering Any Skill in Record Time"
"Discover the Revolutionary Technique That Will Transform Your Life"
❓The Curiosity of Questions
Posing questions in your headlines can be an effective way to pique the reader's curiosity and encourage engagement.
Questions compel the reader to seek answers, making them more likely to click on your content. Additionally, questions can create a sense of connection between the content creator and the audience, fostering a sense of dialogue and discussion.
Examples:
"Are You Making These Common Mistakes in Your Marketing Strategy?"
"What's the Secret to Unlocking Your Creative Potential?"
💥 The Impact of Imperatives
Imperatives are commands or instructions that urge the reader to take action. By using imperatives in your headlines, you can create a sense of urgency and importance, making your content more compelling and actionable.
Examples:
"Master Your Time Management Skills Today"
"Transform Your Business with These Innovative Strategies"
💢 The Emotion of Exclamations
Exclamations are powerful rhetorical devices that can evoke strong emotions and convey a sense of excitement or urgency.
Including exclamations in your headlines can make them more attention-grabbing and shareable, increasing the chances of your content being read and circulated.
Examples:
"Unlock Your True Potential: Find Your Passion and Thrive!"
"Experience the Adventure of a Lifetime: Travel the World on a Budget!"
🎀 The Effectiveness of Euphemisms
Euphemisms are polite or indirect expressions used in place of harsher, more direct language.
In headlines, euphemisms can make your message more appealing and relatable, helping to soften potentially controversial or sensitive topics.
Examples:
"Navigating the Challenges of Modern Parenting"
"Redefining Success in a Fast-Paced World"
⚡Antithesis: The Power of Opposites
Antithesis involves placing two opposite words side-by-side, emphasizing their contrasts. This device can create a sense of tension and intrigue in headlines.
Examples:
"Once a day. Every day"
"Soft on skin. Kill germs"
"Mega power. Mini size."
To utilize antithesis, identify two opposing concepts related to your content and present them in a balanced manner.
🎨 Scesis Onomaton: The Art of Verbless Copy
Scesis onomaton is a rhetorical device that involves writing verbless copy, which quickens the pace and adds emphasis.
Example:
"7 days. 7 dollars. Full access."
To use scesis onomaton, remove verbs and focus on the essential elements of your headline.
🌟 Polyptoton: The Charm of Shared Roots
Polyptoton is the repeated use of words that share the same root, bewitching words into memorable phrases.
Examples:
"Real bread isn't made in factories. It's baked in bakeries"
"Lose your knack for losing things."
To employ polyptoton, identify words with shared roots that are relevant to your content.
✨ Asyndeton: The Elegance of Omission
Asyndeton involves the intentional omission of conjunctions, adding crispness, conviction, and elegance to your headlines.
Examples:
"You, Me, Sushi?"
"All the latte art, none of the environmental impact."
To use asyndeton, eliminate conjunctions and focus on the core message of your headline.
🔮 Tricolon: The Magic of Threes
Tricolon is a rhetorical device that uses the power of three, creating memorable and impactful headlines.
Examples:
"Show it, say it, send it"
"Eat Well, Live Well, Be Well."
To use tricolon, craft a headline with three key elements that emphasize your content's main message.
🔔 Epistrophe: The Chime of Repetition
Epistrophe involves the repetition of words or phrases at the end of successive clauses, adding a chime to your headlines.
Examples:
"Catch it. Bin it. Kill it."
"Joint friendly. Climate friendly. Family friendly."
To employ epistrophe, repeat a key phrase or word at the end of each clause.

Yucel F. Sahan
3 years ago
How I Created the Day's Top Product on Product Hunt
In this article, I'll describe a weekend project I started to make something. It was Product Hunt's #1 of the Day, #2 Weekly, and #4 Monthly product.
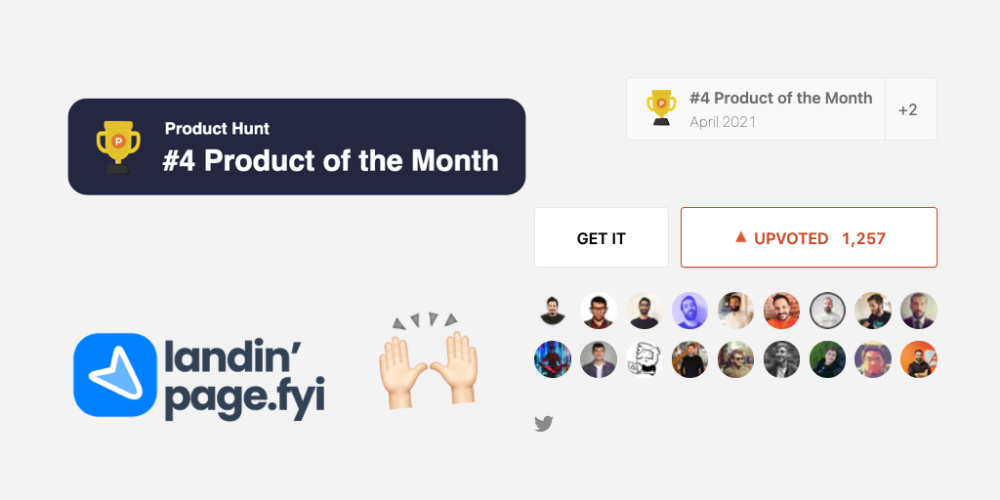

How did I make Landing Page Checklist so simple? Building and launching took 3 weeks. I worked 3 hours a day max. Weekends were busy.
It's sort of a long story, so scroll to the bottom of the page to see what tools I utilized to create Landing Page Checklist :x
As a matter of fact, it all started with the startups-investments blog; Startup Bulletin, that I started writing in 2018. No, don’t worry, I won’t be going that far behind. The twitter account where I shared the blog posts of this newsletter was inactive for a looong time. I was holding this Twitter account since 2009, I couldn’t bear to destroy it. At the same time, I was thinking how to evaluate this account.
So I looked for a weekend assignment.
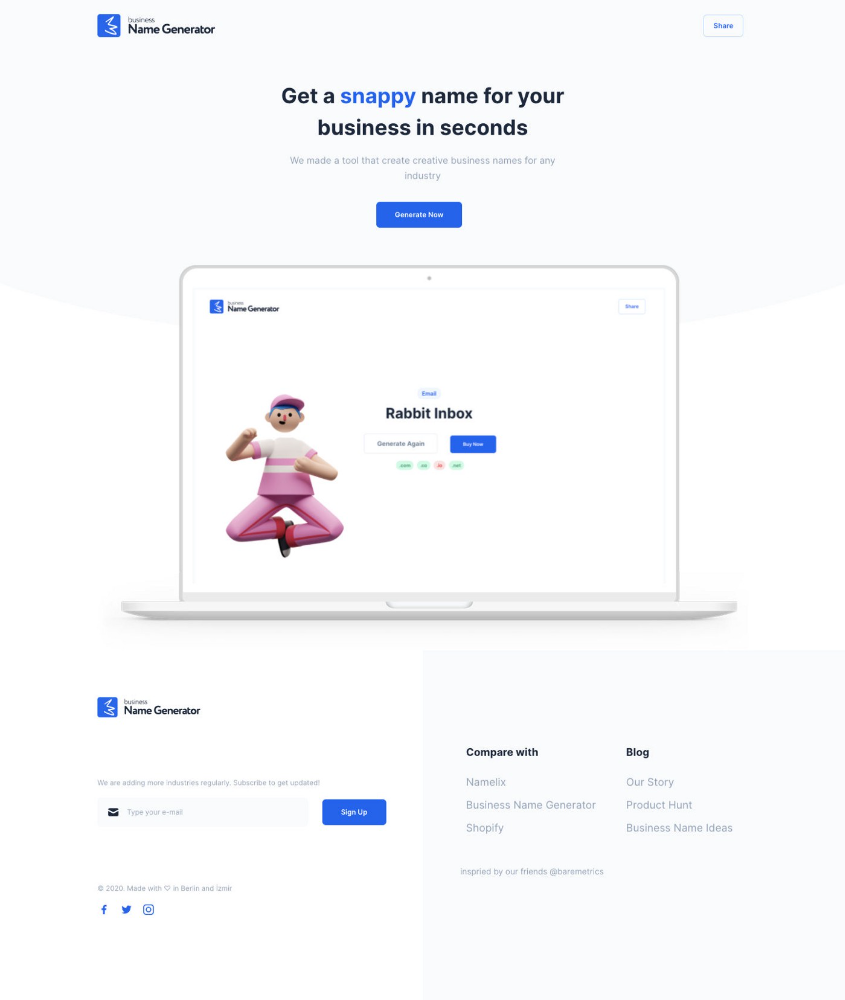
Weekend undertaking: Generate business names
Barash and I established a weekend effort to stay current. Building things helped us learn faster.
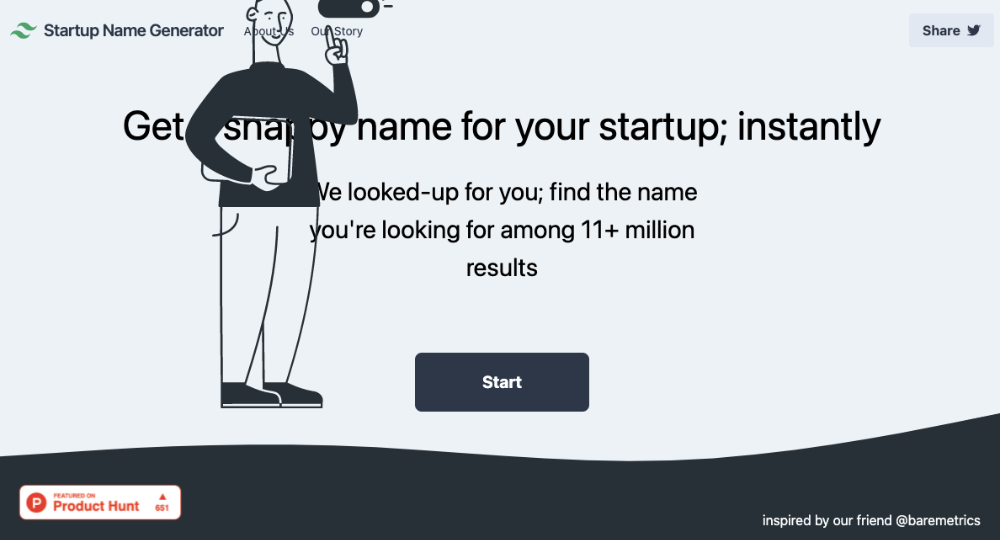
Simple. Startup Name Generator The utility generated random startup names. After market research for SEO purposes, we dubbed it Business Name Generator.
Backend developer Barash dislikes frontend work. He told me to write frontend code. Chakra UI and Tailwind CSS were recommended.
It was the first time I have heard about Tailwind CSS.
Before this project, I made mobile-web app designs in Sketch and shared them via Zeplin. I can read HTML-CSS or React code, but not write it. I didn't believe myself but followed Barash's advice.
My home page wasn't responsive when I started. Here it was:)
And then... Product Hunt had something I needed. Me-only! A website builder that gives you clean Tailwind CSS code and pre-made web components (like Elementor). Incredible.
I bought it right away because it was so easy to use. Best part: It's not just index.html. It includes all needed files. Like
postcss.config.js
README.md
package.json
among other things, tailwind.config.js

This is for non-techies.
Tailwind.build; which is Shuffle now, allows you to create and export projects for free (with limited features). You can try it by visiting their website.
After downloading the project, you can edit the text and graphics in Visual Studio (or another text editor). This HTML file can be hosted whenever.
Github is an easy way to host a landing page.
your project via Shuffle for export
your website's content, edit
Create a Gitlab, Github, or Bitbucket account.
to Github, upload your project folder.
Integrate Vercel with your Github account (or another platform below)
Allow them to guide you in steps.
Finally. If you push your code to Github using Github Desktop, you'll do it quickly and easily.
Speaking of; here are some hosting and serverless backend services for web applications and static websites for you host your landing pages for FREE!
I host landingpage.fyi on Vercel but all is fine. You can choose any platform below with peace in mind.
Vercel
Render
Netlify
After connecting your project/repo to Vercel, you don’t have to do anything on Vercel. Vercel updates your live website when you update Github Desktop. Wow!
Tails came out while I was using tailwind.build. Although it's prettier, tailwind.build is more mobile-friendly. I couldn't resist their lovely parts. Tails :)
Tails have several well-designed parts. Some components looked awful on mobile, but this bug helped me understand Tailwind CSS.
Unlike Shuffle, Tails does not include files when you export such as config.js, main.js, README.md. It just gives you the HTML code. Suffle.dev is a bit ahead in this regard and with mobile-friendly blocks if you ask me. Of course, I took advantage of both.
creativebusinessnames.co is inactive, but I'll leave a deployment link :)
Adam Wathan's YouTube videos and Tailwind's official literature helped me, but I couldn't have done it without Tails and Shuffle. These tools helped me make landing pages. I shouldn't have started over.
So began my Tailwind CSS adventure. I didn't build landingpage. I didn't plan it to be this long; sorry.
I learnt a lot while I was playing around with Shuffle and Tails Builders.
Long story short I built landingpage.fyi with the help of these tools;
Learning, building, and distribution
Shuffle (Started with a Shuffle Template)
Tails (Used components from here)
Sketch (to handle icons, logos, and .svg’s)
metatags.io (Auto Generator Meta Tags)
Vercel (Hosting)
Github Desktop (Pushing code to Github -super easy-)
Visual Studio Code (Edit my code)
Mailerlite (Capture Emails)
Jarvis / Conversion.ai (%90 of the text on website written by AI 😇 )
CookieHub (Consent Management)
That's all. A few things:
The Outcome

.fyi Domain: Why?

I'm often asked this.
I don't know, but I wanted to include the landing page term. Popular TLDs are gone. I saw my alternatives. brief and catchy.
CSS Tailwind Resources
I'll share project resources like Tails and Shuffle.
Beginner Tailwind (I lately enrolled in this course but haven’t completed it yet.)
Thanks for reading my blog's first post. Please share if you like it.
You might also like

Nir Zicherman
3 years ago
The Great Organizational Conundrum
Only two of the following three options can be achieved: consistency, availability, and partition tolerance

Someone told me that growing from 30 to 60 is the biggest adjustment for a team or business.
I remember thinking, That's random. Each company is unique. I've seen teams of all types confront the same issues during development periods. With new enterprises starting every year, we should be better at navigating growing difficulties.
As a team grows, its processes and systems break down, requiring reorganization or declining results. Why always? Why isn't there a perfect scaling model? Why hasn't that been found?
The Three Things Productive Organizations Must Have
Any company should be efficient and productive. Three items are needed:
First, it must verify that no two team members have conflicting information about the roadmap, strategy, or any input that could affect execution. Teamwork is required.
Second, it must ensure that everyone can receive the information they need from everyone else quickly, especially as teams become more specialized (an inevitability in a developing organization). It requires everyone's accessibility.
Third, it must ensure that the organization can operate efficiently even if a piece is unavailable. It's partition-tolerant.
From my experience with the many teams I've been on, invested in, or advised, achieving all three is nearly impossible. Why a perfect organization model cannot exist is clear after analysis.
The CAP Theorem: What is it?
Eric Brewer of Berkeley discovered the CAP Theorem, which argues that a distributed data storage should have three benefits. One can only have two at once.
The three benefits are consistency, availability, and partition tolerance, which implies that even if part of the system is offline, the remainder continues to work.
This notion is usually applied to computer science, but I've realized it's also true for human organizations. In a post-COVID world, many organizations are hiring non-co-located staff as they grow. CAP Theorem is more important than ever. Growing teams sometimes think they can develop ways to bypass this law, dooming themselves to a less-than-optimal team dynamic. They should adopt CAP to maximize productivity.
Path 1: Consistency and availability equal no tolerance for partitions
Let's imagine you want your team to always be in sync (i.e., for someone to be the source of truth for the latest information) and to be able to share information with each other. Only division into domains will do.
Numerous developing organizations do this, especially after the early stage (say, 30 people) when everyone may wear many hats and be aware of all the moving elements. After a certain point, it's tougher to keep generalists aligned than to divide them into specialized tasks.
In a specialized, segmented team, leaders optimize consistency and availability (i.e. every function is up-to-speed on the latest strategy, no one is out of sync, and everyone is able to unblock and inform everyone else).
Partition tolerance suffers. If any component of the organization breaks down (someone goes on vacation, quits, underperforms, or Gmail or Slack goes down), productivity stops. There's no way to give the team stability, availability, and smooth operation during a hiccup.
Path 2: Partition Tolerance and Availability = No Consistency
Some businesses avoid relying too heavily on any one person or sub-team by maximizing availability and partition tolerance (the organization continues to function as a whole even if particular components fail). Only redundancy can do that. Instead of specializing each member, the team spreads expertise so people can work in parallel. I switched from Path 1 to Path 2 because I realized too much reliance on one person is risky.
What happens after redundancy? Unreliable. The more people may run independently and in parallel, the less anyone can be the truth. Lack of alignment or updated information can lead to people executing slightly different strategies. So, resources are squandered on the wrong work.
Path 3: Partition and Consistency "Tolerance" equates to "absence"
The third, least-used path stresses partition tolerance and consistency (meaning answers are always correct and up-to-date). In this organizational style, it's most critical to maintain the system operating and keep everyone aligned. No one is allowed to read anything without an assurance that it's up-to-date (i.e. there’s no availability).
Always short-lived. In my experience, a business that prioritizes quality and scalability over speedy information transmission can get bogged down in heavy processes that hinder production. Large-scale, this is unsustainable.
Accepting CAP
When two puzzle pieces fit, the third won't. I've watched developing teams try to tackle these difficulties, only to find, as their ancestors did, that they can never be entirely solved. Idealized solutions fail in reality, causing lost effort, confusion, and lower production.
As teams develop and change, they should embrace CAP, acknowledge there is a limit to productivity in a scaling business, and choose the best two-out-of-three path.

James White
3 years ago
I read three of Elon Musk's suggested books (And His Taste Is Incredible)
A reading list for successful people

Elon Musk reads and talks. So, one learns. Many brilliant individuals & amazing literature.
This article recommends 3 Elon Musk novels. All of them helped me succeed. Hope they'll help you.
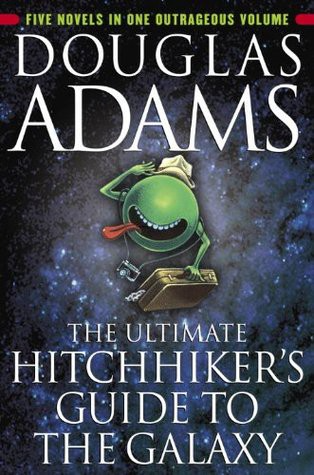
Douglas Adams's The Hitchhiker's Guide to the Galaxy
Page Count: 193
Rating on Goodreads: 4.23
Arthur Dent is pulled off Earth by a buddy seconds before it's razed for a cosmic motorway. The trio hitchhikes through space and gets into problems.
I initially read Hitchhiker's as a child. To evade my mum, I'd read with a flashlight under the covers. She'd scold at me for not sleeping on school nights when she found out. Oops.
The Hitchhiker's Guide to the Galaxy is lighthearted science fiction.
My favorite book quotes are:
“Space is big. You won’t believe how vastly, hugely, mind-bogglingly big it is. I mean, you may think it’s a long way down the road to the chemist’s, but that’s just peanuts to space.”
“Far out in the uncharted backwaters of the unfashionable end of the western spiral arm of the Galaxy lies a small unregarded yellow sun. Orbiting this at a distance of roughly ninety-two million miles is an utterly insignificant little blue-green planet whose ape-descended life forms are so amazingly primitive that they still think digital watches are a pretty neat idea.”
“On planet Earth, man had always assumed that he was more intelligent than dolphins because he had achieved so much — the wheel, New York, wars, and so on — whilst all the dolphins had ever done was muck about in the water having a good time. But conversely, the dolphins had always believed that they were far more intelligent than man — for precisely the same reasons.”
the Sun Tzu book The Art Of War
Page Count: 273
Rating on Goodreads: 3.97
It's a classic. You may apply The Art of War's ideas to (nearly) every facet of life. Ex:
Pick your fights.
Keep in mind that timing is crucial.
Create a backup plan in case something goes wrong.
Obstacles provide us a chance to adapt and change.
This book was my first. Since then, I'm a more strategic entrepreneur. Excellent book. And read it ASAP!
My favorite book quotes are:
“Victorious warriors win first and then go to war, while defeated warriors go to war first and then seek to win.”
“Engage people with what they expect; it is what they are able to discern and confirms their projections. It settles them into predictable patterns of response, occupying their minds while you wait for the extraordinary moment — that which they cannot anticipate.”
“If you know the enemy and know yourself, you need not fear the result of a hundred battles. If you know yourself but not the enemy, for every victory gained, you will also suffer a defeat. If you know neither the enemy nor yourself, you will succumb in every battle.”
Peter Thiel's book Zero to One
Page Count: 195
Rating on Goodreads: 4.18
Peter argues the best money-making strategies are typically unproven. Entrepreneurship should never have a defined path to success. Whoever says differently is lying.
Zero to One explores technology and society. Peter is a philosophy major and law school graduate, which informs the work.
Peters' ideas, depth, and intellect stood out in Zero to One. It's a top business book.
My favorite book quotes are:
“The most valuable businesses of coming decades will be built by entrepreneurs who seek to empower people rather than try to make them obsolete.”
“The next Bill Gates will not build an operating system. The next Larry Page or Sergey Brin won’t make a search engine. And the next Mark Zuckerberg won’t create a social network. If you are copying these guys, you aren’t learning from them.”
“If your goal is to never make a mistake in your life, you shouldn’t look for secrets. The prospect of being lonely but right — dedicating your life to something that no one else believes in — is already hard. The prospect of being lonely and wrong can be unbearable.”

Katharine Valentino
4 years ago
A Gun-toting Teacher Is Like a Cook With Rat Poison
Pink or blue AR-15s?
A teacher teaches; a gun kills. Killing isn't teaching. Killing is opposite of teaching.
Without 27 school shootings this year, we wouldn't be talking about arming teachers. Gun makers, distributors, and the NRA cause most school shootings. Gun makers, distributors, and the NRA wouldn't be huge business if weapons weren't profitable.
Guns, ammo, body armor, holsters, concealed carriers, bore sights, cleaner kits, spare magazines and speed loaders, gun safes, and ear protection are sold. And more guns.
And lots more profit.
Guns aren't bread. You eat a loaf of bread in a week or so and then must buy more. Bread makers will make money. Winchester 94.30–30 1899 Lever Action Rifle from 1894 still kills. (For safety, I won't link to the ad.) Gun makers don't object if you collect antique weapons, but they need you to buy the latest, in-style killing machine. The youngster who killed 19 students and 2 teachers at Robb Elementary School in Uvalde, Texas, used an AR-15. Better yet, two.
Salvador Ramos, the Robb Elementary shooter, is a "killing influencer" He pushes consumers to buy items, which benefits manufacturers and distributors. Like every previous AR-15 influencer, he profits Colt, the rifle's manufacturer, and 52,779 gun dealers in the U.S. Ramos and other AR-15 influences make us fear for our safety and our children's. Fearing for our safety, we acquire 20 million firearms a year and live in a gun culture.
So now at school, we want to arm teachers.
Consider. Which of your teachers would you have preferred in body armor with a gun drawn?
Miss Summers? Remember her bringing daisies from her yard to second grade? She handed each student a beautiful flower. Miss Summers loved everyone, even those with AR-15s. She can't shoot.
Frasier? Mr. Frasier turned a youngster over down to explain "invert." Mr. Frasier's hands shook when he wasn't flipping fifth-graders and fractions. He may have shot wrong.
Mrs. Barkley barked in high school English class when anyone started an essay with "But." Mrs. Barkley dubbed Abie a "Jewboy" and gave him terrible grades. Arming Miss Barkley is like poisoning the chef.
Think back. Do you remember a teacher with a gun? No. Arming teachers so the gun industry can make more money is the craziest idea ever.
Or maybe you agree with Ted Cruz, the gun lobby-bought senator, that more guns reduce gun violence. After the next school shooting, you'll undoubtedly talk about arming teachers and pupils. Colt will likely develop a backpack-sized, lighter version of its popular killing machine in pink and blue for kids and boys. The MAR-15? (M for mini).
This post is a summary. Read the full one here.