


More on Personal Growth

Jari Roomer
3 years ago
Successful people have this one skill.
Without self-control, you'll waste time chasing dopamine fixes.
I found a powerful quote in Tony Robbins' Awaken The Giant Within:
“Most of the challenges that we have in our personal lives come from a short-term focus” — Tony Robbins
Most people are short-term oriented, but highly successful people are long-term oriented.
Successful people act in line with their long-term goals and values, while the rest are distracted by short-term pleasures and dopamine fixes.
Instant gratification wrecks lives
Instant pleasure is fleeting. Quickly fading effects leave you craving more stimulation.
Before you know it, you're in a cycle of quick fixes. This explains binging on food, social media, and Netflix.
These things cause a dopamine spike, which is entertaining. This dopamine spike crashes quickly, leaving you craving more stimulation.
It's fine to watch TV or play video games occasionally. Problems arise when brain impulses aren't controlled. You waste hours chasing dopamine fixes.
Instant gratification becomes problematic when it interferes with long-term goals, happiness, and life fulfillment.
Most rewarding things require delay
Life's greatest rewards require patience and delayed gratification. They must be earned through patience, consistency, and effort.
Ex:
A fit, healthy body
A deep connection with your spouse
A thriving career/business
A healthy financial situation
These are some of life's most rewarding things, but they take work and patience. They all require the ability to delay gratification.
To have a healthy bank account, you must save (and invest) a large portion of your monthly income. This means no new tech or clothes.
If you want a fit, healthy body, you must eat better and exercise three times a week. So no fast food and Netflix.
It's a battle between what you want now and what you want most.
Successful people choose what they want most over what they want now. It's a major difference.
Instant vs. delayed gratification
Most people subconsciously prefer instant rewards over future rewards, even if the future rewards are more significant.
We humans aren't logical. Emotions and instincts drive us. So we act against our goals and values.
Fortunately, instant gratification bias can be overridden. This is a modern superpower. Effective methods include:
#1: Train your brain to handle overstimulation
Training your brain to function without constant stimulation is a powerful change. Boredom can lead to long-term rewards.
Unlike impulsive shopping, saving money is boring. Having lots of cash is amazing.
Compared to video games, deep work is boring. A successful online business is rewarding.
Reading books is boring compared to scrolling through funny videos on social media. Knowledge is invaluable.
You can't do these things if your brain is overstimulated. Your impulses will control you. To reduce overstimulation addiction, try:
Daily meditation (10 minutes is enough)
Daily study/work for 90 minutes (no distractions allowed)
First hour of the day without phone, social media, and Netflix
Nature walks, journaling, reading, sports, etc.
#2: Make Important Activities Less Intimidating
Instant gratification helps us cope with stress. Starting a book or business can be intimidating. Video games and social media offer a quick escape in such situations.
Make intimidating tasks less so. Break them down into small tasks. Start a new business/side-hustle by:
Get domain name
Design website
Write out a business plan
Research competition/peers
Approach first potential client
Instead of one big mountain, divide it into smaller sub-tasks. This makes a task easier and less intimidating.
#3: Plan ahead for important activities
Distractions will invade unplanned time. Your time is dictated by your impulses, which are usually Netflix, social media, fast food, and video games. It wants quick rewards and dopamine fixes.
Plan your days and be proactive with your time. Studies show that scheduling activities makes you 3x more likely to do them.
To achieve big goals, you must plan. Don't gamble.
Want to get fit? Schedule next week's workouts. Want a side-job? Schedule your work time.
Matthew Royse
3 years ago
Ten words and phrases to avoid in presentations
Don't say this in public!
Want to wow your audience? Want to deliver a successful presentation? Do you want practical takeaways from your presentation?
Then avoid these phrases.
Public speaking is difficult. People fear public speaking, according to research.
"Public speaking is people's biggest fear, according to studies. Number two is death. "Sounds right?" — Comedian Jerry Seinfeld
Yes, public speaking is scary. These words and phrases will make your presentation harder.
Using unnecessary words can weaken your message.
You may have prepared well for your presentation and feel confident. During your presentation, you may freeze up. You may blank or forget.
Effective delivery is even more important than skillful public speaking.
Here are 10 presentation pitfalls.
1. I or Me
Presentations are about the audience, not you. Replace "I or me" with "you, we, or us." Focus on your audience. Reward them with expertise and intriguing views about your issue.
Serve your audience actionable items during your presentation, and you'll do well. Your audience will have a harder time listening and engaging if you're self-centered.
2. Sorry if/for
Your presentation is fine. These phrases make you sound insecure and unprepared. Don't pressure the audience to tell you not to apologize. Your audience should focus on your presentation and essential messages.
3. Excuse the Eye Chart, or This slide's busy
Why add this slide if you're utilizing these phrases? If you don't like this slide, change it before presenting. After the presentation, extra data can be provided.
Don't apologize for unclear slides. Hide or delete a broken PowerPoint slide. If so, divide your message into multiple slides or remove the "business" slide.
4. Sorry I'm Nervous
Some think expressing yourself will win over the audience. Nerves are horrible. Even public speakers are nervous.
Nerves aren't noticeable. What's the point? Let the audience judge your nervousness. Please don't make this obvious.
5. I'm not a speaker or I've never done this before.
These phrases destroy credibility. People won't listen and will check their phones or computers.
Why present if you use these phrases?
Good speakers aren't necessarily public speakers. Be confident in what you say. When you're confident, many people will like your presentation.
6. Our Key Differentiators Are
Overused term. It's widely utilized. This seems "salesy," and your "important differentiators" are probably like a competitor's.
This statement has been diluted; say, "what makes us different is..."
7. Next Slide
Many slides or stories? Your presentation needs transitions. They help your viewers understand your argument.
You didn't transition well when you said "next slide." Think about organic transitions.
8. I Didn’t Have Enough Time, or I’m Running Out of Time
The phrase "I didn't have enough time" implies that you didn't care about your presentation. This shows the viewers you rushed and didn't care.
Saying "I'm out of time" shows poor time management. It means you didn't rehearse enough and plan your time well.
9. I've been asked to speak on
This phrase is used to emphasize your importance. This phrase conveys conceit.
When you say this sentence, you tell others you're intelligent, skilled, and appealing. Don't utilize this term; focus on your topic.
10. Moving On, or All I Have
These phrases don't consider your transitions or presentation's end. People recall a presentation's beginning and end.
How you end your discussion affects how people remember it. You must end your presentation strongly and use natural transitions.
Conclusion
10 phrases to avoid in a presentation. I or me, sorry if or sorry for, pardon the Eye Chart or this busy slide, forgive me if I appear worried, or I'm really nervous, and I'm not good at public speaking, I'm not a speaker, or I've never done this before.
Please don't use these phrases: next slide, I didn't have enough time, I've been asked to speak about, or that's all I have.
We shouldn't make public speaking more difficult than it is. We shouldn't exacerbate a difficult issue. Better public speakers avoid these words and phrases.
“Remember not only to say the right thing in the right place, but far more difficult still, to leave unsaid the wrong thing at the tempting moment.” — Benjamin Franklin, Founding Father
This is a summary. See the original post here.
Matthew Royse
3 years ago
7 ways to improve public speaking
How to overcome public speaking fear and give a killer presentation

"Public speaking is people's biggest fear, according to studies. Death's second. The average person is better off in the casket than delivering the eulogy." — American comedian, actor, writer, and producer Jerry Seinfeld
People fear public speaking, according to research. Public speaking can be intimidating.
Most professions require public speaking, whether to 5, 50, 500, or 5,000 people. Your career will require many presentations. In a small meeting, company update, or industry conference.
You can improve your public speaking skills. You can reduce your anxiety, improve your performance, and feel more comfortable speaking in public.
“If I returned to college, I'd focus on writing and public speaking. Effective communication is everything.” — 38th president Gerald R. Ford
You can deliver a great presentation despite your fear of public speaking. There are ways to stay calm while speaking and become a more effective public speaker.
Seven tips to improve your public speaking today. Let's help you overcome your fear (no pun intended).
Know your audience.
"You're not being judged; the audience is." — Entrepreneur, author, and speaker Seth Godin
Understand your audience before speaking publicly. Before preparing a presentation, know your audience. Learn what they care about and find useful.
Your presentation may depend on where you're speaking. A classroom is different from a company meeting.
Determine your audience before developing your main messages. Learn everything about them. Knowing your audience helps you choose the right words, information (thought leadership vs. technical), and motivational message.
2. Be Observant
Observe others' speeches to improve your own. Watching free TED Talks on education, business, science, technology, and creativity can teach you a lot about public speaking.
What worked and what didn't?
What would you change?
Their strengths
How interesting or dull was the topic?
Note their techniques to learn more. Studying the best public speakers will amaze you.
Learn how their stage presence helped them communicate and captivated their audience. Please note their pauses, humor, and pacing.
3. Practice
"A speaker should prepare based on what he wants to learn, not say." — Author, speaker, and pastor Tod Stocker
Practice makes perfect when it comes to public speaking. By repeating your presentation, you can find your comfort zone.
When you've practiced your presentation many times, you'll feel natural and confident giving it. Preparation helps overcome fear and anxiety. Review notes and important messages.
When you know the material well, you can explain it better. Your presentation preparation starts before you go on stage.
Keep a notebook or journal of ideas, quotes, and examples. More content means better audience-targeting.
4. Self-record
Videotape your speeches. Check yourself. Body language, hands, pacing, and vocabulary should be reviewed.
Best public speakers evaluate their performance to improve.
Write down what you did best, what you could improve and what you should stop doing after watching a recording of yourself. Seeing yourself can be unsettling. This is how you improve.
5. Remove text from slides
"Humans can't read and comprehend screen text while listening to a speaker. Therefore, lots of text and long, complete sentences are bad, bad, bad.” —Communications expert Garr Reynolds
Presentation slides shouldn't have too much text. 100-slide presentations bore the audience. Your slides should preview what you'll say to the audience.
Use slides to emphasize your main point visually.
If you add text, use at least 40-point font. Your slides shouldn't require squinting to read. You want people to watch you, not your slides.
6. Body language
"Body language is powerful." We had body language before speech, and 80% of a conversation is read through the body, not the words." — Dancer, writer, and broadcaster Deborah Bull
Nonverbal communication dominates. Our bodies speak louder than words. Don't fidget, rock, lean, or pace.
Relax your body to communicate clearly and without distraction through nonverbal cues. Public speaking anxiety can cause tense body language.
Maintain posture and eye contact. Don’t put your hand in your pockets, cross your arms, or stare at your notes. Make purposeful hand gestures that match what you're saying.
7. Beginning/ending Strong
Beginning and end are memorable. Your presentation must start strong and end strongly. To engage your audience, don't sound robotic.
Begin with a story, stat, or quote. Conclude with a summary of key points. Focus on how you will start and end your speech.
You should memorize your presentation's opening and closing. Memorize something naturally. Excellent presentations start and end strong because people won't remember the middle.
Bringing It All Together
Seven simple yet powerful ways to improve public speaking. Know your audience, study others, prepare and rehearse, record yourself, remove as much text as possible from slides, and start and end strong.
Follow these tips to improve your speaking and audience communication. Prepare, practice, and learn from great speakers to reduce your fear of public speaking.
"Speaking to one person or a thousand is public speaking." — Vocal coach Roger Love
You might also like

Farhad Malik
3 years ago
How This Python Script Makes Me Money Every Day
Starting a passive income stream with data science and programming
My website is fresh. But how do I monetize it?
Creating a passive-income website is difficult. Advertise first. But what useful are ads without traffic?
Let’s Generate Traffic And Put Our Programming Skills To Use
SEO boosts traffic (Search Engine Optimisation). Traffic generation is complex. Keywords matter more than text, URL, photos, etc.
My Python skills helped here. I wanted to find relevant, Google-trending keywords (tags) for my topic.
First The Code
I wrote the script below here.
import re
from string import punctuation

import nltk
from nltk import TreebankWordTokenizer, sent_tokenize
from nltk.corpus import stopwords


class KeywordsGenerator:
    def __init__(self, pytrends):
        self._pytrends = pytrends

    def generate_tags(self, file_path, top_words=30):
        file_text = self._get_file_contents(file_path)
        clean_text = self._remove_noise(file_text)
        top_words = self._get_top_words(clean_text, top_words)
        suggestions = []
        for top_word in top_words:
            suggestions.extend(self.get_suggestions(top_word))
        suggestions.extend(top_words)
        tags = self._clean_tokens(suggestions)
        return ",".join(list(set(tags)))

    def _remove_noise(self, text):
        #1. Convert Text To Lowercase and remove numbers
        lower_case_text = str.lower(text)
        just_text = re.sub(r'\d+', '', lower_case_text)
        #2. Tokenise Paragraphs To words
        list = sent_tokenize(just_text)
        tokenizer = TreebankWordTokenizer()
        tokens = tokenizer.tokenize(just_text)
        #3. Clean text
        clean = self._clean_tokens(tokens)
        return clean

    def _clean_tokens(self, tokens):
        clean_words = [w for w in tokens if w not in punctuation]
        stopwords_to_remove = stopwords.words('english')
        clean = [w for w in clean_words if w not in stopwords_to_remove and not w.isnumeric()]
        return clean

    def get_suggestions(self, keyword):
        print(f'Searching pytrends for {keyword}')
        result = []
        self._pytrends.build_payload([keyword], cat=0, timeframe='today 12-m')
        data = self._pytrends.related_queries()[keyword]['top']
        if data is None or data.values is None:
            return result
        result.extend([x[0] for x in data.values.tolist()][:2])
        return result

    def _get_file_contents(self, file_path):
        return open(file_path, "r", encoding='utf-8',errors='ignore').read()

    def _get_top_words(self, words, top):
        counts = dict()

        for word in words:
            if word in counts:
                counts[word] += 1
            else:
                counts[word] = 1

        return list({k: v for k, v in sorted(counts.items(), key=lambda item: item[1])}.keys())[:top]


if __name__ == "1__main__":
    from pytrends.request import TrendReq

    nltk.download('punkt')
    nltk.download('stopwords')
    pytrends = TrendReq(hl='en-GB', tz=360)
    tags = KeywordsGenerator(pytrends)\
              .generate_tags('text_file.txt')
    print(tags)
Then The Dependencies
This script requires:
nltk==3.7
pytrends==4.8.0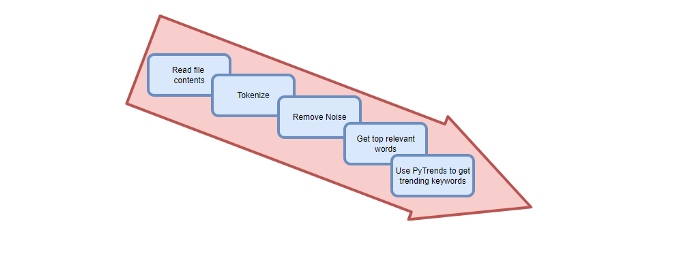
Analysis of the Script
I copy and paste my article into text file.txt, and the code returns the keywords as a comma-separated string.
To achieve this:
A class I made is called KeywordsGenerator.
This class has a function:
generate_tagsThe function
generate_tagsperforms the following tasks:
retrieves text file contents
uses NLP to clean the text by tokenizing sentences into words, removing punctuation, and other elements.
identifies the most frequent words that are relevant.
The
pytrendsAPI is then used to retrieve related phrases that are trending for each word from Google.finally adds a comma to the end of the word list.
4. I then use the keywords and paste them into the SEO area of my website.
These terms are trending on Google and relevant to my topic. My site's rankings and traffic have improved since I added new keywords. This little script puts our knowledge to work. I shared the script in case anyone faces similar issues.
I hope it helps readers sell their work.

Jan-Patrick Barnert
3 years ago
Wall Street's Bear Market May Stick Around
If history is any guide, this bear market might be long and severe.
This is the S&P 500 Index's fourth such incident in 20 years. The last bear market of 2020 was a "shock trade" caused by the Covid-19 pandemic, although earlier ones in 2000 and 2008 took longer to bottom out and recover.
Peter Garnry, head of equities strategy at Saxo Bank A/S, compares the current selloff to the dotcom bust of 2000 and the 1973-1974 bear market marked by soaring oil prices connected to an OPEC oil embargo. He blamed high tech valuations and the commodity crises.
"This drop might stretch over a year and reach 35%," Garnry wrote.
Here are six bear market charts.
Time/depth
The S&P 500 Index plummeted 51% between 2000 and 2002 and 58% during the global financial crisis; it took more than 1,000 trading days to recover. The former took 638 days to reach a bottom, while the latter took 352 days, suggesting the present selloff is young.
Valuations
Before the tech bubble burst in 2000, valuations were high. The S&P 500's forward P/E was 25 times then. Before the market fell this year, ahead values were near 24. Before the global financial crisis, stocks were relatively inexpensive, but valuations dropped more than 40%, compared to less than 30% now.
Earnings
Every stock crash, especially earlier bear markets, returned stocks to fundamentals. The S&P 500 decouples from earnings trends but eventually recouples.
Support
Central banks won't support equity investors just now. The end of massive monetary easing will terminate a two-year bull run that was among the strongest ever, and equities may struggle without cheap money. After years of "don't fight the Fed," investors must embrace a new strategy.
Bear Haunting Bear
If the past is any indication, rising government bond yields are bad news. After the financial crisis, skyrocketing rates and a falling euro pushed European stock markets back into bear territory in 2011.
Inflation/rates
The current monetary policy climate differs from past bear markets. This is the first time in a while that markets face significant inflation and rising rates.
This post is a summary. Read full article here
Isobel Asher Hamilton
3 years ago
$181 million in bitcoin buried in a dump. $11 million to get them back
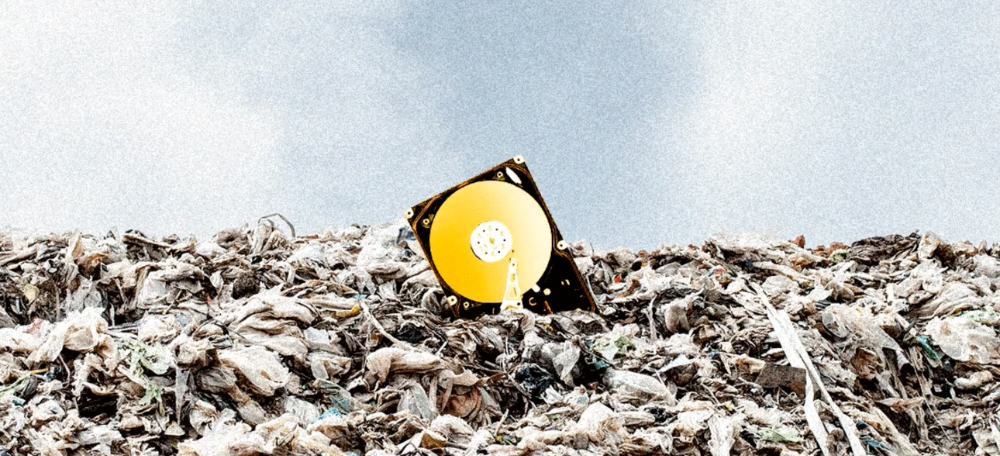
James Howells lost 8,000 bitcoins. He has $11 million to get them back.
His life altered when he threw out an iPhone-sized hard drive.
Howells, from the city of Newport in southern Wales, had two identical laptop hard drives squirreled away in a drawer in 2013. One was blank; the other had 8,000 bitcoins, currently worth around $181 million.
He wanted to toss out the blank one, but the drive containing the Bitcoin went to the dump.
He's determined to reclaim his 2009 stash.
Howells, 36, wants to arrange a high-tech treasure hunt for bitcoins. He can't enter the landfill.

Newport's city council has rebuffed Howells' requests to dig for his hard drive for almost a decade, stating it would be expensive and environmentally destructive.
I got an early look at his $11 million idea to search 110,000 tons of trash. He expects submitting it to the council would convince it to let him recover the hard disk.
110,000 tons of trash, 1 hard drive
Finding a hard disk among heaps of trash may seem Herculean.
Former IT worker Howells claims it's possible with human sorters, robot dogs, and an AI-powered computer taught to find hard drives on a conveyor belt.
His idea has two versions, depending on how much of the landfill he can search.
His most elaborate solution would take three years and cost $11 million to sort 100,000 metric tons of waste. Scaled-down version costs $6 million and takes 18 months.
He's created a team of eight professionals in AI-powered sorting, landfill excavation, garbage management, and data extraction, including one who recovered Columbia's black box data.
The specialists and their companies would be paid a bonus if they successfully recovered the bitcoin stash.
Howells: "We're trying to commercialize this project."
Howells claimed rubbish would be dug up by machines and sorted near the landfill.
Human pickers and a Max-AI machine would sort it. The machine resembles a scanner on a conveyor belt.
Remi Le Grand of Max-AI told us it will train AI to recognize Howells-like hard drives. A robot arm would select candidates.
Howells has added security charges to his scheme because he fears people would steal the hard drive.
He's budgeted for 24-hour CCTV cameras and two robotic "Spot" canines from Boston Dynamics that would patrol at night and look for his hard drive by day.
Howells said his crew met in May at the Celtic Manor Resort outside Newport for a pitch rehearsal.
Richard Hammond's narrative swings from banal to epic.
Richard Hammond filmed the meeting and created a YouTube documentary on Howells.
Hammond said of Howells' squad, "They're committed and believe in him and the idea."
Hammond: "It goes from banal to gigantic." "If I were in his position, I wouldn't have the strength to answer the door."
Howells said trash would be cleaned and repurposed after excavation. Reburying the rest.
"We won't pollute," he declared. "We aim to make everything better."

After the project is finished, he hopes to develop a solar or wind farm on the dump site. The council is unlikely to accept his vision soon.
A council representative told us, "Mr. Howells can't convince us of anything." "His suggestions constitute a significant ecological danger, which we can't tolerate and are forbidden by our permit."
Will the recovered hard drive work?
The "platter" is a glass or metal disc that holds the hard drive's data. Howells estimates 80% to 90% of the data will be recoverable if the platter isn't damaged.
Phil Bridge, a data-recovery expert who consulted Howells, confirmed these numbers.
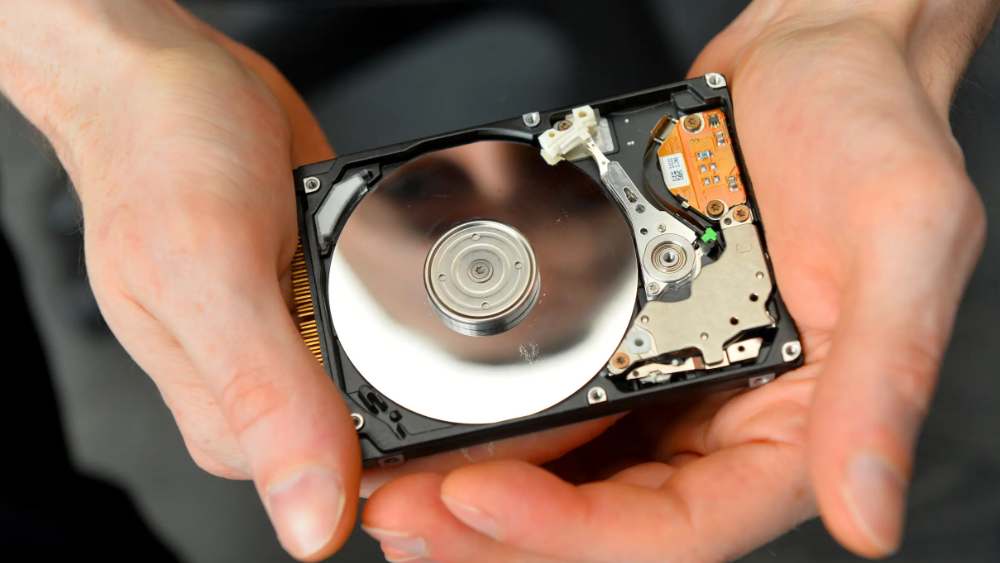
If the platter is broken, Bridge adds, data recovery is unlikely.
Bridge says he was intrigued by the proposal. "It's an intriguing case," he added. Helping him get it back and proving everyone incorrect would be a great success story.
Who'd pay?
Swiss and German venture investors Hanspeter Jaberg and Karl Wendeborn told us they would fund the project if Howells received council permission.
Jaberg: "It's a needle in a haystack and a high-risk investment."
Howells said he had no contract with potential backers but had discussed the proposal in Zoom meetings. "Until Newport City Council gives me something in writing, I can't commit," he added.
Suppose he finds the bitcoins.
Howells said he would keep 30% of the data, worth $54 million, if he could retrieve it.
A third would go to the recovery team, 30% to investors, and the remainder to local purposes, including gifting £50 ($61) in bitcoin to each of Newport's 150,000 citizens.
Howells said he opted to spend extra money on "professional firms" to help convince the council.
What if the council doesn't approve?
If Howells can't win the council's support, he'll sue, claiming its actions constitute a "illegal embargo" on the hard drive. "I've avoided that path because I didn't want to cause complications," he stated. I wanted to cooperate with Newport's council.
Howells never met with the council face-to-face. He mentioned he had a 20-minute Zoom meeting in May 2021 but thought his new business strategy would help.
He met with Jessica Morden on June 24. Morden's office confirmed meeting.
After telling the council about his proposal, he can only wait. "I've never been happier," he said. This is our most professional operation, with the best employees.
The "crypto proponent" buys bitcoin every month and sells it for cash.
Howells tries not to think about what he'd do with his part of the money if the hard disk is found functional. "Otherwise, you'll go mad," he added.
This post is a summary. Read the full article here.