


More on Technology

Tim Soulo
3 years ago
Here is why 90.63% of Pages Get No Traffic From Google.
The web adds millions or billions of pages per day.
How much Google traffic does this content get?
In 2017, we studied 2 million randomly-published pages to answer this question. Only 5.7% of them ranked in Google's top 10 search results within a year of being published.
94.3 percent of roughly two million pages got no Google traffic.
Two million pages is a small sample compared to the entire web. We did another study.
We analyzed over a billion pages to see how many get organic search traffic and why.
How many pages get search traffic?
90% of pages in our index get no Google traffic, and 5.2% get ten visits or less.
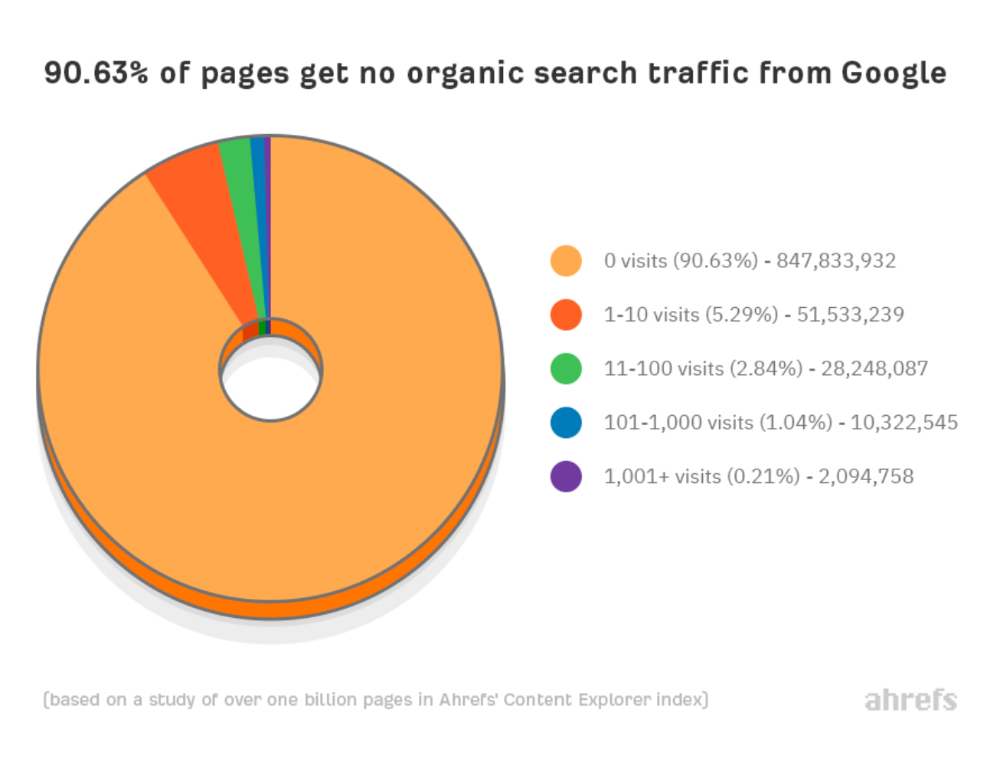
90% of google pages get no organic traffic
How can you join the minority that gets Google organic search traffic?
There are hundreds of SEO problems that can hurt your Google rankings. If we only consider common scenarios, there are only four.
Reason #1: No backlinks
I hate to repeat what most SEO articles say, but it's true:
Backlinks boost Google rankings.
Google's "top 3 ranking factors" include them.
Why don't we divide our studied pages by the number of referring domains?
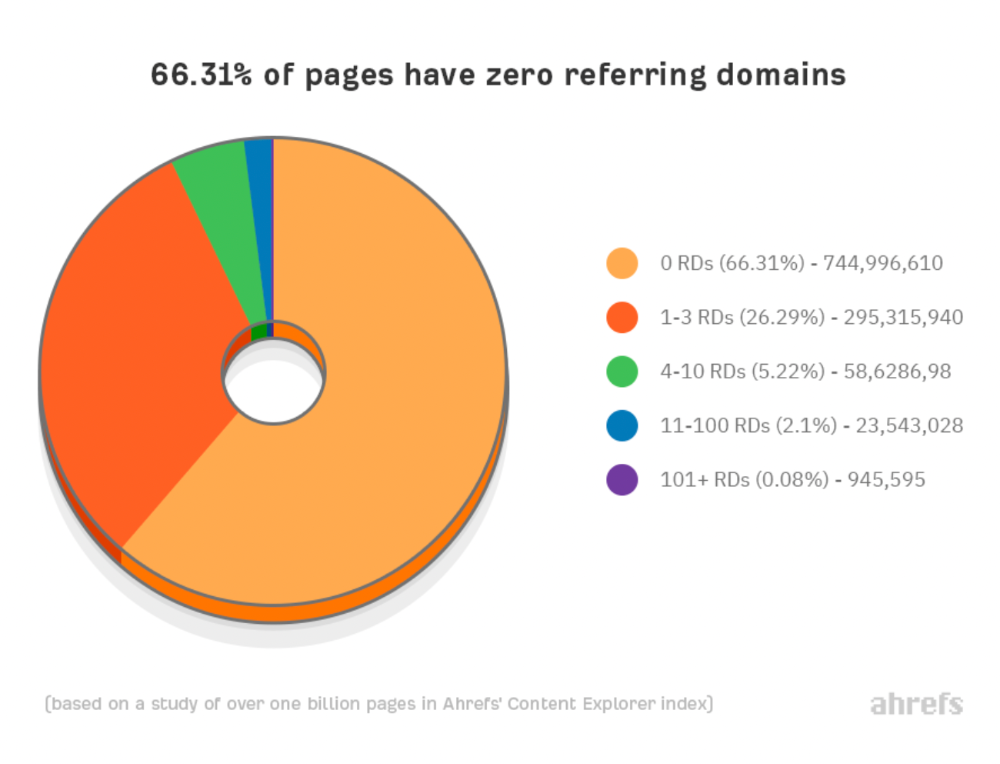
66.31 percent of pages have no backlinks, and 26.29 percent have three or fewer.
Did you notice the trend already?
Most pages lack search traffic and backlinks.
But are these the same pages?
Let's compare monthly organic search traffic to backlinks from unique websites (referring domains):
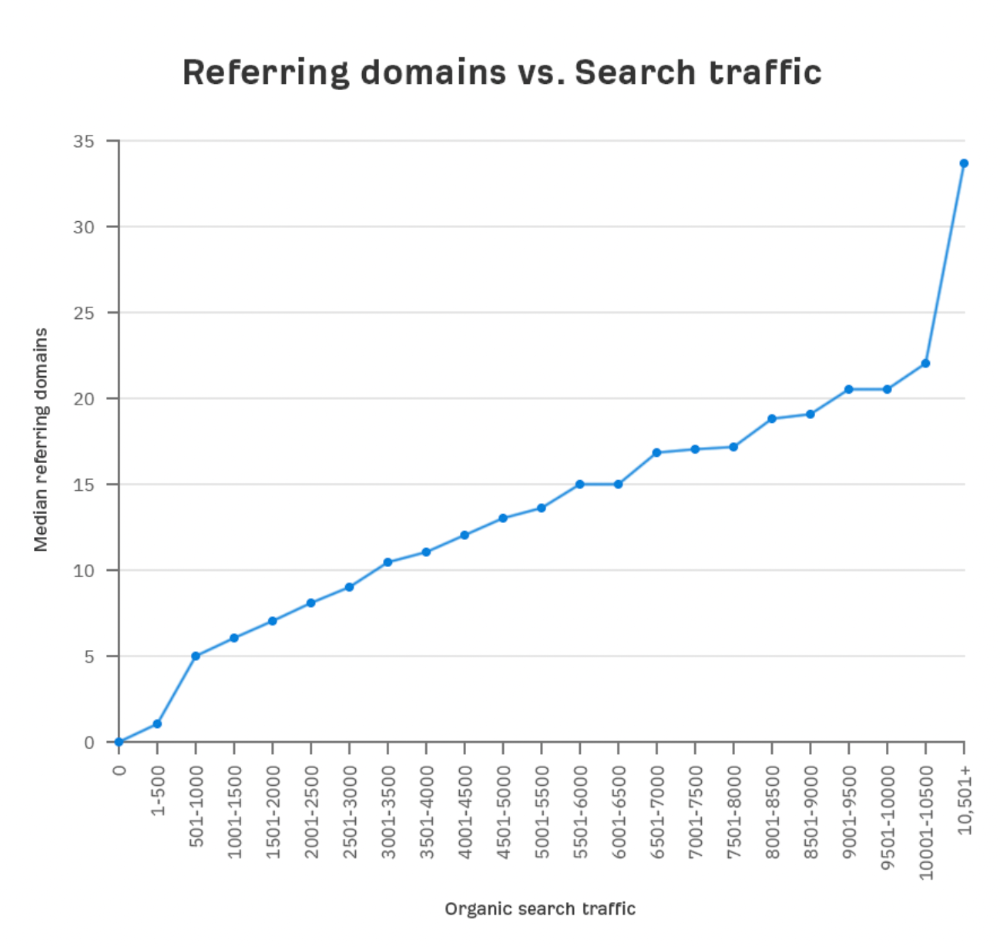
More backlinks equals more Google organic traffic.
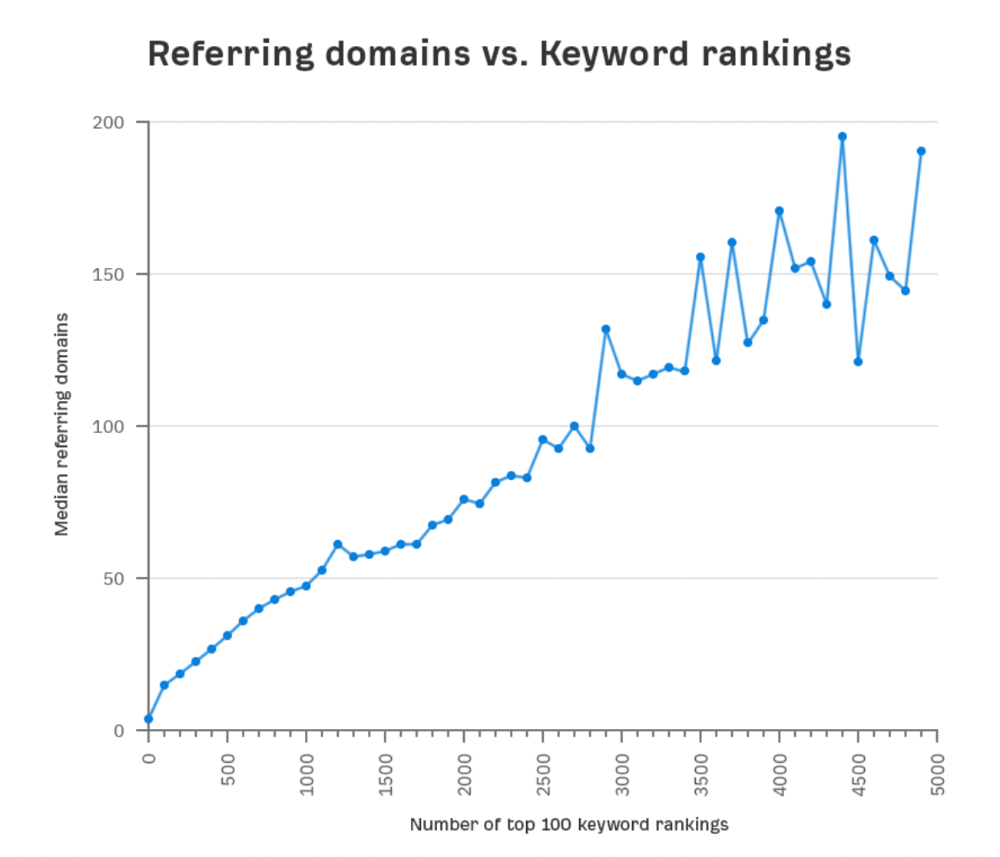
Referring domains and keyword rankings are correlated.
It's important to note that correlation does not imply causation, and none of these graphs prove backlinks boost Google rankings. Most SEO professionals agree that it's nearly impossible to rank on the first page without backlinks.
You'll need high-quality backlinks to rank in Google and get search traffic.
Is organic traffic possible without links?
Here are the numbers:
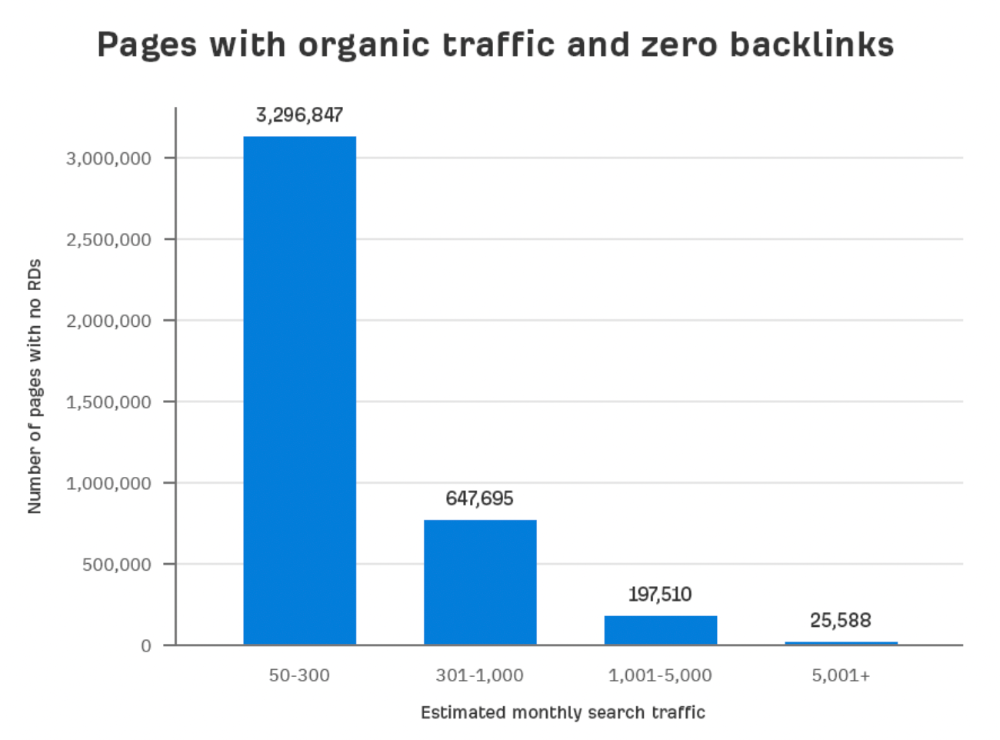
Four million pages get organic search traffic without backlinks. Only one in 20 pages without backlinks has traffic, which is 5% of our sample.
Most get 300 or fewer organic visits per month.
What happens if we exclude high-Domain-Rating pages?
The numbers worsen. Less than 4% of our sample (1.4 million pages) receive organic traffic. Only 320,000 get over 300 monthly organic visits, or 0.1% of our sample.
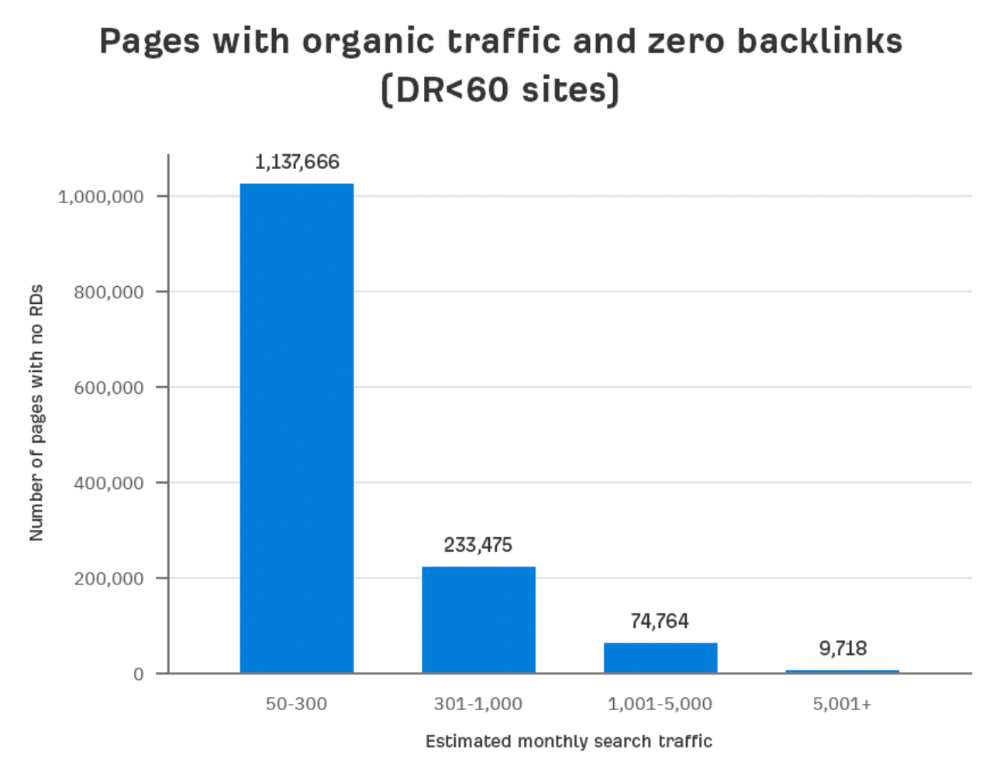
This suggests high-authority pages without backlinks are more likely to get organic traffic than low-authority pages.
Internal links likely pass PageRank to new pages.
Two other reasons:
Our crawler's blocked. Most shady SEOs block backlinks from us. This prevents competitors from seeing (and reporting) PBNs.
They choose low-competition subjects. Low-volume queries are less competitive, requiring fewer backlinks to rank.
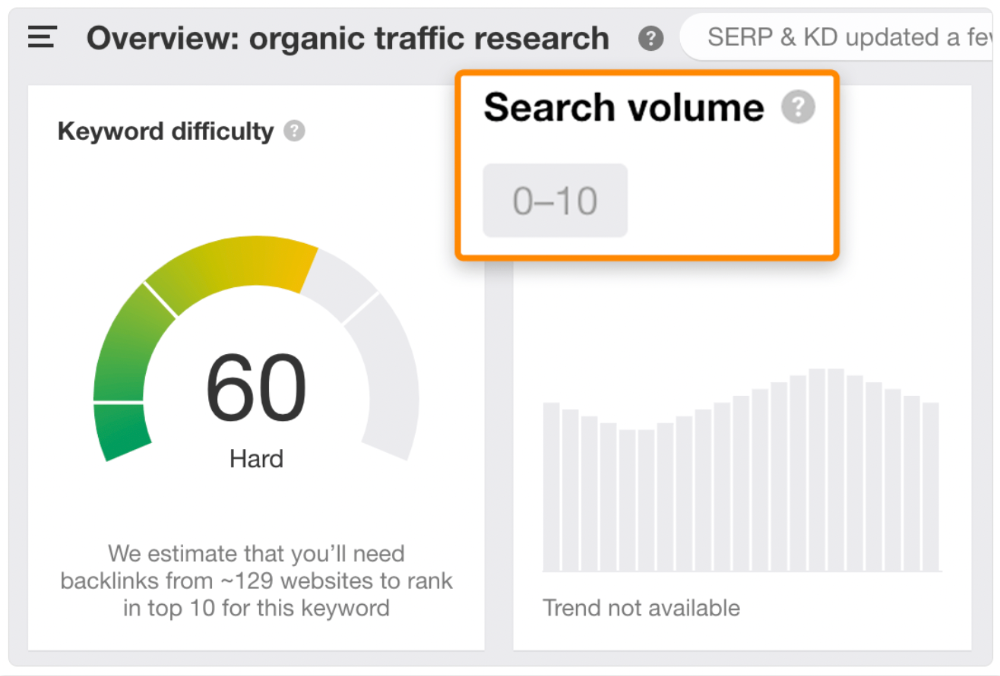
If the idea of getting search traffic without building backlinks excites you, learn about Keyword Difficulty and how to find keywords/topics with decent traffic potential and low competition.
Reason #2: The page has no long-term traffic potential.
Some pages with many backlinks get no Google traffic.
Why? I filtered Content Explorer for pages with no organic search traffic and divided them into four buckets by linking domains.
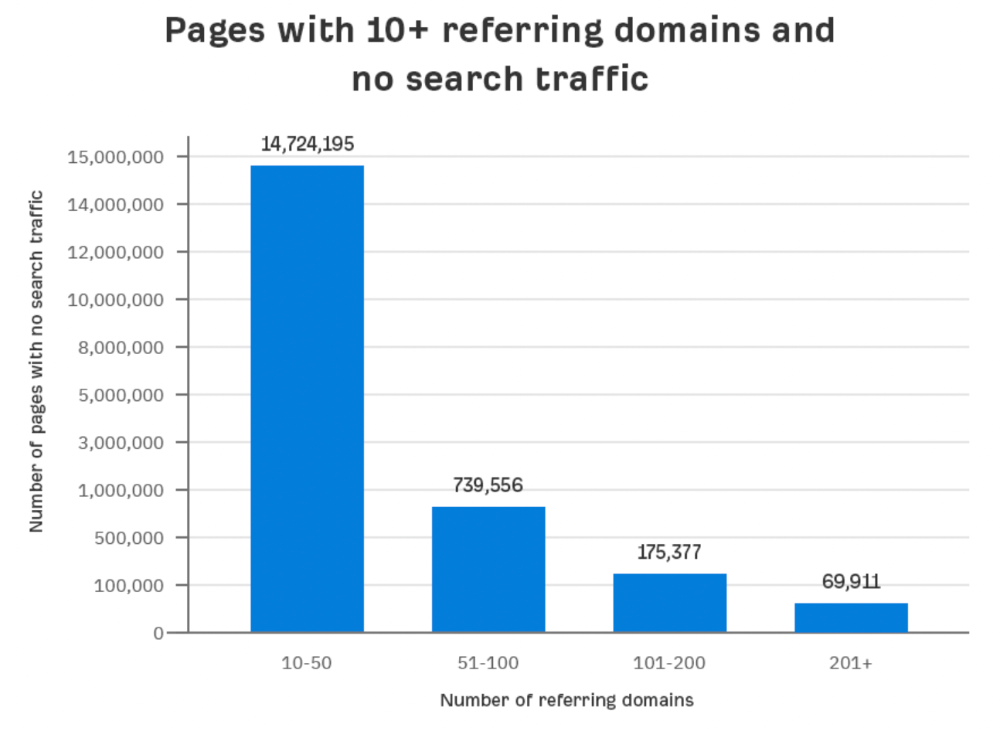
Almost 70k pages have backlinks from over 200 domains, but no search traffic.
By manually reviewing these (and other) pages, I noticed two general trends that explain why they get no traffic:
They overdid "shady link building" and got penalized by Google;
They're not targeting a Google-searched topic.
I won't elaborate on point one because I hope you don't engage in "shady link building"
#2 is self-explanatory:
If nobody searches for what you write, you won't get search traffic.
Consider one of our blog posts' metrics:
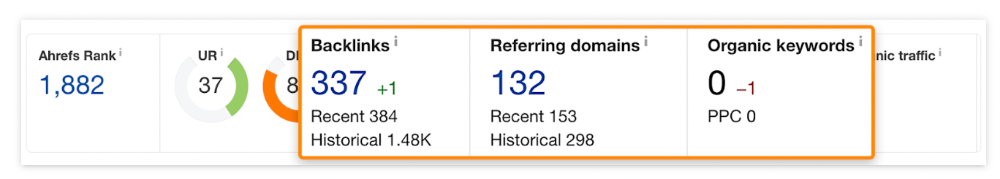
No organic traffic despite 337 backlinks from 132 sites.
The page is about "organic traffic research," which nobody searches for.
News articles often have this. They get many links from around the web but little Google traffic.
People can't search for things they don't know about, and most don't care about old events and don't search for them.
Note:
Some news articles rank in the "Top stories" block for relevant, high-volume search queries, generating short-term organic search traffic.
The Guardian's top "Donald Trump" story:
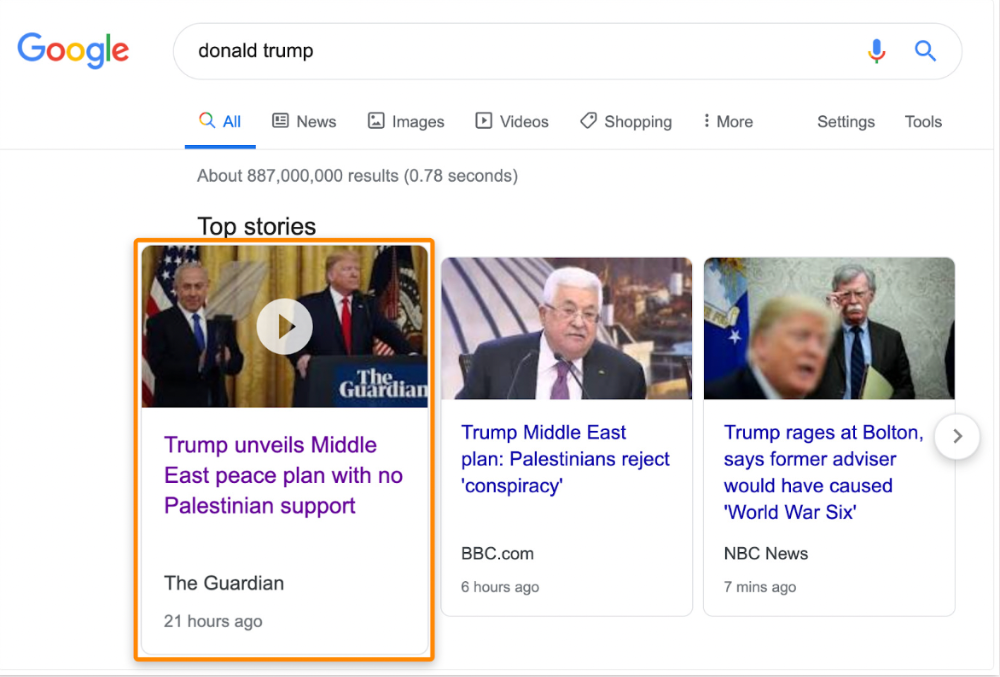
Ahrefs caught on quickly:
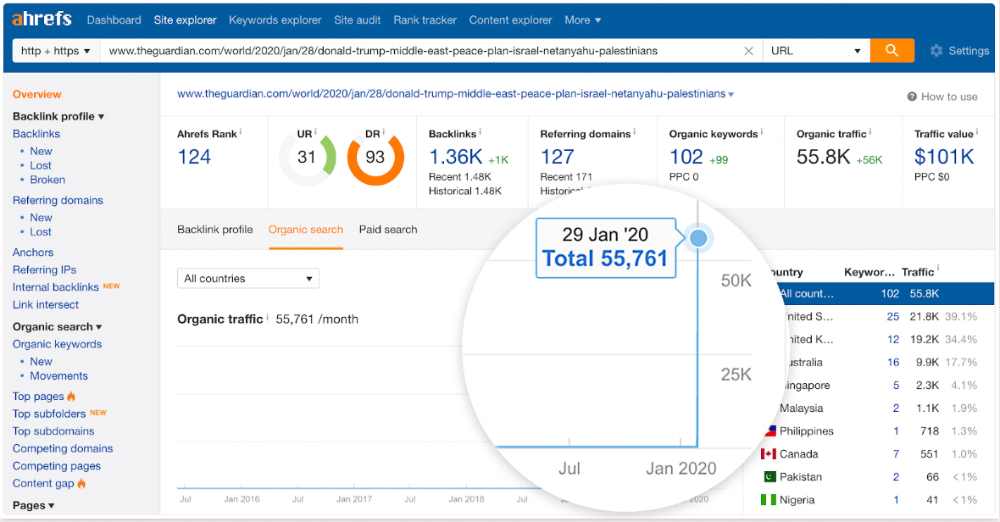
"Donald Trump" gets 5.6M monthly searches, so this page got a lot of "Top stories" traffic.
I bet traffic has dropped if you check now.
One of the quickest and most effective SEO wins is:
Find your website's pages with the most referring domains;
Do keyword research to re-optimize them for relevant topics with good search traffic potential.
Bryan Harris shared this "quick SEO win" during a course interview:
He suggested using Ahrefs' Site Explorer's "Best by links" report to find your site's most-linked pages and analyzing their search traffic. This finds pages with lots of links but little organic search traffic.
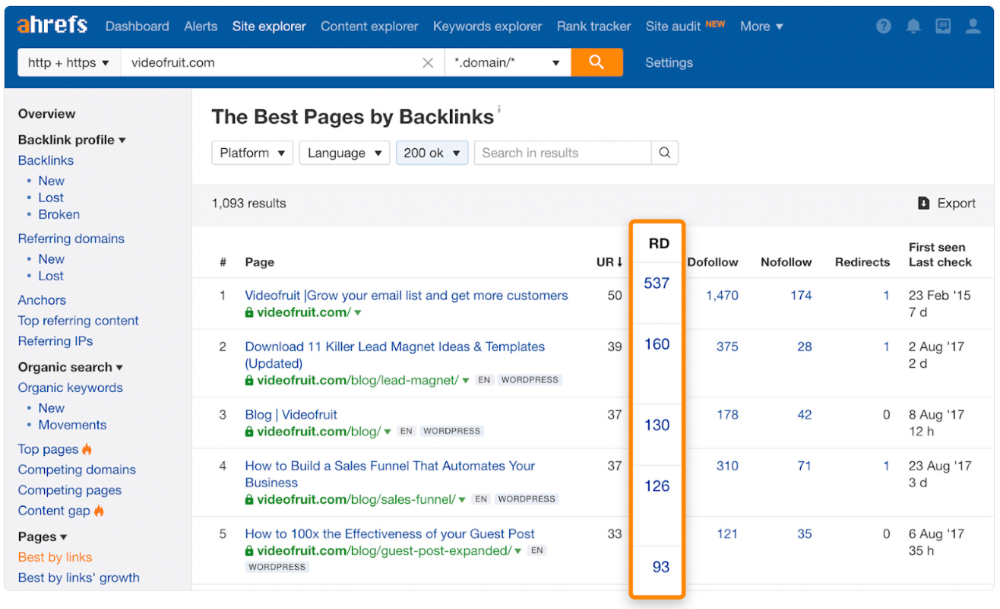
We see:
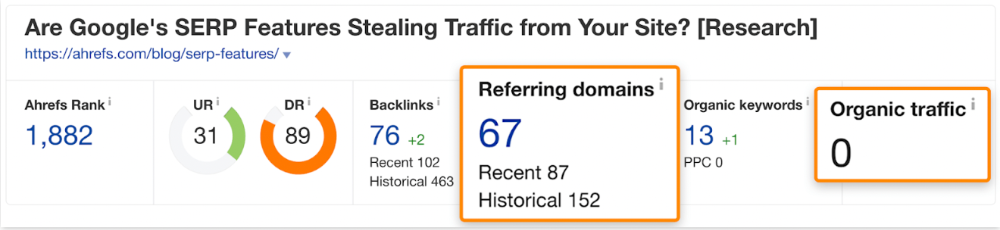
The guide has 67 backlinks but no organic traffic.
We could fix this by re-optimizing the page for "SERP"
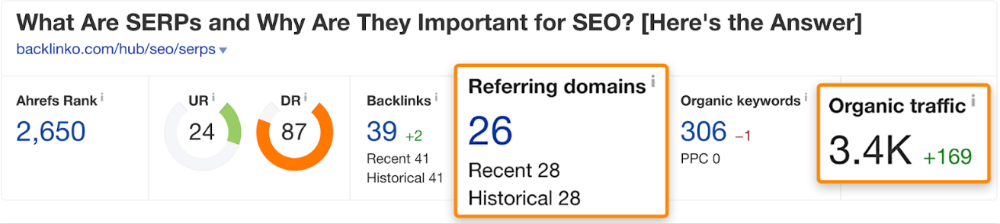
A similar guide with 26 backlinks gets 3,400 monthly organic visits, so we should easily increase our traffic.
Don't do this with all low-traffic pages with backlinks. Choose your battles wisely; some pages shouldn't be ranked.
Reason #3: Search intent isn't met
Google returns the most relevant search results.
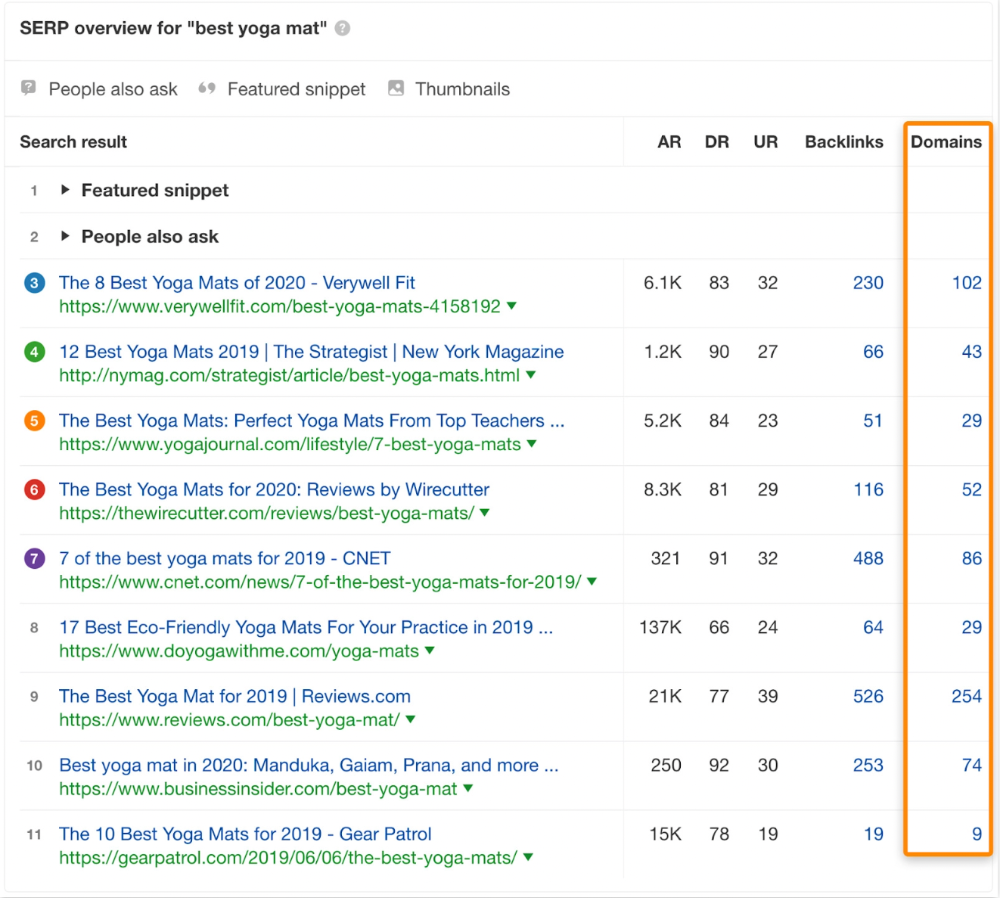
That's why blog posts with recommendations rank highest for "best yoga mat."
Google knows that most searchers aren't buying.
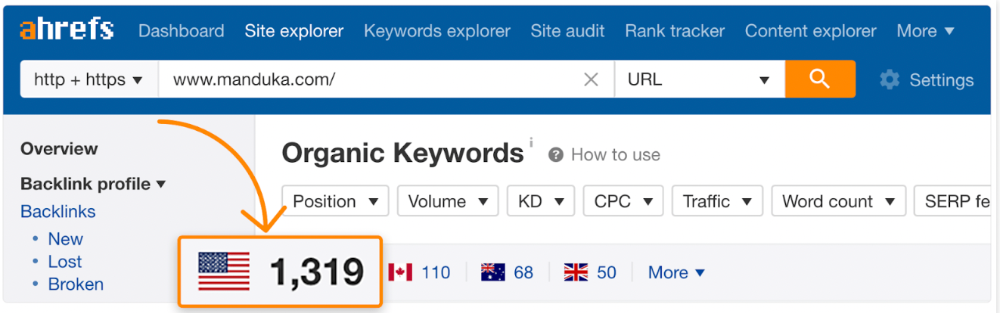
It's also why this yoga mats page doesn't rank, despite having seven times more backlinks than the top 10 pages:
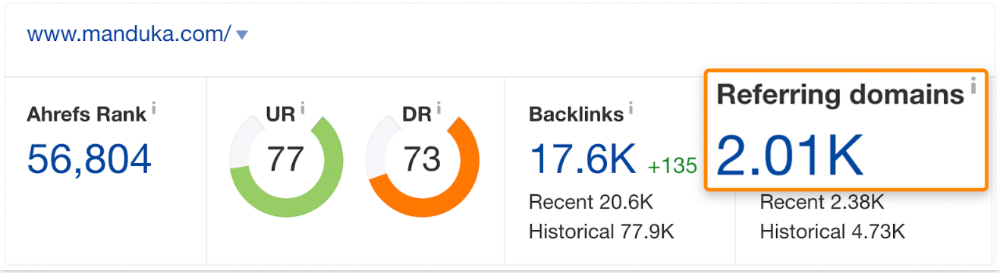
The page ranks for thousands of other keywords and gets tens of thousands of monthly organic visits. Not being the "best yoga mat" isn't a big deal.
If you have pages with lots of backlinks but no organic traffic, re-optimizing them for search intent can be a quick SEO win.
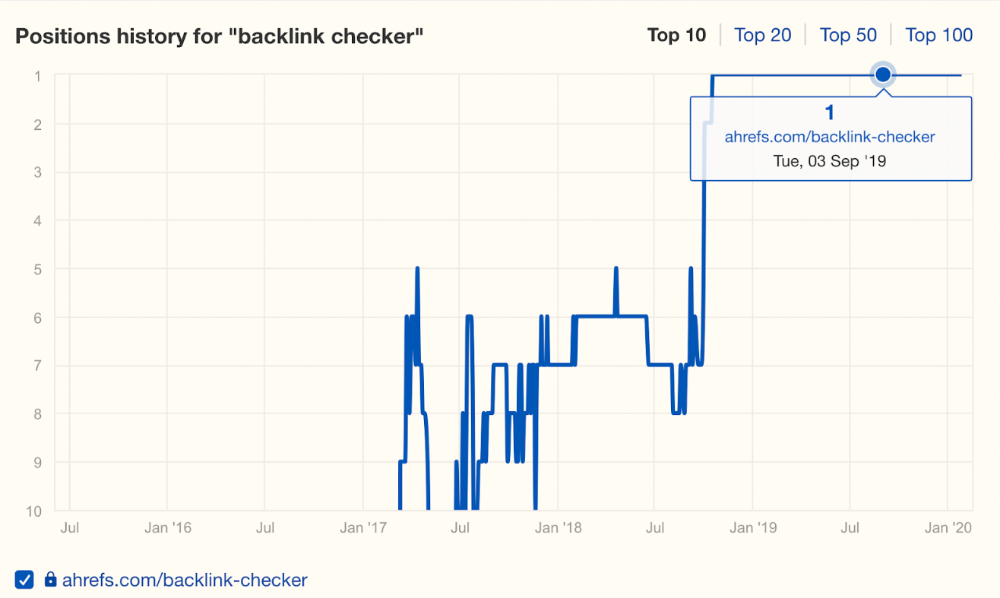
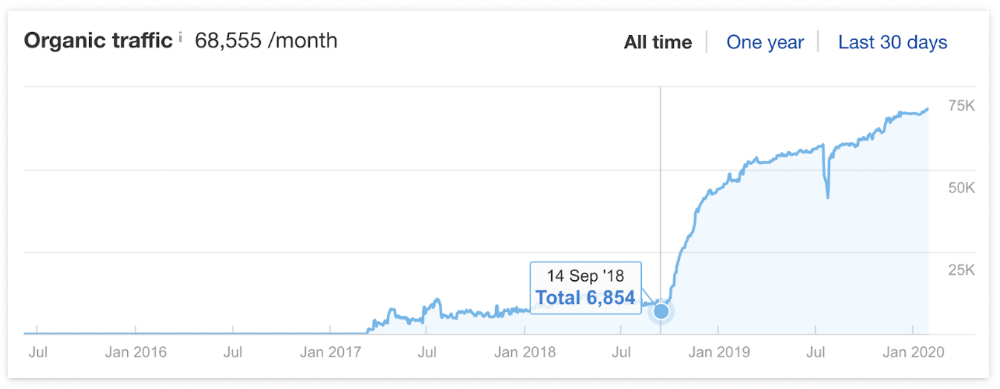
It was originally a boring landing page describing our product's benefits and offering a 7-day trial.
We realized the problem after analyzing search intent.
People wanted a free tool, not a landing page.
In September 2018, we published a free tool at the same URL. Organic traffic and rankings skyrocketed.
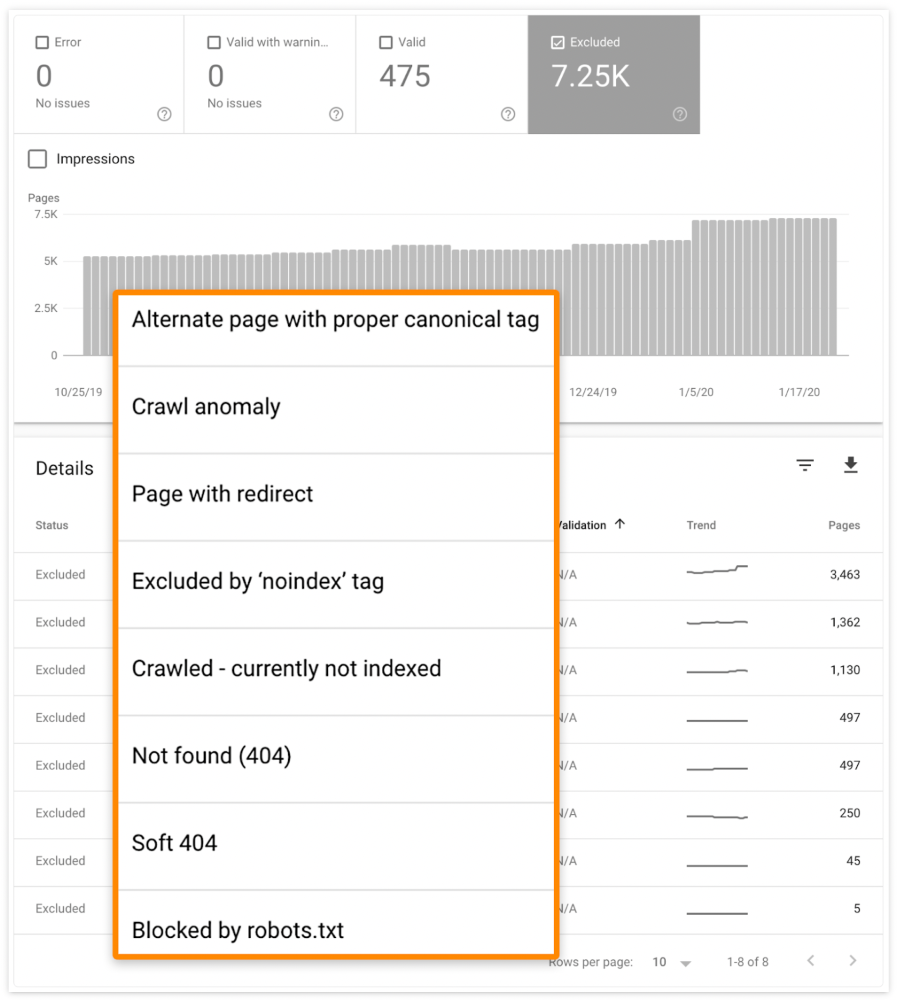
Reason #4: Unindexed page
Google can’t rank pages that aren’t indexed.
If you think this is the case, search Google for site:[url]. You should see at least one result; otherwise, it’s not indexed.
A rogue noindex meta tag is usually to blame. This tells search engines not to index a URL.
Rogue canonicals, redirects, and robots.txt blocks prevent indexing.
Check the "Excluded" tab in Google Search Console's "Coverage" report to see excluded pages.
Google doesn't index broken pages, even with backlinks.
Surprisingly common.
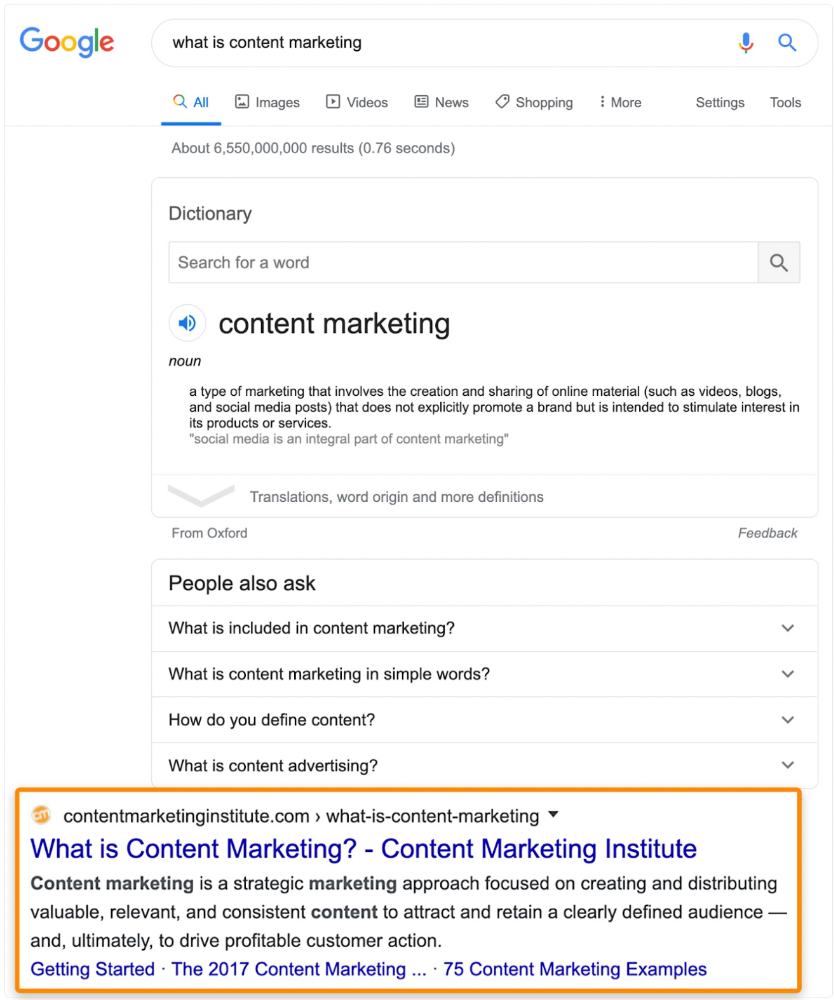
In Ahrefs' Site Explorer, the Best by Links report for a popular content marketing blog shows many broken pages.
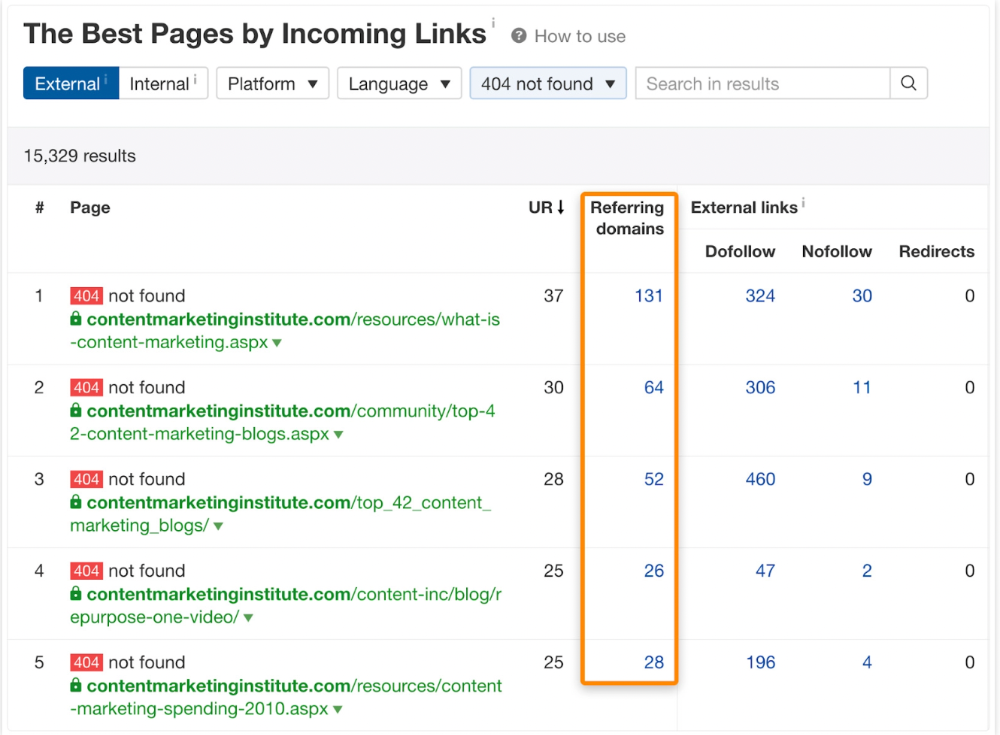
One dead page has 131 backlinks:
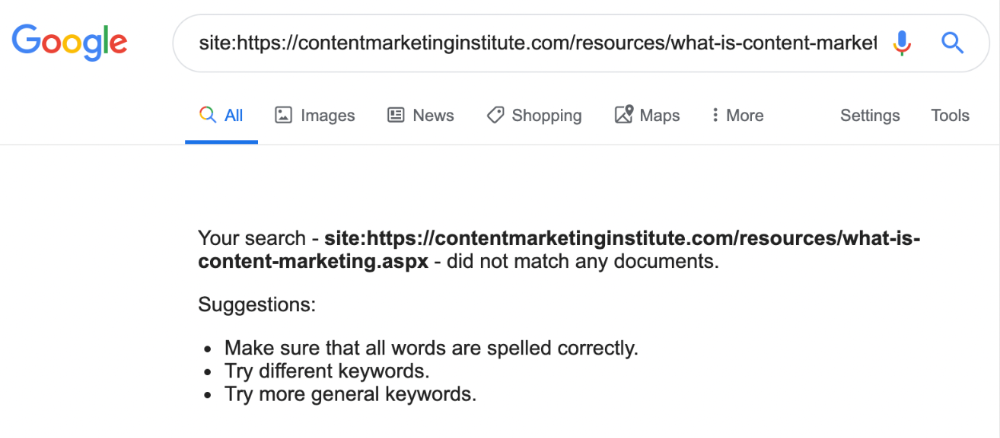
According to the URL, the page defined content marketing. —a keyword with a monthly search volume of 5,900 in the US.
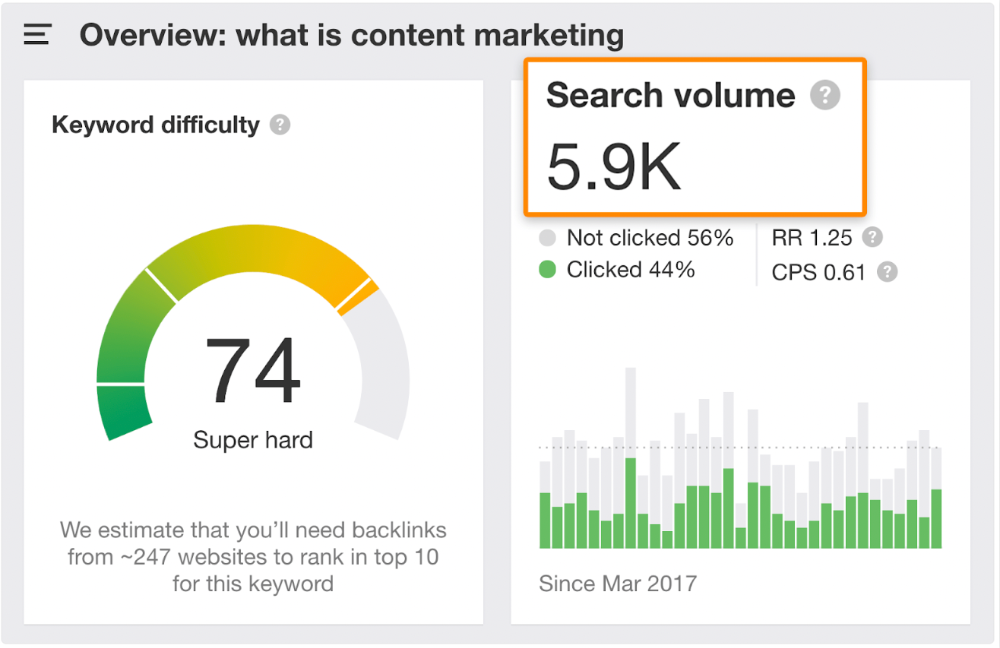
Luckily, another page ranks for this keyword. Not a huge loss.
At least redirect the dead page's backlinks to a working page on the same topic. This may increase long-tail keyword traffic.
This post is a summary. See the original post here

Liz Martin
3 years ago
A Search Engine From Apple?
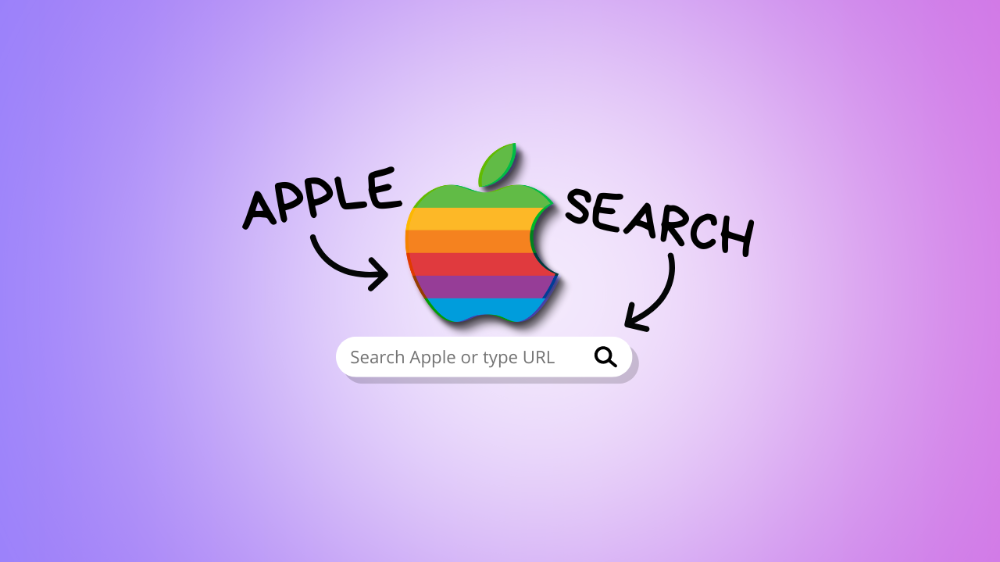
Apple's search engine has long been rumored. Recent Google developments may confirm the rumor. Is Apple about to become Google's biggest rival?
Here's a video:
People noted Apple's changes in 2020. AppleBot, a web crawler that downloads and caches Internet content, was more active than in the last five years.
Apple hired search engine developers, including ex-Googlers, such as John Giannandrea, Google's former search chief.
Apple also changed the way iPhones search. With iOS 14, Apple's search results arrived before Google's.
These facts fueled rumors that Apple was developing a search engine.
Apple and Google Have a Contract
Many skeptics said Apple couldn't compete with Google. This didn't affect the company's competitiveness.
Apple is the only business with the resources and scale to be a Google rival, with 1.8 billion active devices and a $2 trillion market cap.
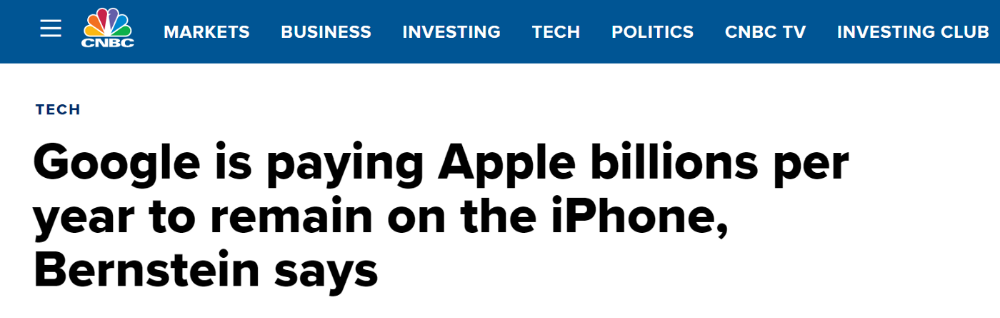
Still, people doubted that due to a license deal. Google pays Apple $8 to $12 billion annually to be the default iPhone and iPad search engine.
Apple can't build an independent search product under this arrangement.
Why would Apple enter search if it's being paid to stay out?
Ironically, this partnership has many people believing Apple is getting into search.
A New Default Search Engine May Be Needed
Google was sued for antitrust in 2020. It is accused of anticompetitive and exclusionary behavior. Justice wants to end Google's monopoly.
Authorities could restrict Apple and Google's licensing deal due to its likely effect on market competitiveness. Hence Apple needs a new default search engine.
Apple Already Has a Search Engine
The company already has a search engine, Spotlight.
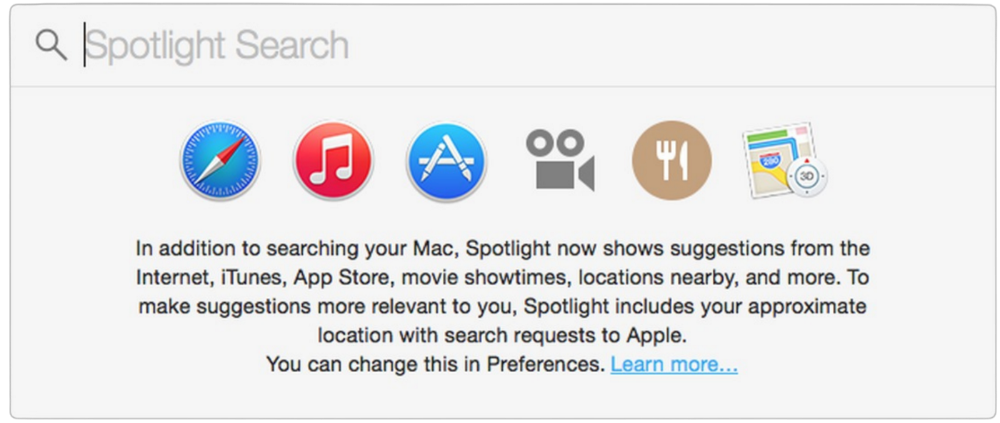
Since 2004, Spotlight has aired. It was developed to help users find photos, documents, apps, music, and system preferences.
Apple's search engine could do more than organize files, texts, and apps.
Spotlight Search was updated in 2014 with iOS 8. Web, App Store, and iTunes searches became available. You could find nearby places, movie showtimes, and news.
This search engine has subsequently been updated and improved. Spotlight added rich search results last year.
If you search for a TV show, movie, or song, photos and carousels will appear at the top of the page.
This resembles Google's rich search results.
When Will the Apple Search Engine Be Available?
When will Apple's search launch? Robert Scoble says it's near.
Scoble tweeted a number of hints before this year's Worldwide Developer Conference.
Scoble bases his prediction on insider information and deductive reasoning. January 2023 is expected.
Will you use Apple's search engine?

Nikhil Vemu
3 years ago
7 Mac Tips You Never Knew You Needed
Unleash the power of the Option key ⌥

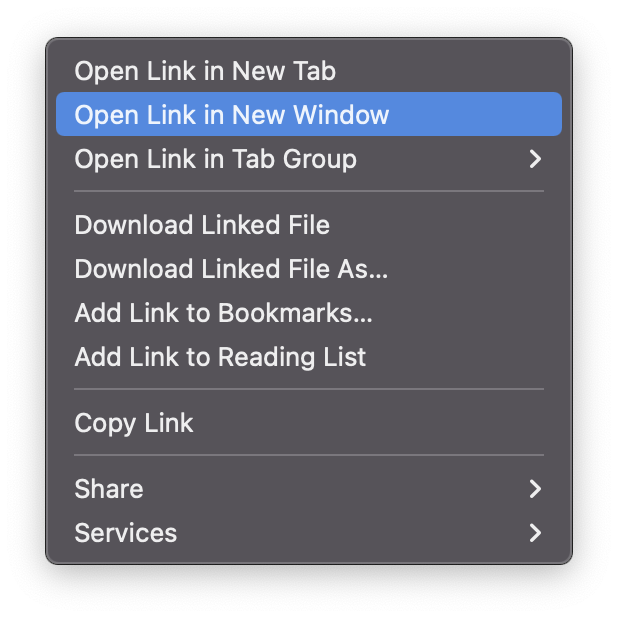
#1 Open a link in the Private tab first.
Previously, if I needed to open a Safari link in a private window, I would:
copied the URL with the right click command,
choose File > New Private Window to open a private window, and
clicked return after pasting the URL.
I've found a more straightforward way.
Right-clicking a link shows this, right?
Hold option (⌥) for:
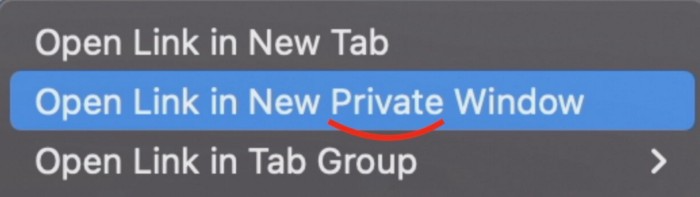
Click Open Link in New Private Window while holding.
Finished!
#2. Instead of searching for specific characters, try this
You may use unicode for business or school. Most people Google them when they need them.
That is lengthy!
You can type some special characters just by pressing ⌥ and a key.
For instance
• ⌥+2 -> ™ (Trademark)
• ⌥+0 -> ° (Degree)
• ⌥+G -> © (Copyright)
• ⌥+= -> ≠ (Not equal to)
• ⌥+< -> ≤ (Less than or equal to)
• ⌥+> -> ≥ (Greater then or equal to)
• ⌥+/ -> ÷ (Different symbol for division)
#3 Activate Do Not Disturb silently.
Do Not Disturb when sharing my screen is awkward for me (because people may think Im trying to hide some secret notifications).
Here's another method.
Hold ⌥ and click on Time (at the extreme right on the menu-bar).
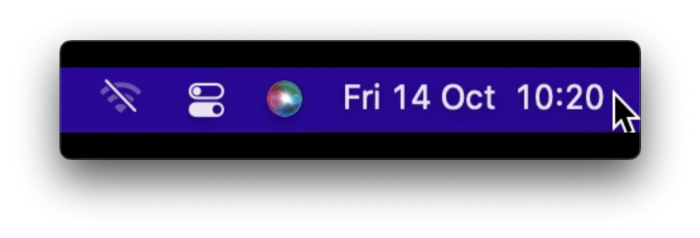
Now, DND is activated (secretly!). To turn it off, do it again.
Note: This works only for DND focus.#4. Resize a window starting from its center
Although this is rarely useful, it is still a hidden trick.
When you resize a window, the opposite edge or corner is used as the pivot, right?
However, if you want to resize it with its center as the pivot, hold while doing so.
#5. Yes, Cut-Paste is available on Macs as well (though it is slightly different).
I call it copy-move rather than cut-paste. This is how it works.
Carry it out.
Choose a file (by clicking on it), then copy it (⌘+C).
Go to a new location on your Mac. Do you use ⌘+V to paste it? However, to move it, press ⌘+⌥+V.
This removes the file from its original location and copies it here. And it works exactly like cut-and-paste on Windows.
#6. Instantly expand all folders
Set your Mac's folders to List view.
Assume you have one folder with multiple subfolders, each of which contains multiple files. And you wanted to look at every single file that was over there.
How would you do?
You're used to clicking the ⌄ glyph near the folder and each subfolder to expand them all, right? Instead, hold down ⌥ while clicking ⌄ on the parent folder.
This is what happens next.
Everything expands.
View/Copy a file's path as an added bonus
If you want to see the path of a file in Finder, select it and hold ⌥, and you'll see it at the bottom for a moment.
To copy its path, right-click on the folder and hold down ⌥ to see this

Click on Copy <"folder name"> as Pathname to do it.
#7 "Save As"
I was irritated by the lack of "Save As" in Pages when I first got a Mac (after 15 years of being a Windows guy).
It was necessary for me to save the file as a new file, in a different location, with a different name, or both.
Unfortunately, I couldn't do it on a Mac.
However, I recently discovered that it appears when you hold ⌥ when in the File menu.
Yay!
You might also like

Stephen Moore
3 years ago
Trading Volume on OpenSea Drops by 99% as the NFT Boom Comes to an End
Wasn't that a get-rich-quick scheme?

OpenSea processed $2.7 billion in NFT transactions in May 2021.
Fueled by a crypto bull run, rumors of unfathomable riches, and FOMO, Bored Apes, Crypto Punks, and other JPEG-format trash projects flew off the virtual shelves, snatched up by retail investors and celebrities alike.
Over a year later, those shelves are overflowing and warehouses are backlogged. Since March, I've been writing less. In May and June, the bubble was close to bursting.
Apparently, the boom has finally peaked.
This bubble has punctured, and deflation has begun. On Aug. 28, OpenSea processed $9.34 million.
From that euphoric high of $2.7 billion, $9.34 million represents a spectacular decline of 99%.
OpenSea contradicts the data. A trading platform spokeswoman stated the comparison is unfair because it compares the site's highest and lowest trading days. They're the perfect two data points to assess the drop. OpenSea chooses to use ETH volume measures, which ignore crypto's shifting price. Since January 2022, monthly ETH volume has dropped 140%, according to Dune.
Unconvincing counterargument.
Further OpenSea indicators point to declining NFT demand:
Since January 2022, daily user visits have decreased by 50%.
Daily transactions have decreased by 50% since the beginning of the year in the same manner.
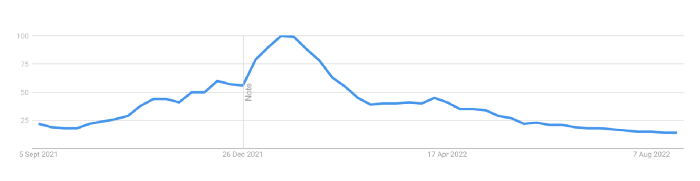
Off-platform, the floor price of Bored Apes has dropped from 145 ETH to 77 ETH. (At $4,800, a reduction from $700,000 to $370,000). Google search data shows waning popular interest.
It is a trend that will soon vanish, just like laser eyes.
NFTs haven't moved since the new year. Eminem and Snoop Dogg can utilize their apes in music videos or as 3D visuals to perform at the VMAs, but the reality is that NFTs have lost their public appeal and the market is trying to regain its footing.
They've lost popularity because?
Breaking records. The technology still lacks genuine use cases a year and a half after being popular.
They're pricey prestige symbols that have made a few people rich through cunning timing or less-than-savory scams or rug pulling. Over $10.5 billion has been taken through frauds, most of which are NFT enterprises promising to be the next Bored Apes, according to Web3 is going wonderfully. As the market falls, many ordinary investors realize they purchased into a self-fulfilling ecosystem that's halted. Many NFTs are sold between owner-held accounts to boost their price, data suggests. Most projects rely on social media excitement to debut with a high price before the first owners sell and chuckle to the bank. When they don't, the initiative fails, leaving investors high and dry.
NFTs are fading like laser eyes. Most people pushing the technology don't believe in it or the future it may bring. No, they just need a Kool-Aid-drunk buyer.
Everybody wins. When your JPEGs are worth 99% less than when you bought them, you've lost.
When demand reaches zero, many will lose.

Protos
3 years ago
Plagiarism on OpenSea: humans and computers
OpenSea, a non-fungible token (NFT) marketplace, is fighting plagiarism. A new “two-pronged” approach will aim to root out and remove copies of authentic NFTs and changes to its blue tick verified badge system will seek to enhance customer confidence.
According to a blog post, the anti-plagiarism system will use algorithmic detection of “copymints” with human reviewers to keep it in check.
Last year, NFT collectors were duped into buying flipped images of the popular BAYC collection, according to The Verge. The largest NFT marketplace had to remove its delay pay minting service due to an influx of copymints.
80% of NFTs removed by the platform were minted using its lazy minting service, which kept the digital asset off-chain until the first purchase.
NFTs copied from popular collections are opportunistic money-grabs. Right-click, save, and mint the jacked JPEGs that are then flogged as an authentic NFT.
The anti-plagiarism system will scour OpenSea's collections for flipped and rotated images, as well as other undescribed permutations. The lack of detail here may be a deterrent to scammers, or it may reflect the new system's current rudimentary nature.
Thus, human detectors will be needed to verify images flagged by the detection system and help train it to work independently.
“Our long-term goal with this system is two-fold: first, to eliminate all existing copymints on OpenSea, and second, to help prevent new copymints from appearing,” it said.
“We've already started delisting identified copymint collections, and we'll continue to do so over the coming weeks.”
It works for Twitter, why not OpenSea
OpenSea is also changing account verification. Early adopters will be invited to apply for verification if their NFT stack is worth $100 or more. OpenSea plans to give the blue checkmark to people who are active on Twitter and Discord.
This is just the beginning. We are committed to a future where authentic creators can be verified, keeping scammers out.
Also, collections with a lot of hype and sales will get a blue checkmark. For example, a new NFT collection sold by the verified BAYC account will have a blue badge to verify its legitimacy.
New requests will be responded to within seven days, according to OpenSea.
These programs and products help protect creators and collectors while ensuring our community can confidently navigate the world of NFTs.
By elevating authentic content and removing plagiarism, these changes improve trust in the NFT ecosystem, according to OpenSea.
OpenSea is indeed catching up with the digital art economy. Last August, DevianArt upgraded its AI image recognition system to find stolen tokenized art on marketplaces like OpenSea.
It scans all uploaded art and compares it to “public blockchain events” like Ethereum NFTs to detect stolen art.

Kaitlin Fritz
3 years ago
The Entrepreneurial Chicken and Egg
University entrepreneurship is like a Willy Wonka Factory of ideas. Classes, roommates, discussions, and the cafeteria all inspire new ideas. I've seen people establish a business without knowing its roots.
Chicken or egg? On my mind: I've asked university founders around the world whether the problem or solution came first.
The Problem
One African team I met started with the “instant noodles” problem in their academic ecosystem. Many of us have had money issues in college, which may have led to poor nutritional choices.
Many university students in a war-torn country ate quick noodles or pasta for dinner.

Noodles required heat, water, and preparation in the boarding house. Unreliable power from one hot plate per blue moon. What's healthier, easier, and tastier than sodium-filled instant pots?
BOOM. They were fixing that. East African kids need affordable, nutritious food.
This is a real difficulty the founders faced every day with hundreds of comrades.
This sparked their serendipitous entrepreneurial journey and became their business's cornerstone.
The Solution
I asked a UK team about their company idea. They said the solution fascinated them.
The crew was fiddling with social media algorithms. Why are some people more popular? They were studying platforms and social networks, which offered a way for them.

Solving a problem? Yes. Long nights of university research lead them to it. Is this like world hunger? Social media influencers confront this difficulty regularly.
It made me ponder something. Is there a correct response?
In my heart, yes, but in my head…maybe?
I believe you should lead with empathy and embrace the problem, not the solution. Big or small, businesses should solve problems. This should be your focus. This is especially true when building a social company with an audience in mind.
Philosophically, invention and innovation are occasionally accidental. Also not penalized. Think about bugs and the creation of Velcro, or the inception of Teflon. They tackle difficulties we overlook. The route to the problem may look different, but there is a path there.
There's no golden ticket to the Chicken-Egg debate, but I'll keep looking this summer.