


More on Entrepreneurship/Creators

Thomas Tcheudjio
3 years ago
If you don't crush these 3 metrics, skip the Series A.
I recently wrote about getting VCs excited about Marketplace start-ups. SaaS founders became envious!
Understanding how people wire tens of millions is the only Series A hack I recommend.
Few people understand the intellectual process behind investing.
VC is risk management.
Series A-focused VCs must cover two risks.
1. Market risk
You need a large market to cross a threshold beyond which you can build defensibilities. Series A VCs underwrite market risk.
They must see you have reached product-market fit (PMF) in a large total addressable market (TAM).
2. Execution risk
When evaluating your growth engine's blitzscaling ability, execution risk arises.
When investors remove operational uncertainty, they profit.
Series A VCs like businesses with derisked revenue streams. Don't raise unless you have a predictable model, pipeline, and growth.
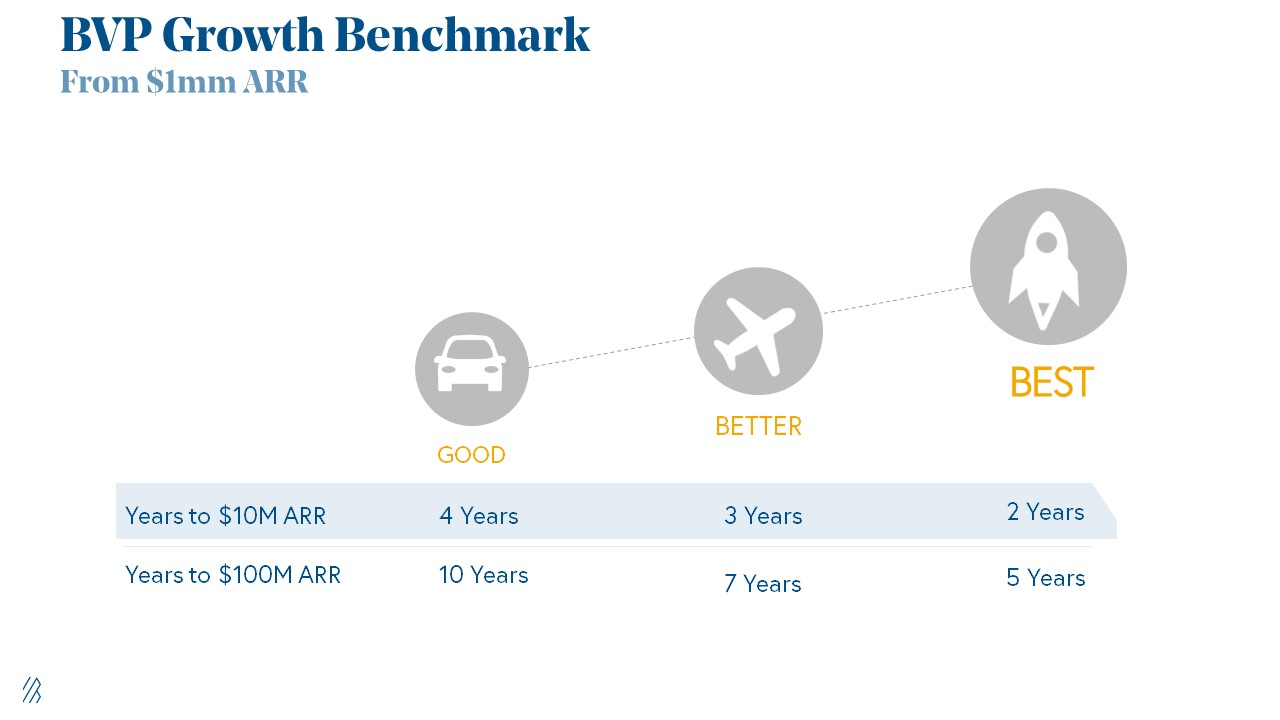
Please beat these 3 metrics before Series A:
Achieve $1.5m ARR in 12-24 months (Market risk)
Above 100% Net Dollar Retention. (Market danger)
Lead Velocity Rate supporting $10m ARR in 2–4 years (Execution risk)
Hit the 3 and you'll raise $10M in 4 months. Discussing 2/3 may take 6–7 months.
If none, don't bother raising and focus on becoming a capital-efficient business (Topics for other posts).
Let's examine these 3 metrics for the brave ones.
1. Lead Velocity Rate supporting €$10m ARR in 2 to 4 years
Last because it's the least discussed. LVR is the most reliable data when evaluating a growth engine, in my opinion.
SaaS allows you to see the future.
Monthly Sales and Sales Pipelines, two predictive KPIs, have poor data quality. Both are lagging indicators, and minor changes can cause huge modeling differences.
Analysts and Associates will trash your forecasts if they're based only on Monthly Sales and Sales Pipeline.
LVR, defined as month-over-month growth in qualified leads, is rock-solid. There's no lag. You can See The Future if you use Qualified Leads and a consistent formula and process to qualify them.
With this metric in your hand, scaling your company turns into an execution play on which VCs are able to perform calculations risk.
2. Above-100% Net Dollar Retention.
Net Dollar Retention is a better-known SaaS health metric than LVR.
Net Dollar Retention measures a SaaS company's ability to retain and upsell customers. Ask what $1 of net new customer spend will be worth in years n+1, n+2, etc.
Depending on the business model, SaaS businesses can increase their share of customers' wallets by increasing users, selling them more products in SaaS-enabled marketplaces, other add-ons, and renewing them at higher price tiers.
If a SaaS company's annualized Net Dollar Retention is less than 75%, there's a problem with the business.
Slack's ARR chart (below) shows how powerful Net Retention is. Layer chart shows how existing customer revenue grows. Slack's S1 shows 171% Net Dollar Retention for 2017–2019.

Slack S-1
3. $1.5m ARR in the last 12-24 months.
According to Point 9, $0.5m-4m in ARR is needed to raise a $5–12m Series A round.
Target at least what you raised in Pre-Seed/Seed. If you've raised $1.5m since launch, don't raise before $1.5m ARR.
Capital efficiency has returned since Covid19. After raising $2m since inception, it's harder to raise $1m in ARR.

P9's 2016-2021 SaaS Funding Napkin
In summary, less than 1% of companies VCs meet get funded. These metrics can help you win.
If there’s demand for it, I’ll do one on direct-to-consumer.
Cheers!

Sarah Bird
3 years ago
Memes Help This YouTube Channel Earn Over $12k Per Month
Take a look at a YouTube channel making anything up to over $12k a month from making very simple videos.
And the best part? Its replicable by anyone. Basic videos can be generated for free without design abilities.
Join me as I deconstruct the channel to estimate how much they make, how they do it, and how you can too.
What Do They Do Exactly?
Happy Land posts memes with a simple caption they wrote. So, it's new. The videos are a slideshow of meme photos with stock music.
The site posts 12 times a day.
8-10-minute videos show 10 second images. Thus, each video needs 48-60 memes.
Memes are video titles (e.g. times a boyfriend was hilarious, back to school fails, funny restaurant signs).
Some stats about the channel:
Founded on October 30, 2020
873 videos were added.
81.8k subscribers
67,244,196 views of the video
What Value Are They Adding?
Everyone can find free memes online. This channel collects similar memes into a single video so you don't have to scroll or click for more. It’s right there, you just keep watching and more will come.
By theming it, the audience is prepared for the video's content.
If you want hilarious animal memes or restaurant signs, choose the video and you'll get up to 60 memes without having to look for them. Genius!
How much money do they make?
According to www.socialblade.com, the channel earns $800-12.8k (image shown in my home currency of GBP).
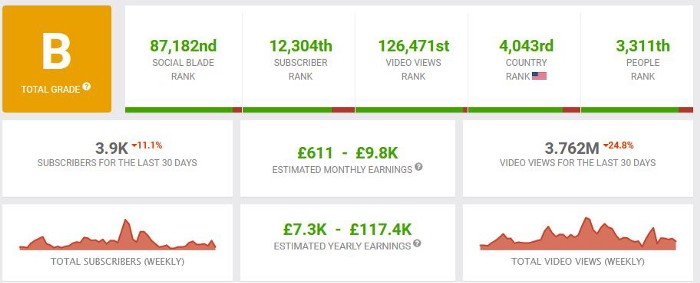
That's a crazy estimate, but it highlights the unbelievable potential of a channel that presents memes.
This channel thrives on quantity, thus putting out videos is necessary to keep the flow continuing and capture its audience's attention.
How Are the Videos Made?
Straightforward. Memes are added to a presentation without editing (so you could make this in PowerPoint or Keynote).
Each slide should include a unique image and caption. Set 10 seconds per slide.
Add music and post the video.
Finding enough memes for the material and theming is difficult, but if you enjoy memes, this is a fun job.
This case study should have shown you that you don't need expensive software or design expertise to make entertaining videos. Why not try fresh, easy-to-do ideas and see where they lead?

Aaron Dinin, PhD
3 years ago
The Advantages and Disadvantages of Having Investors Sign Your NDA
Startup entrepreneurs assume what risks when pitching?
Last week I signed four NDAs.
Four!
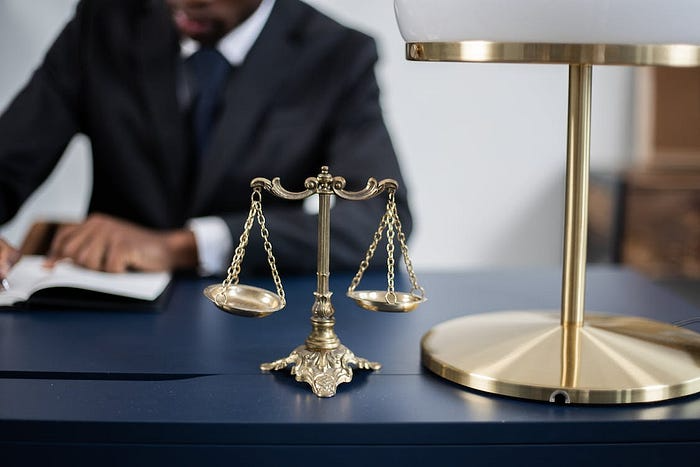
NDA stands for non-disclosure agreement. A legal document given to someone receiving confidential information. By signing, the person pledges not to share the information for a certain time. If they do, they may be in breach of contract and face legal action.
Companies use NDAs to protect trade secrets and confidential internal information from employees and contractors. Appropriate. If you manage a huge, successful firm, you don't want your employees selling their information to your competitors. To be true, business NDAs don't always prevent corporate espionage, but they usually make employees and contractors think twice before sharing.
I understand employee and contractor NDAs, but I wasn't asked to sign one. I counsel entrepreneurs, thus the NDAs I signed last week were from startups that wanted my feedback on their concepts.
I’m not a startup investor. I give startup guidance online. Despite that, four entrepreneurs thought their company ideas were so important they wanted me to sign a generically written legal form they probably acquired from a shady, spam-filled legal templates website before we could chat.
False. One company tried to get me to sign their NDA a few days after our conversation. I gently rejected, but their tenacity encouraged me. I considered sending retroactive NDAs to everyone I've ever talked to about one of my startups in case they establish a successful company based on something I said.
Two of the other three NDAs were from nearly identical companies. Good thing I didn't sign an NDA for the first one, else they may have sued me for talking to the second one as though I control the firms people pitch me.
I wasn't talking to the fourth NDA company. Instead, I received an unsolicited email from someone who wanted comments on their fundraising pitch deck but required me to sign an NDA before sending it.
That's right, before I could read a random Internet stranger's unsolicited pitch deck, I had to sign his NDA, potentially limiting my ability to discuss what was in it.
You should understand. Advisors, mentors, investors, etc. talk to hundreds of businesses each year. They cannot manage all the companies they deal with, thus they cannot risk legal trouble by talking to someone. Well, if I signed NDAs for all the startups I spoke with, half of the 300+ articles I've written on Medium over the past several years could get me sued into the next century because I've undoubtedly addressed topics in my articles that I discussed with them.
The four NDAs I received last week are part of a recent trend of entrepreneurs sending out NDAs before meetings, despite the practical and legal issues. They act like asking someone to sign away their right to talk about all they see and hear in a day is as straightforward as asking for a glass of water.
Given this inflow of NDAs, I wanted to briefly remind entrepreneurs reading this blog about the merits and cons of requesting investors (or others in the startup ecosystem) to sign your NDA.
Benefits of having investors sign your NDA include:
None. Zero. Nothing.
Disadvantages of requesting investor NDAs:
You'll come off as an amateur who has no idea what it takes to launch a successful firm.
Investors won't trust you with their money since you appear to be a complete amateur.
Printing NDAs will be a waste of paper because no genuine entrepreneur will ever sign one.
I apologize for missing any cons. Please leave your remarks.
You might also like

Joseph Mavericks
3 years ago
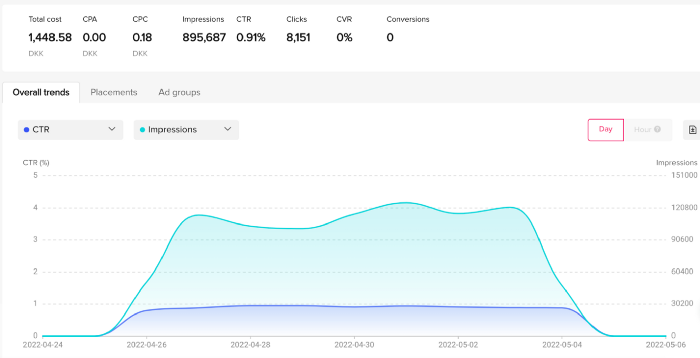
You Don't Have to Spend $250 on TikTok Ads Because I Did
900K impressions, 8K clicks, and $$$ orders…
I recently started dropshipping. Now that I own my business and can charge it as a business expense, it feels less like money wasted if it doesn't work. I also made t-shirts to sell. I intended to open a t-shirt store and had many designs on a hard drive. I read that Tiktok advertising had a high conversion rate and low cost because they were new. According to many, the advertising' cost/efficiency ratio would plummet and become as bad as Google or Facebook Ads. Now felt like the moment to try Tiktok marketing and dropshipping. I work in marketing for a SaaS firm and have seen how poorly ads perform. I wanted to try it alone.
I set up $250 and ran advertising for a week. Before that, I made my own products, store, and marketing. In this post, I'll show you my process and results.
Setting up the store
Dropshipping is a sort of retail business in which the manufacturer ships the product directly to the client through an online platform maintained by a seller. The seller takes orders but has no stock. The manufacturer handles all orders. This no-stock concept increases profitability and flexibility.
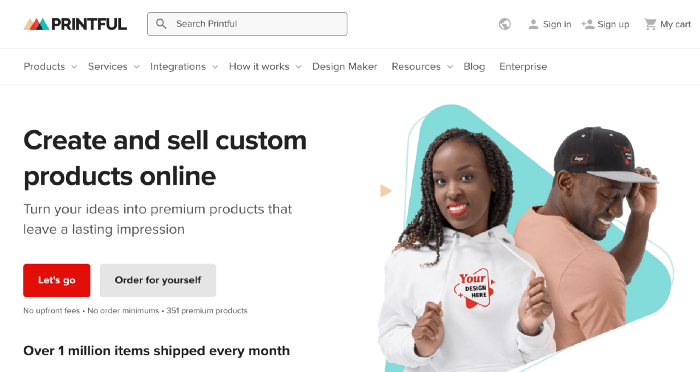
In my situation, I used previous t-shirt designs to make my own product. I didn't want to handle order fulfillment logistics, so I looked for a way to print my designs on demand, ship them, and handle order tracking/returns automatically. So I found Printful.
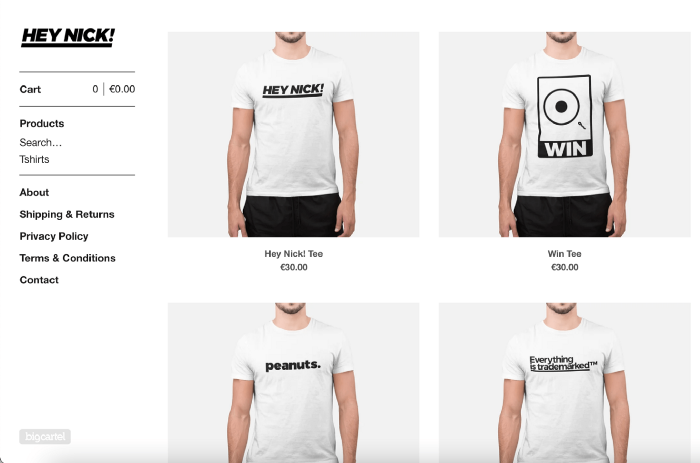
I needed to connect my backend and supplier to a storefront so visitors could buy. 99% of dropshippers use Shopify, but I didn't want to master the difficult application. I wanted a one-day project. I'd previously worked with Big Cartel, so I chose them.
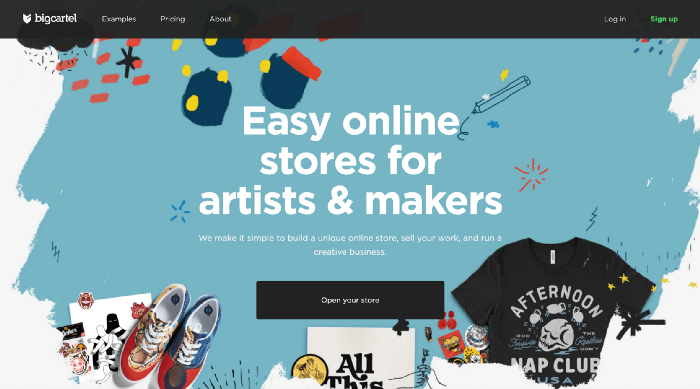
Big Cartel doesn't collect commissions on sales, simply a monthly flat price ($9.99 to $19.99 depending on your plan).
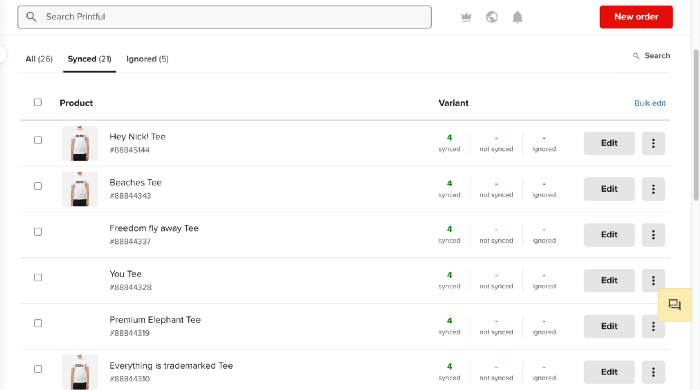
After opening a Big Cartel account, I uploaded 21 designs and product shots, then synced each product with Printful.
Developing the ads
I mocked up my designs on cool people photographs from placeit.net, a great tool for creating product visuals when you don't have a studio, camera gear, or models to wear your t-shirts.
I opened an account on the website and had advertising visuals within 2 hours.
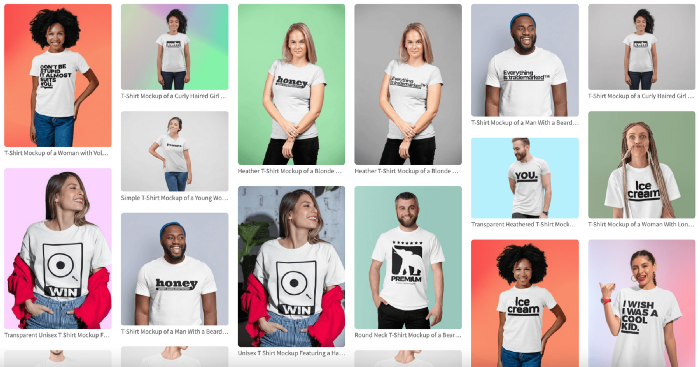
Because my designs are simple (black design on white t-shirt), I chose happy, stylish people on plain-colored backdrops. After that, I had to develop an animated slideshow.
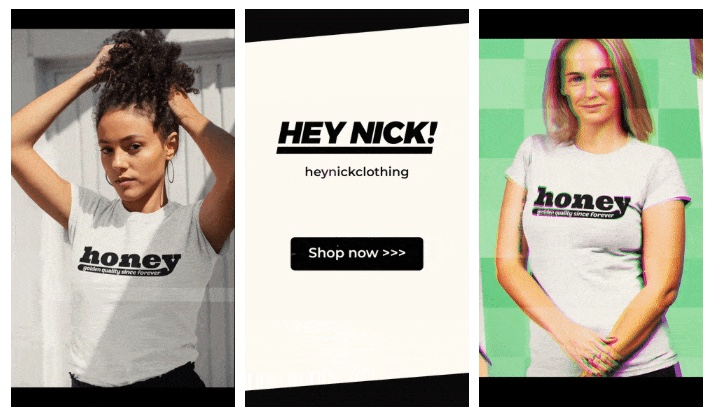
Because I'm a graphic designer, I chose to use Adobe Premiere to create animated Tiktok advertising.
Premiere is a fancy video editing application used for more than advertisements. Premiere is used to edit movies, not social media marketing. I wanted this experiment to be quick, so I got 3 social media ad templates from motionarray.com and threw my visuals in. All the transitions and animations were pre-made in the files, so it only took a few hours to compile. The result:
I downloaded 3 different soundtracks for the videos to determine which would convert best.
After that, I opened a Tiktok business account, uploaded my films, and inserted ad info. They went live within one hour.
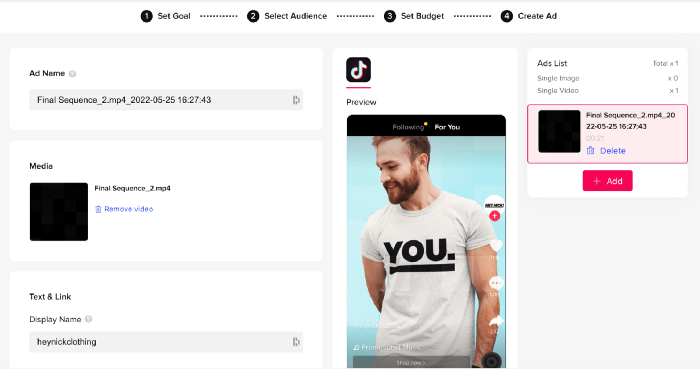
The (poor) outcomes
As a European company, I couldn't deliver ads in the US. All of my advertisements' material (title, description, and call to action) was in English, hence they continued getting rejected in Europe for countries that didn't speak English. There are a lot of them:
I lost a lot of quality traffic, but I felt that if the images were engaging, people would check out the store and buy my t-shirts. I was wrong.
51,071 impressions on Day 1. 0 orders after 411 clicks
114,053 impressions on Day 2. 1.004 clicks and no orders
Day 3: 987 clicks, 103,685 impressions, and 0 orders
101,437 impressions on Day 4. 0 orders after 963 clicks
115,053 impressions on Day 5. 1,050 clicks and no purchases
125,799 impressions on day 6. 1,184 clicks, no purchases
115,547 impressions on Day 7. 1,050 clicks and no purchases
121,456 impressions on day 8. 1,083 clicks, no purchases
47,586 impressions on Day 9. 419 Clicks. No orders
My overall conversion rate for video advertisements was 0.9%. TikTok's paid ad formats all result in strong engagement rates (ads average 3% to 12% CTR to site), therefore a 1 to 2% CTR should have been doable.
My one-week experiment yielded 8,151 ad clicks but no sales. Even if 0.1% of those clicks converted, I should have made 8 sales. Even companies with horrible web marketing would get one download or trial sign-up for every 8,151 clicks. I knew that because my advertising were in English, I had no impressions in the main EU markets (France, Spain, Italy, Germany), and that this impacted my conversion potential. I still couldn't believe my numbers.
I dug into the statistics and found that Tiktok's stats didn't match my store traffic data.
Looking more closely at the numbers
My ads were approved on April 26 but didn't appear until April 27. My store dashboard showed 440 visitors but 1,004 clicks on Tiktok. This happens often while tracking campaign results since different platforms handle comparable user activities (click, view) differently. In online marketing, residual data won't always match across tools.
My data gap was too large. Even if half of the 1,004 persons who clicked closed their browser or left before the store site loaded, I would have gained 502 visitors. The significant difference between Tiktok clicks and Big Cartel store visits made me suspicious. It happened all week:
Day 1: 440 store visits and 1004 ad clicks
Day 2: 482 store visits, 987 ad clicks
3rd day: 963 hits on ads, 452 store visits
443 store visits and 1,050 ad clicks on day 4.
Day 5: 459 store visits and 1,184 ad clicks
Day 6: 430 store visits and 1,050 ad clicks
Day 7: 409 store visits and 1,031 ad clicks
Day 8: 166 store visits and 418 ad clicks
The disparity wasn't related to residual data or data processing. The disparity between visits and clicks looked regular, but I couldn't explain it.
After the campaign concluded, I discovered all my creative assets (the videos) had a 0% CTR and a $0 expenditure in a separate dashboard. Whether it's a dashboard reporting issue or a budget allocation bug, online marketers shouldn't see this.
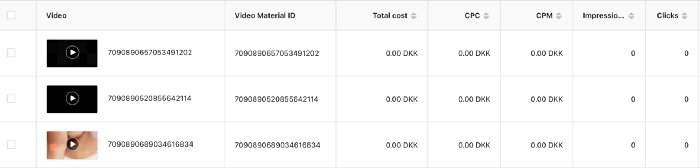
Tiktok can present any stats they want on their dashboard, just like any other platform that runs advertisements to promote content to its users. I can't verify that 895,687 individuals saw and clicked on my ad. I invested $200 for what appears to be around 900K impressions, which is an excellent ROI. No one bought a t-shirt, even an unattractive one, out of 900K people?
Would I do it again?
Nope. Whether I didn't make sales because Tiktok inflated the dashboard numbers or because I'm horrible at producing advertising and items that sell, I’ll stick to writing content and making videos. If setting up a business and ads in a few days was all it took to make money online, everyone would do it.
Video advertisements and dropshipping aren't dead. As long as the internet exists, people will click ads and buy stuff. Converting ads and selling stuff takes a lot of work, and I want to focus on other things.
I had always wanted to try dropshipping and I’m happy I did, I just won’t stick to it because that’s not something I’m interested in getting better at.
If I want to sell t-shirts again, I'll avoid Tiktok advertisements and find another route.

CyberPunkMetalHead
3 years ago
195 countries want Terra Luna founder Do Kwon
Interpol has issued a red alert on Terraform Labs' CEO, South Korean prosecutors said.

After the May crash of Terra Luna revealed tax evasion issues, South Korean officials filed an arrest warrant for Do Kwon, but he is missing.
Do Kwon is now a fugitive in 195 countries after Seoul prosecutors placed him to Interpol's red list. Do Kwon hasn't commented since then. The red list allows any country's local authorities to apprehend Do Kwon.
Do Dwon and Terraform Labs were believed to have moved to Singapore days before the $40 billion wipeout, but Singapore authorities said he fled the country on September 17. Do Kwon tweeted that he wasn't on the run and cited privacy concerns.
Do Kwon was not on the red list at the time and said he wasn't "running," only to reply to his own tweet saying he hasn't jogged in a while and needed to trim calories.
Whether or not it makes sense to read too much into this, the reality is that Do Kwon is now on Interpol red list, despite the firmly asserts on twitter that he does absolutely nothing to hide.
UPDATE:
South Korean authorities are investigating alleged withdrawals of over $60 million U.S. and seeking to freeze these assets. Korean authorities believe a new wallet exchanged over 3000 BTC through OKX and Kucoin.
Do Kwon and the Luna Foundation Guard (of whom Do Kwon is a key member of) have declined all charges and dubbed this disinformation.
Singapore's Luna Foundation Guard (LFG) manages the Terra Ecosystem.
The Legal Situation
Multiple governments are searching for Do Kwon and five other Terraform Labs employees for financial markets legislation crimes.
South Korean authorities arrested a man suspected of tax fraud and Ponzi scheme.
The U.S. SEC is also examining Terraform Labs on how UST was advertised as a stablecoin. No legal precedent exists, so it's unclear what's illegal.
The future of Terraform Labs, Terra, and Terra 2 is unknown, and despite what Twitter shills say about LUNC, the company remains in limbo awaiting a decision that will determine its fate. This project isn't a wise investment.
Blake Montgomery
3 years ago
Explaining Twitter Files
Elon Musk, Matt Taibbi, the 'Twitter Files,' and Hunter Biden's laptop: what gives?
Explaining Twitter Files
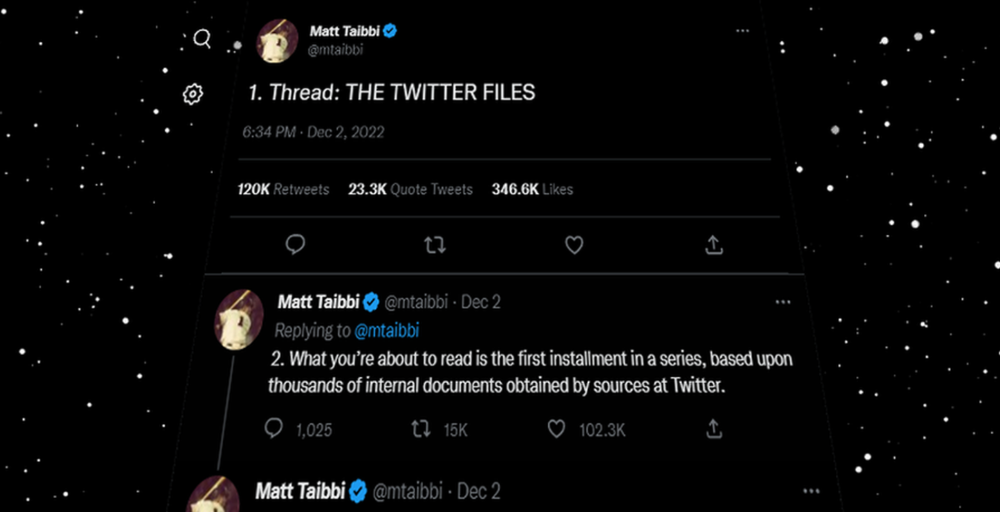
Matt Taibbi released "The Twitter Files," a batch of emails sent by Twitter executives discussing the company's decision to stop an October 2020 New York Post story online.
What's on Twitter? New York Post and Fox News call them "bombshell" documents. Or, as a Post columnist admitted, are they "not the smoking gun"? Onward!
What started this?
The New York Post published an exclusive, potentially explosive story in October 2020: Biden's Secret Emails: Ukrainian executive thanks Hunter Biden for'meeting' veep dad. The story purported to report the contents of a laptop brought to the tabloid by a Delaware computer repair shop owner who said it belonged to President Biden's second son, Hunter Biden. Emails and files on the laptop allegedly showed how Hunter peddled influence with Ukranian businessmen and included a "raunchy 12-minute video" of Hunter smoking crack and having sex.
Twitter banned links to the Post story after it was published, calling it "hacked material." The Post's Twitter account was suspended for multiple days.
Why? Yoel Roth, Twitter's former head of trust and safety, said the company couldn't verify the story, implying they didn't trust the Post.
Twitter's stated purpose rarely includes verifying news stories. This seemed like intentional political interference. This story was hard to verify because the people who claimed to have found the laptop wouldn't give it to other newspapers. (Much of the story, including Hunter's business dealings in Ukraine and China, was later confirmed.)
Roth: "It looked like a hack and leak."
So what are the “Twitter Files?”
Twitter's decision to bury the story became a political scandal, and new CEO Elon Musk promised an explanation. The Twitter Files, named after Facebook leaks.
Musk promised exclusive details of "what really happened" with Hunter Biden late Friday afternoon. The tweet was punctuated with a popcorn emoji.
Explaining Twitter Files
Three hours later, journalist Matt Taibbi tweeted more than three dozen tweets based on internal Twitter documents that revealed "a Frankensteinian tale of a human-built mechanism grown out of its designer's control."
Musk sees this release as a way to shape Twitter's public perception and internal culture in his image. We don't know if the CEO gave Taibbi the documents. Musk hyped the document dump before and during publication, but Taibbi cited "internal sources."
Taibbi shares email screenshots showing Twitter execs discussing the Post story and blocking its distribution. Taibbi says the emails show Twitter's "extraordinary steps" to bury the story.
Twitter communications chief Brandon Borrman has the most damning quote in the Files. Can we say this is policy? The story seemed unbelievable. It seemed like a hack... or not? Could Twitter, which ex-CEO Dick Costolo called "the free speech wing of the free speech party," censor a news story?
Many on the right say the Twitter Files prove the company acted at the behest of Democrats. Both parties had these tools, writes Taibbi. In 2020, both the Trump White House and Biden campaign made requests. He says the system for reporting tweets for deletion is unbalanced because Twitter employees' political donations favor Democrats. Perhaps. These donations may have helped Democrats connect with Twitter staff, but it's also possible they didn't. No emails in Taibbi's cache show these alleged illicit relations or any actions Twitter employees took as a result.
Even Musk's supporters were surprised by the drop. Miranda Devine of the New York Post told Tucker Carlson the documents weren't "the smoking gun we'd hoped for." Sebastian Gorka said on Truth Social, "So far, I'm deeply underwhelmed." DC Democrats collude with Palo Alto Democrats. Whoop!” The Washington Free Beacon's Joe Simonson said the Twitter files are "underwhelming." Twitter was staffed by Democrats who did their bidding. (Why?)
If "The Twitter Files" matter, why?
These emails led Twitter to suppress the Hunter Biden laptop story has real news value. It's rare for a large and valuable company like Twitter to address wrongdoing so thoroughly. Emails resemble FOIA documents. They describe internal drama at a company with government-level power. Katie Notopoulos tweeted, "Any news outlet would've loved this scoop!" It's not a'scandal' as teased."
Twitter's new owner calls it "the de facto public town square," implying public accountability. Like a government agency. Though it's exciting to receive once-hidden documents in response to a FOIA, they may be boring and tell you nothing new. Like Twitter files. We learned how Twitter blocked the Post's story, but not why. Before these documents were released, we knew Twitter had suppressed the story and who was involved.
These people were disciplined and left Twitter. Musk fired Vijaya Gadde, the former CLO who reportedly played a "key role" in the decision. Roth quit over Musk's "dictatorship." Musk arrived after Borrman left. Jack Dorsey, then-CEO, has left. Did those who digitally quarantined the Post's story favor Joe Biden and the Democrats? Republican Party opposition and Trump hatred? New York Post distaste? According to our documents, no. Was there political and press interference? True. We knew.
Taibbi interviewed anonymous ex-Twitter employees about the decision; all expressed shock and outrage. One source said, "Everyone knew this was fucked." Since Taibbi doesn't quote that expletive, we can assume the leaked emails contained few or no sensational quotes. These executives said little to support nefarious claims.
Outlets more invested in the Hunter Biden story than Gizmodo seem vexed by the release and muted headlines. The New York Post, which has never shied away from a blaring headline in its 221-year history, owns the story of Hunter Biden's laptop. Two Friday-night Post alerts about Musk's actions were restrained. Elon Musk will drop Twitter files on NY Post-Hunter Biden laptop censorship today. Elon Musk's Twitter dropped Post censorship details from Biden's laptop. Fox News' Apple News push alert read, "Elon Musk drops Twitter censorship documents."
Bombshell, bombshell, bombshell… what, exactly, is the bombshell? Maybe we've heard this story too much and are missing the big picture. Maybe these documents detail a well-documented decision.
The Post explains why on its website. "Hunter Biden laptop bombshell: Twitter invented reason to censor Post's reporting," its headline says.
Twitter's ad hoc decision to moderate a tabloid's content is not surprising. The social network had done this for years as it battled toxic users—violent white nationalists, virulent transphobes, harassers and bullies of all political stripes, etc. No matter how much Musk crows, the company never had content moderation under control. Buzzfeed's 2016 investigation showed how Twitter has struggled with abusive posters since 2006. Jack Dorsey and his executives improvised, like Musk.
Did the US government interfere with the ex-social VP's media company? That's shocking, a bombshell. Musk said Friday, "Twitter suppressing free speech by itself is not a 1st amendment violation, but acting under government orders with no judicial review is." Indeed! Taibbi believed this. August 2022: "The laptop is secondary." Zeynep Tufecki, a Columbia professor and New York Times columnist, says the FBI is cutting true story distribution. Taibbi retracted the claim Friday night: "I've seen no evidence of government involvement in the laptop story."
What’s the bottom line?
I'm still not sure what's at stake in the Hunter Biden scandal after dozens of New York Post articles, hundreds of hours of Fox News airtime, and thousands of tweets. Briefly: Joe Biden's son left his laptop with a questionable repairman. FBI confiscated it? The repairman made a copy and gave it to Rudy Giuliani's lawyer. The Post got it from Steve Bannon. On that laptop were videos of Hunter Biden smoking crack, cavorting with prostitutes, and emails about introducing his father to a Ukrainian businessman for $50,000 a month. Joe Biden urged Ukraine to fire a prosecutor investigating the company. What? The story seems to be about Biden family business dealings, right?
The discussion has moved past that point anyway. Now, the story is the censorship of it. Adrienne Rich wrote in "Diving Into the Wreck" that she came for "the wreck and not the story of the wreck" No matter how far we go, Hunter Biden's laptop is done. Now, the crash's story matters.
I'm dizzy. Katherine Miller of BuzzFeed wrote, "I know who I believe, and you probably do, too. To believe one is to disbelieve the other, which implicates us in the decision; we're stuck." I'm stuck. Hunter Biden's laptop is a political fabrication. You choose. I've decided.
This could change. Twitter Files drama continues. Taibbi said, "Much more to come." I'm dizzy.