


How I made $160,000 from non-fiction books
I've sold over 40,000 non-fiction books on Amazon and made over $160,000 in six years while writing on the side.
I have a full-time job and three young sons; I can't spend 40 hours a week writing. This article describes my journey.
I write mainly tech books:
Thanks to my readers, many wrote positive evaluations. Several are bestsellers.
A few have been adopted by universities as textbooks:
My books' passive income allows me more time with my family.
Knowing I could quit my job and write full time gave me more confidence. And I find purpose in my work (i am in christian ministry).
I'm always eager to write. When work is a dread or something bad happens, writing gives me energy. Writing isn't scary. In fact, I can’t stop myself from writing!
Writing has also established my tech authority. Universities use my books, as I've said. Traditional publishers have asked me to write books.
These mindsets helped me become a successful nonfiction author:
1. You don’t have to be an Authority
Yes, I have computer science experience. But I'm no expert on my topics. Before authoring "Beginning Node.js, Express & MongoDB," my most profitable book, I had no experience with those topics. Node was a new server-side technology for me. Would that stop me from writing a book? It can. I liked learning a new technology. So I read the top three Node books, took the top online courses, and put them into my own book (which makes me know more than 90 percent of people already).
I didn't have to worry about using too much jargon because I was learning as I wrote. An expert forgets a beginner's hardship.
"The fellow learner can aid more than the master since he knows less," says C.S. Lewis. The problem he must explain is recent. The expert has forgotten.”
2. Solve a micro-problem (Niching down)
I didn't set out to write a definitive handbook. I found a market with several challenges and wrote one book. Ex:
- Instead of web development, what about web development using Angular?
- Instead of Blockchain, what about Blockchain using Solidity and React?
- Instead of cooking recipes, how about a recipe for a specific kind of diet?
- Instead of Learning math, what about Learning Singapore Math?
3. Piggy Backing Trends
The above topics may still be a competitive market. E.g. Angular, React. To stand out, include the latest technologies or trends in your book. Learn iOS 15 instead of iOS programming. Instead of personal finance, what about personal finance with NFTs.
Even though you're a newbie author, your topic is well-known.
4. Publish short books
My books are known for being direct. Many people like this:
Your reader will appreciate you cutting out the fluff and getting to the good stuff. A reader can finish and review your book.
Second, short books are easier to write. Instead of creating a 500-page book for $50 (which few will buy), write a 100-page book that answers a subset of the problem and sell it for less. (You make less, but that's another subject). At least it got published instead of languishing. Less time spent creating a book means less time wasted if it fails. Write a small-bets book portfolio like Daniel Vassallo!
Third, it's $2.99-$9.99 on Amazon (gets 70 percent royalties for ebooks). Anything less receives 35% royalties. $9.99 books have 20,000–30,000 words. If you write more and charge more over $9.99, you get 35% royalties. Why not make it a $9.99 book?
(This is the ebook version.) Paperbacks cost more. Higher royalties allow for higher prices.
5. Validate book idea
Amazon will tell you if your book concept, title, and related phrases are popular. See? Check its best-sellers list.
150,000 is preferable. It sells 2–3 copies daily. Consider your rivals. Profitable niches have high demand and low competition.
Don't be afraid of competitive niches. First, it shows high demand. Secondly, what are the ways you can undercut the completion? Better book? Or cheaper option? There was lots of competition in my NodeJS book's area. None received 4.5 stars or more. I wrote a NodeJS book. Today, it's a best-selling Node book.
What’s Next
So long. Part II follows. Meanwhile, I will continue to write more books!
Follow my journey on Twitter.
This post is a summary. Read full article here
More on Entrepreneurship/Creators

Athirah Syamimi
3 years ago
Here's How I Built A Business Offering Unlimited Design Services in Just One Weekend.
Weekend project: limitless design service. It was fun to see whether I could start a business quickly.
I use no-code apps to save time and resources.
TL;DR I started a business utilizing EditorX for my website, Notion for client project management, and a few favors to finish my portfolio.
First step: research (Day 1)
I got this concept from a Kimp Instagram ad. The Minimalist Hustler Daily newsletter mentioned a similar and cheaper service (Graphically).
I Googled other unlimited design companies. Many provide different costs and services. Some supplied solely graphic design, web development, or copywriting.
Step 2: Brainstorming (Day 1)
I did something simple.
What benefits and services to provide
Price to charge
Since it's a one-person performance (for now), I'm focusing on graphic design. I can charge less.
So I don't overwhelm myself and can accommodate budget-conscious clientele.
Step 3: Construction (Day 1 & 2)
This project includes a management tool, a website, and a team procedure.
I built a project management tool and flow first. Once I had the flow and a Notion board, I tested it with design volunteers. They fake-designed while I built the website.
Tool for Project Management
I modified a Notion template. My goal is to keep clients and designers happy.
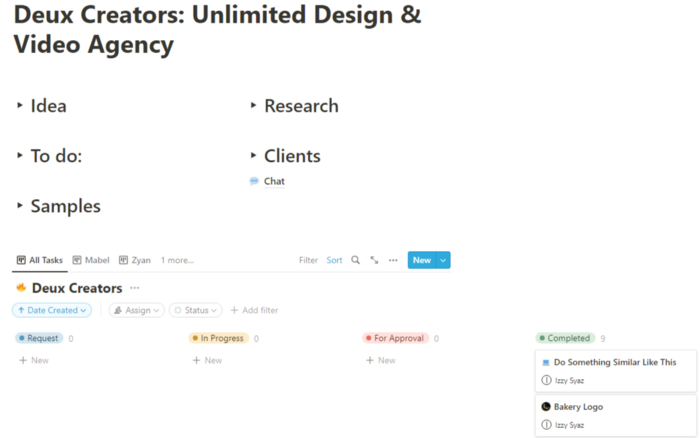
Team Approach
My sister, my partner, and I kept this business lean. I tweaked the Notion board to make the process smooth. By the end of Sunday, I’d say it’s perfect!
Website
I created the website after they finished the fake design demands. EditorX's drag-and-drop builder attracted me. I didn't need to learn code, and there are templates.
I used a template wireframe.
This project's hardest aspect is developing the site. It's my first time using EditorX and I'm no developer.
People answer all your inquiries in a large community forum.
As a first-time user developing a site in two days, I think I performed OK. Here's the site for feedback.

4th step: testing (Day 2)
Testing is frustrating because it works or doesn't. My testing day was split in two.
testing the workflow from payment to onboarding to the website
the demand being tested
It's working so far. If someone gets the trial, they can request design work.
I've gotten a couple of inquiries about demand. I’ll be working with them as a start.
Completion
Finally! I built my side project in one weekend. It's too early to tell if this is successful. I liked that I didn't squander months of resources testing out an idea.

Mangu Solutions
3 years ago
Growing a New App to $15K/mo in 6 Months [SaaS Case Study]
Discover How We Used Facebook Ads to Grow a New Mobile App from $0 to $15K MRR in Just 6 Months and Our Strategy to Hit $100K a Month.
Our client introduced a mobile app for Poshmark resellers in December and wanted as many to experience it and subscribe to the monthly plan.
An Error We Committed
We initiated a Facebook ad campaign with a "awareness" goal, not "installs." This sent them to a landing page that linked to the iPhone App Store and Android Play Store. Smart, right?
We got some installs, but we couldn't tell how many came from the ad versus organic/other channels because the objective we chose only reported landing page clicks, not app installs.
We didn't know which interest groups/audiences had the best cost per install (CPI) to optimize and scale our budget.
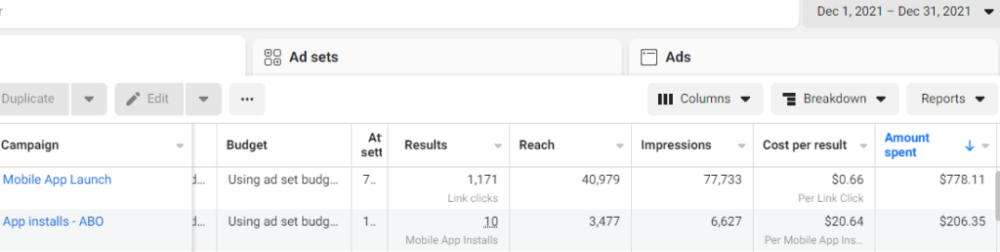
After spending $700 without adequate data (installs and trials report), we stopped the campaign and worked with our client's app developer to set up app events tracking.
This allowed us to create an installs campaign and track installs, trials, and purchases (in some cases).
Finding a Successful Audience
Once we knew what ad sets brought in what installs at what cost, we began optimizing and testing other interest groups and audiences, growing the profitable low CPI ones and eliminating the high CPI ones.
We did all our audience testing using an ABO campaign (Ad Set Budget Optimization), spending $10 to $30 on each ad set for three days and optimizing afterward. All ad sets under $30 were moved to a CBO campaign (Campaign Budget Optimization).
We let Facebook's AI decide how much to spend on each ad set, usually the one most likely to convert at the lowest cost.
If the CBO campaign maintains a nice CPI, we keep increasing the budget by $50 every few days or duplicating it sometimes in order to double the budget. This is how we've scaled to $400/day profitably.

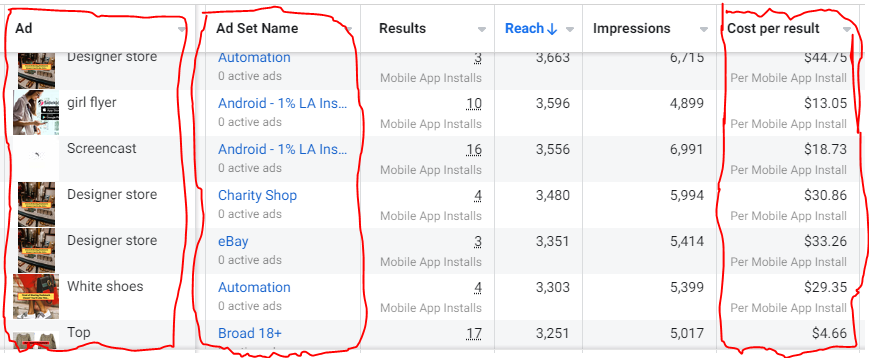
Finding Successful Creatives
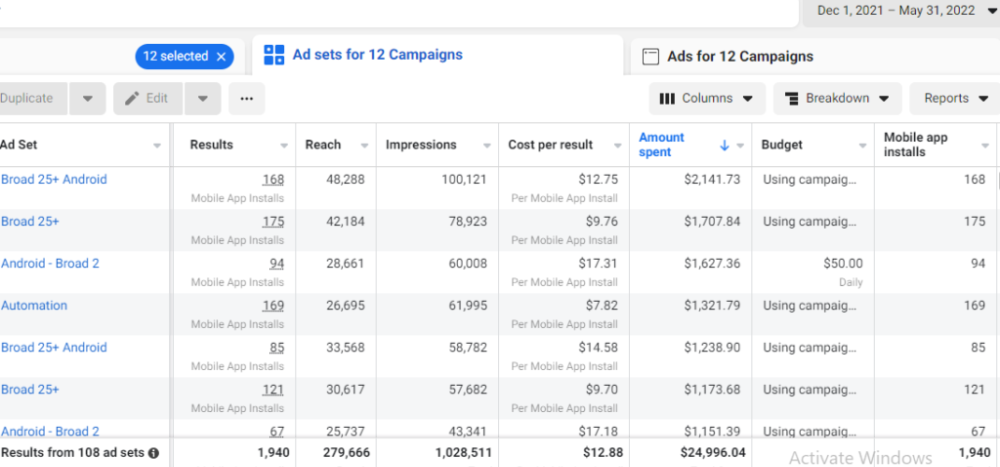
Per campaign, we tested 2-6 images/videos. Same ad copy and CTA. There was no clear winner because some images did better with some interest groups.
The image above with mail packages, for example, got us a cheap CPI of $9.71 from our Goodwill Stores interest group but, a high $48 CPI from our lookalike audience. Once we had statistically significant data, we turned off the high-cost ad.
New marketers who are just discovering A/B testing may assume it's black and white — winner and loser. However, Facebook ads' machine learning and reporting has gotten so sophisticated that it's hard to call a creative a flat-out loser, but rather a 'bad fit' for some audiences, and perfect for others.
You can see how each creative performs across age groups and optimize.
How Many Installs Did It Take Us to Earn $15K Per Month?
Six months after paying $25K, we got 1,940 app installs, 681 free trials, and 522 $30 monthly subscriptions. 522 * $30 gives us $15,660 in monthly recurring revenue (MRR).
Next, what? $100K per month
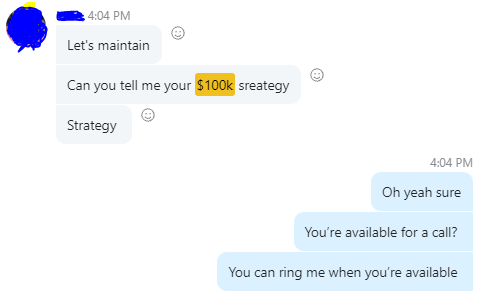
The conversation above is with the app's owner. We got on a 30-minute call where I shared how I plan to get the app to be making $100K a month like I’ve done for other businesses.
Reverse Engineering $100K
Formula:
For $100K/month, we need 3,334 people to pay $30/month. 522 people pay that. We need 2,812 more paid users.
522 paid users from 1,940 installs is a 27% conversion rate. To hit $100K/month, we need 10,415 more installs. Assuming...
With a $400 daily ad spend, we average 40 installs per day. This means that if everything stays the same, it would take us 260 days (around 9 months) to get to $100K a month (MRR).
Conclusion
You must market your goods to reach your income objective (without waiting forever). Paid ads is the way to go if you hate knocking on doors or irritating friends and family (who aren’t scalable anyways).
You must also test and optimize different angles, audiences, interest groups, and creatives.

Sanjay Priyadarshi
3 years ago
Meet a Programmer Who Turned Down Microsoft's $10,000,000,000 Acquisition Offer
Failures inspire young developers
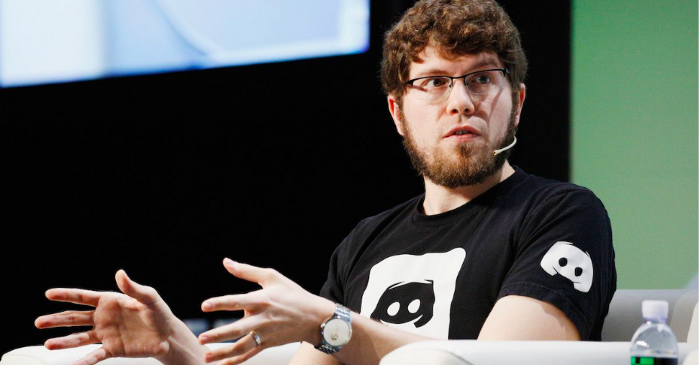
Jason citron created many products.
These products flopped.
Microsoft offered $10 billion for one of these products.
He rejected the offer since he was so confident in his success.
Let’s find out how he built a product that is currently valued at $15 billion.
Early in his youth, Jason began learning to code.
Jason's father taught him programming and IT.
His father wanted to help him earn money when he needed it.
Jason created video games and websites in high school.
Jason realized early on that his IT and programming skills could make him money.
Jason's parents misjudged his aptitude for programming.
Jason frequented online programming communities.
He looked for web developers. He created websites for those people.
His parents suspected Jason sold drugs online. When he said he used programming to make money, they were shocked.
They helped him set up a PayPal account.
Florida higher education to study video game creation
Jason never attended an expensive university.
He studied game design in Florida.
“Higher Education is an interesting part of society… When I work with people, the school they went to never comes up… only thing that matters is what can you do…At the end of the day, the beauty of silicon valley is that if you have a great idea and you can bring it to the life, you can convince a total stranger to give you money and join your project… This notion that you have to go to a great school didn’t end up being a thing for me.”
Jason's life was altered by Steve Jobs' keynote address.
After graduating, Jason joined an incubator.
Jason created a video-dating site first.
Bad idea.
Nobody wanted to use it when it was released, so they shut it down.
He made a multiplayer game.
It was released on Bebo. 10,000 people played it.
When Steve Jobs unveiled the Apple app store, he stopped playing.
The introduction of the app store resembled that of a new gaming console.
Jason's life altered after Steve Jobs' 2008 address.
“Whenever a new video game console is launched, that’s the opportunity for a new video game studio to get started, it’s because there aren’t too many games available…When a new PlayStation comes out, since it’s a new system, there’s only a handful of titles available… If you can be a launch title you can get a lot of distribution.”
Apple's app store provided a chance to start a video game company.
They released an app after 5 months of work.
Aurora Feint is the game.
Jason believed 1000 players in a week would be wonderful. A thousand players joined in the first hour.
Over time, Aurora Feints' game didn't gain traction. They don't make enough money to keep playing.
They could only make enough for one month.
Instead of buying video games, buy technology
Jason saw that they established a leaderboard, chat rooms, and multiplayer capabilities and believed other developers would want to use these.
They opted to sell the prior game's technology.
OpenFeint.
Assisting other game developers
They had no money in the bank to create everything needed to make the technology user-friendly.
Jason and Daniel designed a website saying:
“If you’re making a video game and want to have a drop in multiplayer support, you can use our system”
TechCrunch covered their website launch, and they gained a few hundred mailing list subscribers.
They raised seed funding with the mailing list.
Nearly all iPhone game developers started adopting the Open Feint logo.
“It was pretty wild… It was really like a whole social platform for people to play with their friends.”
What kind of a business model was it?
OpenFeint originally planned to make the software free for all games. As the game gained popularity, they demanded payment.
They later concluded it wasn't a good business concept.
It became free eventually.
Acquired for $104 million
Open Feint's users and employees grew tremendously.
GREE bought OpenFeint for $104 million in April 2011.
GREE initially committed to helping Jason and his team build a fantastic company.
Three or four months after the acquisition, Jason recognized they had a different vision.
He quit.
Jason's Original Vision for the iPad
Jason focused on distribution in 2012 to help businesses stand out.
The iPad market and user base were growing tremendously.
Jason said the iPad may replace mobile gadgets.
iPad gamers behaved differently than mobile gamers.
People sat longer and experienced more using an iPad.
“The idea I had was what if we built a gaming business that was more like traditional video games but played on tablets as opposed to some kind of mobile game that I’ve been doing before.”
Unexpected insight after researching the video game industry
Jason learned from studying the gaming industry that long-standing companies had advantages beyond a single release.
Previously, long-standing video game firms had their own distribution system. This distribution strategy could buffer time between successful titles.
Sony, Microsoft, and Valve all have gaming consoles and online stores.
So he built a distribution system.
He created a group chat app for gamers.
He envisioned a team-based multiplayer game with text and voice interaction.
His objective was to develop a communication network, release more games, and start a game distribution business.
Remaking the video game League of Legends
Jason and his crew reimagined a League of Legends game mode for 12-inch glass.
They adapted the game for tablets.
League of Legends was PC-only.
So they rebuilt it.
They overhauled the game and included native mobile experiences to stand out.
Hammer and Chisel was the company's name.
18 people worked on the game.
The game was funded. The game took 2.5 years to make.
Was the game a success?
July 2014 marked the game's release. The team's hopes were dashed.
Critics initially praised the game.
Initial installation was widespread.
The game failed.
As time passed, the team realized iPad gaming wouldn't increase much and mobile would win.
Jason was given a fresh idea by Stan Vishnevskiy.
Stan Vishnevskiy was a corporate engineer.
He told Jason about his plan to design a communication app without a game.
This concept seeded modern strife.
“The insight that he really had was to put a couple of dots together… we’re seeing our customers communicating around our own game with all these different apps and also ourselves when we’re playing on PC… We should solve that problem directly rather than needing to build a new game…we should start making it on PC.”
So began Discord.
Online socializing with pals was the newest trend.
Jason grew up playing video games with his friends.
He never played outside.
Jason had many great moments playing video games with his closest buddy, wife, and brother.
Discord was about providing a location for you and your group to speak and hang out.
Like a private cafe, bedroom, or living room.
Discord was developed for you and your friends on computers and phones.
You can quickly call your buddies during a game to conduct a conference call. Put the call on speaker and talk while playing.
Discord wanted to give every player a unique experience. Because coordinating across apps was a headache.
The entire team started concentrating on Discord.
Jason decided Hammer and Chisel would focus on their chat app.
Jason didn't want to make a video game.
How Discord attracted the appropriate attention
During the first five months, the entire team worked on the game and got feedback from friends.
This ensures product improvement. As a result, some teammates' buddies started utilizing Discord.
The team knew it would become something, but the result was buggy. App occasionally crashed.
Jason persuaded a gamer friend to write on Reddit about the software.
New people would find Discord. Why not?
Reddit users discovered Discord and 50 started using it frequently.
Discord was launched.
Rejecting the $10 billion acquisition proposal
Discord has increased in recent years.
It sends billions of messages.
Discord's users aren't tracked. They're privacy-focused.
Purchase offer
Covid boosted Discord's user base.
Weekly, billions of messages were transmitted.
Microsoft offered $10 billion for Discord in 2021.
Jason sold Open Feint for $104m in 2011.
This time, he believed in the product so much that he rejected Microsoft's offer.
“I was talking to some people in the team about which way we could go… The good thing was that most of the team wanted to continue building.”
Last time, Discord was valued at $15 billion.
Discord raised money on March 12, 2022.
The $15 billion corporation raised $500 million in 2021.
You might also like

Jess Rifkin
3 years ago
As the world watches the Russia-Ukraine border situation, This bill would bar aid to Ukraine until the Mexican border is secured.
Although Mexico and Ukraine are thousands of miles apart, this legislation would link their responses.
Context
Ukraine was a Soviet republic until 1991. A significant proportion of the population, particularly in the east, is ethnically Russian. In February, the Russian military invaded Ukraine, intent on overthrowing its democratically elected government.
This could be the biggest European land invasion since WWII. In response, President Joe Biden sent 3,000 troops to NATO countries bordering Ukraine to help with Ukrainian refugees, with more troops possible if the situation worsened.
In July 2021, the US Border Patrol reported its highest monthly encounter total since March 2000. Some Republicans compare Biden's response to the Mexican border situation to his response to the Ukrainian border situation, though the correlation is unclear.
What the bills do
Two new Republican bills seek to link the US response to Ukraine to the situation in Mexico.
The Secure America's Borders First Act would prohibit federal funding for Ukraine until the US-Mexico border is “operationally controlled,” including a wall as promised by former President Donald Trump. (The bill even mandates a 30-foot-high wall.)
The USB (Ukraine and Southern Border) Act, introduced on February 8 by Rep. Matt Rosendale (R-MT0), would allow the US to support Ukraine, but only if the number of Armed Forces deployed there is less than the number deployed to the Mexican border. Madison Cawthorne introduced H.R. 6665 on February 9th (R-NC11).
What backers say
Supporters argue that even if the US should militarily assist Ukraine, our own domestic border situation should take precedence.
After failing to secure our own border and protect our own territorial integrity, ‘America Last' politicians on both sides of the aisle now tell us that we must do so for Ukraine. “Before rushing America into another foreign conflict over an Eastern European nation's border thousands of miles from our shores, they should first secure our southern border.”
“If Joe Biden truly cared about Americans, he would prioritize national security over international affairs,” Rep. Cawthorn said in a separate press release. The least we can do to secure our own country is send the same number of troops to the US-Mexico border to assist our border patrol agents working diligently to secure America.
What opponents say
The president has defended his Ukraine and Mexico policies, stating that both seek peace and diplomacy.
Our nations [the US and Mexico] have a long and complicated history, and we haven't always been perfect neighbors, but we have seen the power and purpose of cooperation,” Biden said in 2021. “We're safer when we work together, whether it's to manage our shared border or stop the pandemic. [In both the Obama and Biden administration], we made a commitment that we look at Mexico as an equal, not as somebody who is south of our border.”
No mistake: If Russia goes ahead with its plans, it will be responsible for a catastrophic and unnecessary war of choice. To protect our collective security, the United States and our allies are ready to defend every inch of NATO territory. We won't send troops into Ukraine, but we will continue to support the Ukrainian people... But, I repeat, Russia can choose diplomacy. It is not too late to de-escalate and return to the negotiating table.”
Odds of passage
The Secure America's Borders First Act has nine Republican sponsors. Either the House Armed Services or Foreign Affairs Committees may vote on it.
Rep. Paul Gosar, a Republican, co-sponsored the USB Act (R-AZ4). The House Armed Services Committee may vote on it.
With Republicans in control, passage is unlikely.

Ash Parrish
3 years ago
Sonic Prime and indie games on Netflix
Netflix will stream Spiritfarer, Raji: An Ancient Epic, and Lucky Luna.
Netflix's Geeked Week brought a slew of announcements. The flurry of reveals for The Sandman, The Umbrella Academy season 3, One Piece, and more also included game and game-adjacent announcements.
Netflix released a teaser for Cuphead season 2 ahead of its August premiere, featuring more of Grey DeLisle's Ms. Chalice. DOTA: Dragon's Blood season 3 hits Netflix in August. Tekken, the fighting game that throws kids off cliffs, gets an anime, Tekken: Bloodline.
Netflix debuted a clip of Sonic Prime before Sonic Origins in June and Sonic Frontiers in 2022.
Castlevania: Nocturne will follow Richter Belmont.
Netflix is reviving licensed games with titles based on its shows. There's a Queen's Gambit chess game, a Shadow and Bone RPG, a La Casa de Papel heist adventure, and a Too Hot to Handle game where a pregnant woman must choose between stabbing her cheating ex or forgiving him.
Riot's rhythm platformer Hextech Mayhem debuted on Netflix last year, and now Netflix is adding games from Devolver Digital. Reigns: Three Kingdoms is a card game that lets players choose the fate of Three Kingdoms-era China by swiping left or right on cards. Spiritfarer, the "cozy game about death" from 2020, and Raji: An Ancient Epic are coming to Netflix. Poinpy, a vertical climber from the creator of Downwell, is now on Netflix.
Desta: The Memories Between is a turn-based strategy game set in dreams and memories.
Snowman's Lucky Luna will also be added soon.
With these games, Netflix is expanding beyond dinky mobile games — it plans to have 50 by the end of the year — and could be a serious platform for indies that want to expand into mobile. It takes gaming seriously.

Caleb Naysmith
3 years ago Draft
A Myth: Decentralization
It’s simply not conceivable, or at least not credible.
One of the most touted selling points of Crypto has always been this grandiose idea of decentralization. Bitcoin first arose in 2009 after the housing crisis and subsequent crash that came with it. It aimed to solve this supposed issue of centralization. Nobody “owns” Bitcoin in theory, so the idea then goes that it won’t be subject to the same downfalls that led to the 2008 crash or similarly speculative events that led to the 2008 disaster. The issue is the banks, not the human nature associated with the greedy individuals running them.
Subsequent blockchains have attempted to fix many of the issues of Bitcoin by increasing capacity, decreasing the costs and processing times associated with Bitcoin, and expanding what can be done with their blockchains. Since nobody owns Bitcoin, it hasn’t really been able to be expanded on. You have people like Vitalk Buterin, however, that actively work on Ethereum though.
The leap from Bitcoin to Ethereum was a massive leap toward centralization, and the trend has only gotten worse. In fact, crypto has since become almost exclusively centralized in recent years.
Decentralization is only good in theory
It’s a good idea. In fact, it’s a wonderful idea. However, like other utopian societies, individuals misjudge human nature and greed. In a perfect world, decentralization would certainly be a wonderful idea because sure, people may function as their own banks, move payments immediately, remain anonymous, and so on. However, underneath this are a couple issues:
You can already send money instantaneously today.
They are not decentralized.
Decentralization is a bad idea.
Being your own bank is a stupid move.
Let’s break these down. Some are quite simple, but lets have a look.
Sending money right away
One thing with crypto is the idea that you can send payments instantly. This has pretty much been entirely solved in current times. You can transmit significant sums of money instantly for a nominal cost and it’s instantaneously cleared. Venmo was launched in 2009 and has since increased to prominence, and currently is on most people's phones. I can directly send ANY amount of money quickly from my bank to another person's Venmo account.
Comparing that with ETH and Bitcoin, Venmo wins all around. I can send money to someone for free instantly in dollars and the only fee paid is optional depending on when you want it.
Both Bitcoin and Ethereum are subject to demand. If the blockchains have a lot of people trying to process transactions fee’s go up, and the time that it takes to receive your crypto takes longer. When Ethereum gets bad, people have reported spending several thousand of dollars on just 1 transaction.
These transactions take place via “miners” bundling and confirming transactions, then recording them on the blockchain to confirm that the transaction did indeed happen. They charge fees to do this and are also paid in Bitcoin/ETH. When a transaction is confirmed, it's then sent to the other users wallet. This within itself is subject to lots of controversy because each transaction needs to be confirmed 6 times, this takes massive amounts of power, and most of the power is wasted because this is an adversarial system in which the person that mines the transaction gets paid, and everyone else is out of luck. Also, these could theoretically be subject to a “51% attack” in which anyone with over 51% of the mining hash rate could effectively control all of the transactions, and reverse transactions while keeping the BTC resulting in “double spending”.
There are tons of other issues with this, but essentially it means: They rely on these third parties to confirm the transactions. Without people confirming these transactions, Bitcoin stalls completely, and if anyone becomes too dominant they can effectively control bitcoin.
Not to mention, these transactions are in Bitcoin and ETH, not dollars. So, you need to convert them to dollars still, and that's several more transactions, and likely to take several days anyway as the centralized exchange needs to send you the money by traditional methods.
They are not distributed
That takes me to the following point. This isn’t decentralized, at all. Bitcoin is the closest it gets because Satoshi basically closed it to new upgrades, although its still subject to:
Whales
Miners
It’s vital to realize that these are often the same folks. While whales aren’t centralized entities typically, they can considerably effect the price and outcome of Bitcoin. If the largest wallets holding as much as 1 million BTC were to sell, it’d effectively collapse the price perhaps beyond repair. However, Bitcoin can and is pretty much controlled by the miners. Further, Bitcoin is more like an oligarchy than decentralized. It’s been effectively used to make the rich richer, and both the mining and price is impacted by the rich. The overwhelming minority of those actually using it are retail investors. The retail investors are basically never the ones generating money from it either.
As far as ETH and other cryptos go, there is realistically 0 case for them being decentralized. Vitalik could not only kill it but even walking away from it would likely lead to a significant decline. It has tons of issues right now that Vitalik has promised to fix with the eventual Ethereum 2.0., and stepping away from it wouldn’t help.
Most tokens as well are generally tied to some promise of future developments and creators. The same is true for most NFT projects. The reason 99% of crypto and NFT projects fail is because they failed to deliver on various promises or bad dev teams, or poor innovation, or the founders just straight up stole from everyone. I could go more in-depth than this but go find any project and if there is a dev team, company, or person tied to it then it's likely, not decentralized. The success of that project is directly tied to the dev team, and if they wanted to, most hold large wallets and could sell it all off effectively killing the project. Not to mention, any crypto project that doesn’t have a locked contract can 100% be completely rugged and they can run off with all of the money.
Decentralization is undesirable
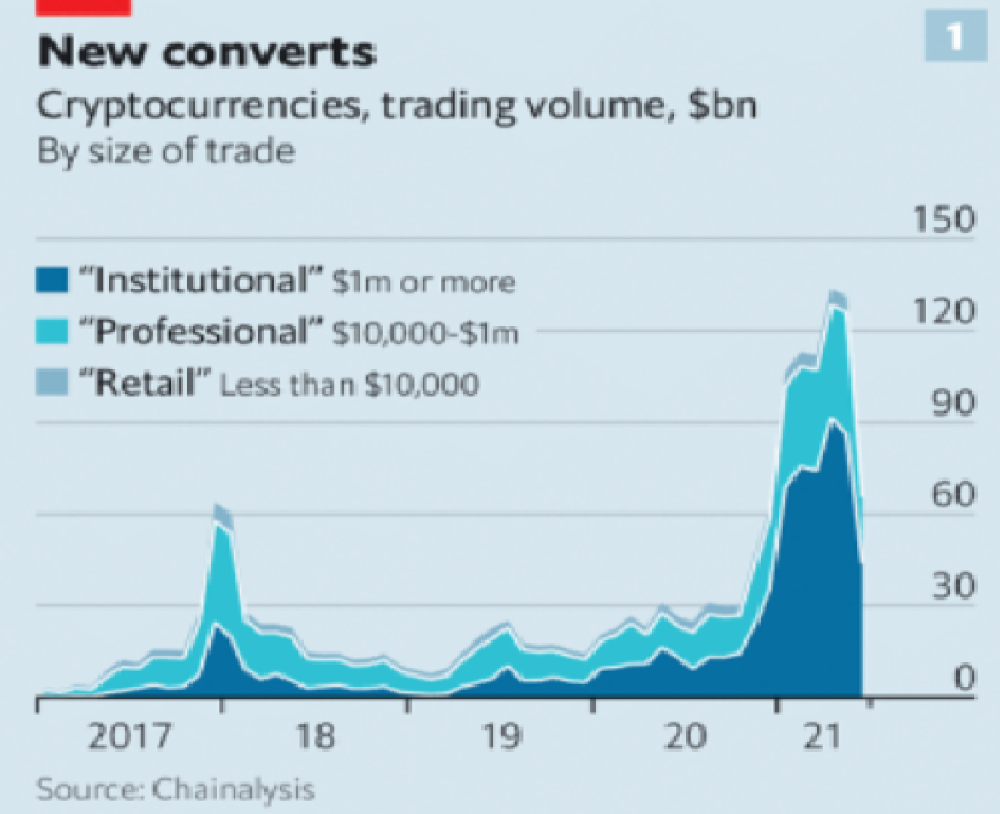
Even if they were decentralized then it would not be a good thing. The graphic above indicates this is effectively a rich person’s unregulated playground… so it’s exactly like… the very issue it tried to solve?
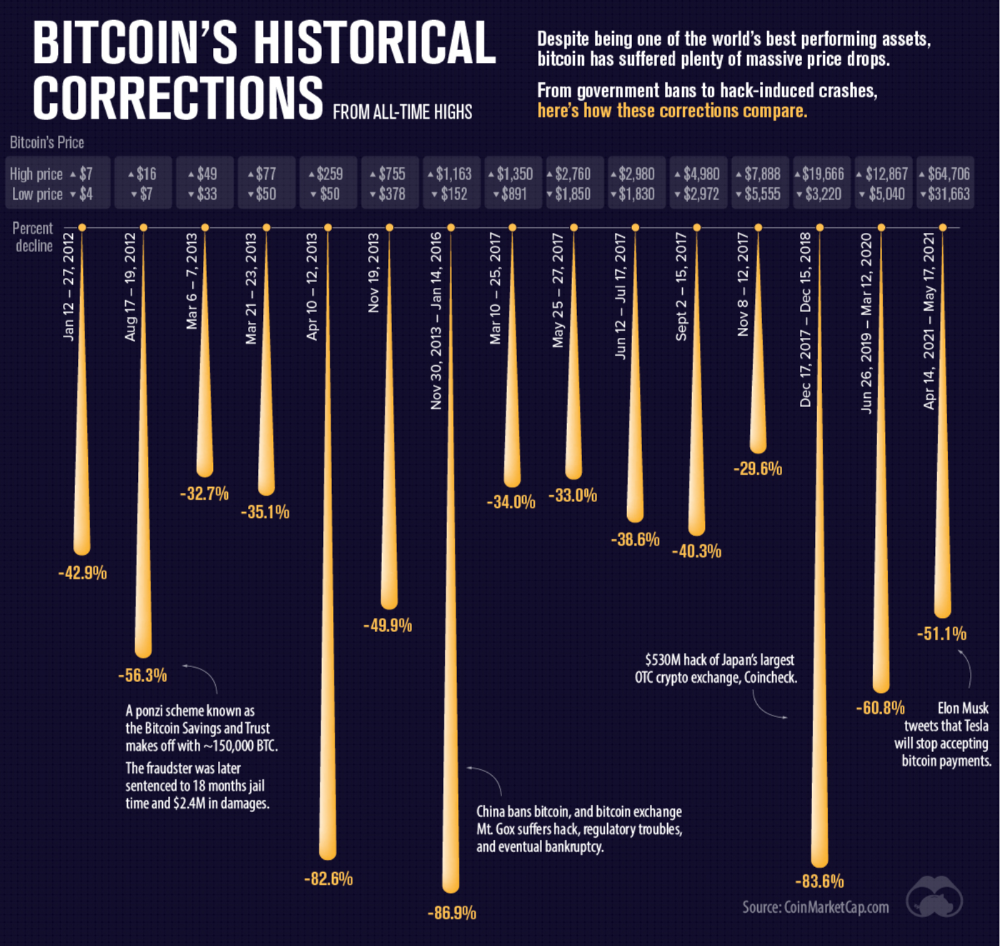
Not to mention, it’s supposedly meant to prevent things like 2008, but is regularly subjected to 50–90% drawdowns in value? Back when Bitcoin was only known in niche parts of the dark web and illegal markets, it would regularly drop as much as 90% and has a long history of massive drawdowns.
The majority of crypto is blatant scams, and ALL of crypto is a “zero” or “negative” sum game in that it relies on the next person buying for people to make money. This is not a good thing. This has yet to solve any issues around what caused the 2008 crisis. Rather, it seemingly amplified all of the bad parts of it actually. Crypto is the ultimate speculative asset and realistically has no valuation metric. People invest in Apple because it has revenue and cash on hand. People invest in crypto purely for speculation. The lack of regulation or accountability means this is amplified to the most extreme degree where anything goes: Fraud, deception, pump and dumps, scams, etc. This results in a pure speculative madhouse where, unsurprisingly, only the rich win. Not only that but the deck is massively stacked in against the everyday investor because you can’t do a pump and dump without money.
At the heart of all of this is still the same issues: greed and human nature. However, in setting out to solve the issues that allowed 2008 to happen, they made something that literally took all of the bad parts of 2008 and then amplified it. 2008, similarly, was due to greed and human nature but was allowed to happen due to lack of oversite, rich people's excessive leverage over the poor, and excessive speculation. Crypto trades SOLELY on human emotion, has 0 oversite, is pure speculation, and the power dynamic is just as bad or worse.
Why should each individual be their own bank?
This is the last one, and it's short and basic. Why do we want people functioning as their own bank? Everything we do relies on another person. Without the internet, and internet providers there is no crypto. We don’t have people functioning as their own home and car manufacturers or internet service providers. Sure, you might specialize in some of these things, but masquerading as your own bank is a horrible idea.
I am not in the banking industry so I don’t know all the issues with banking. Most people aren’t in banking or crypto, so they don’t know the ENDLESS scams associated with it, and they are bound to lose their money eventually.
If you appreciate this article and want to read more from me and authors like me, without any limits, consider buying me a coffee: buymeacoffee.com/calebnaysmith