


More on Entrepreneurship/Creators

Rick Blyth
3 years ago
Looking for a Reliable Micro SaaS Niche
Niches are rich, as the adage goes.
Micro SaaS requires a great micro-niche; otherwise, it's merely plain old SaaS with a large audience.
Instead of targeting broad markets with few identifying qualities, specialise down to a micro-niche. How would you target these users?
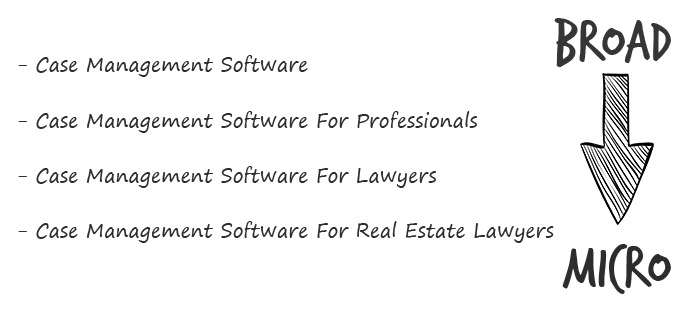
Better go tiny. You'll locate and engage new consumers more readily and serve them better with a customized solution.
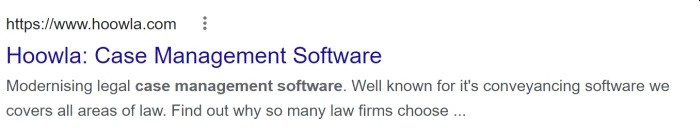
Imagine you're a real estate lawyer looking for a case management solution. Because it's so specific to you, you'd be lured to this link:
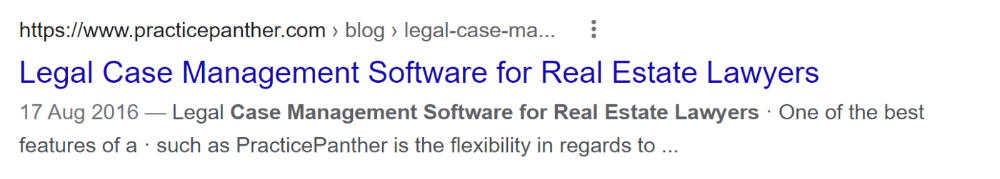
instead of below:
Next, locate mini SaaS niches that could work for you. You're not yet looking at the problems/solutions in these areas, merely shortlisting them.
The market should be growing, not shrinking
We shouldn't design apps for a declining niche. We intend to target stable or growing niches for the next 5 to 10 years.
If it's a developing market, you may be able to claim a stake early. You must balance this strategy with safer, longer-established niches (accountancy, law, health, etc).
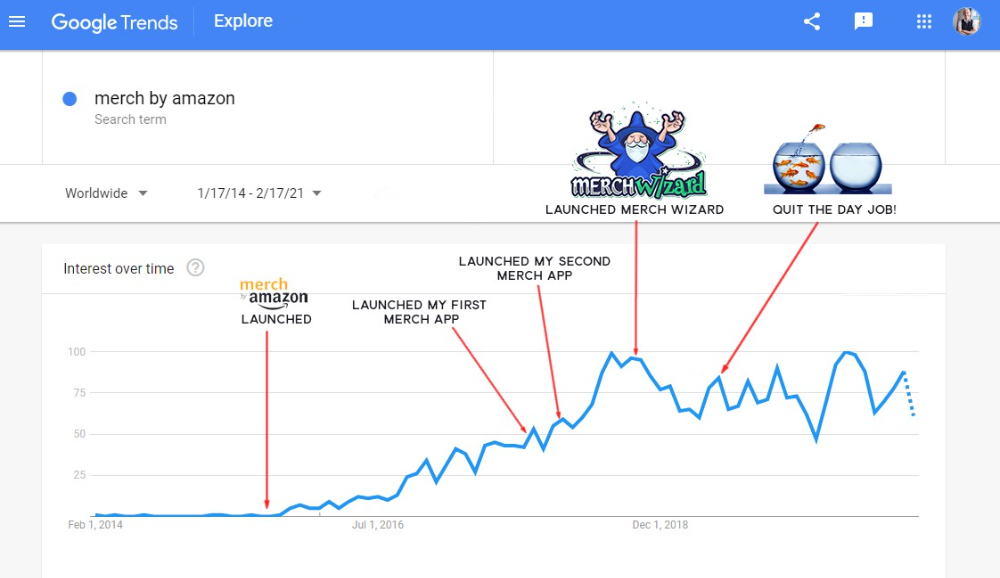
First Micro SaaS apps I designed were for Merch By Amazon creators, a burgeoning niche. I found this niche when searching for passive income.
Graphic designers and entrepreneurs post their art to Amazon to sell on clothes. When Amazon sells their design, they get a royalty. Since 2015, this platform and specialty have grown dramatically.
Amazon doesn't publicize the amount of creators on the platform, but it's possible to approximate by looking at Facebook groups, Reddit channels, etc.
I could see the community growing week by week, with new members joining. Merch was an up-and-coming niche, and designers made money when their designs sold. All I had to do was create tools that let designers focus on making bestselling designs.
Look at the Google Trends graph below to see how this niche has evolved and when I released my apps and resigned my job.
Are the users able to afford the tools?
Who's your average user? Consumer or business? Is your solution budgeted?
If they're students, you'll struggle to convince them to subscribe to your study-system app (ahead of video games and beer).
Let's imagine you designed a Shopify plugin that emails customers when a product is restocked. If your plugin just needs 5 product sales a month to justify its cost, everyone wins (just be mindful that one day Shopify could potentially re-create your plugins functionality within its core offering making your app redundant ).
Do specialized users buy tools? If so, that's comforting. If not, you'd better have a compelling value proposition for your end customer if you're the first.
This should include how much time or money your program can save or make the user.
Are you able to understand the Micro SaaS market?
Ideally, you're already familiar about the industry/niche. Maybe you're fixing a challenge from your day job or freelance work.
If not, evaluate how long it would take to learn the niche's users. Health & Fitness is easier to relate to and understand than hedge fund derivatives trading.
Competing in these complex (and profitable) fields might offer you an edge.

B2C, B2M, or B2B?
Consider your user base's demographics. Will you target businesses, consumers, or both? Let's examine the different consumer types:
B2B refers to business-to-business transactions where customers are other businesses. UpVoty, Plutio, Slingshot, Salesforce, Atlassian, and Hubspot are a few examples of SaaS, ranging from Micro SaaS to SaaS.
Business to Consumer (B2C), in which your clients are people who buy things. For instance, Duolingo, Canva, and Nomad List.
For instance, my tool KDP Wizard has a mixed user base of publishing enterprises and also entrepreneurial consumers selling low-content books on Amazon. This is a case of business to many (B2M), where your users are a mixture of businesses and consumers. There is a large SaaS called Dropbox that offers both personal and business plans.
Targeting a B2B vs. B2C niche is very different. The sales cycle differs.
A B2B sales staff must make cold calls to potential clients' companies. Long sales, legal, and contractual conversations are typically required for each business to get the go-ahead. The cost of obtaining a new customer is substantially more than it is for B2C, despite the fact that the recurring fees are significantly higher.
Since there is typically only one individual making the purchasing decision, B2C signups are virtually always self-service with reduced recurring fees. Since there is typically no outbound sales staff in B2C, acquisition costs are significantly lower than in B2B.
User Characteristics for B2B vs. B2C
Consider where your niche's users congregate if you don't already have a presence there.
B2B users frequent LinkedIn and Twitter. B2C users are on Facebook/Instagram/Reddit/Twitter, etc.
Churn is higher in B2C because consumers haven't gone through all the hoops of a B2B sale. Consumers are more unpredictable than businesses since they let their bank cards exceed limitations or don't update them when they expire.
With a B2B solution, there's a contractual arrangement and the firm will pay the subscription as long as they need it.
Depending on how you feel about the above (sales team vs. income vs. churn vs. targeting), you'll know which niches to pursue.
You ought to respect potential customers.
Would you hang out with customers?
You'll connect with users at conferences (in-person or virtual), webinars, seminars, screenshares, Facebook groups, emails, support calls, support tickets, etc.
If talking to a niche's user base makes you shudder, you're in for a tough road. Whether they're demanding or dull, avoid them if possible.
Merch users are mostly graphic designers, side hustlers, and entrepreneurs. These laid-back users embrace technologies that assist develop their Merch business.
I discovered there was only one annual conference for this specialty, held in Seattle, USA. I decided to organize a conference for UK/European Merch designers, despite never having done so before.
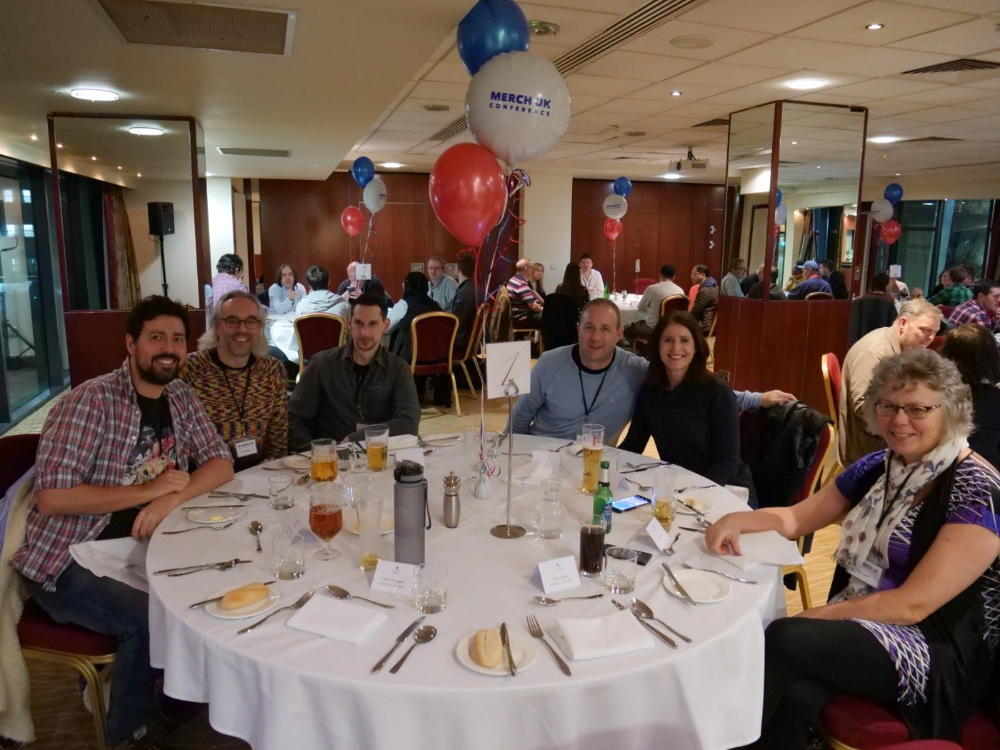
Hosting a conference for over 80 people was stressful, and it turned out to be much bigger than expected, with attendees from the US, Europe, and the UK.
I met many specialized users, built relationships, gained trust, and picked their brains in person. Many of the attendees were already Merch Wizard users, so hearing their feedback and ideas for future features was invaluable.
focused and specific
Instead of building for a generic, hard-to-reach market, target a specific group.
I liken it to fishing in a little, hidden pond. This small pond has only one species of fish, so you learn what bait it likes. Contrast that with trawling for hours to catch as many fish as possible, even if some aren't what you want.
In the case management scenario, it's difficult to target leads because several niches could use the app. Where do your potential customers hang out? Your generic solution: No.
It's easier to join a community of Real Estate Lawyers and see if your software can answer their pain points.
My Success with Micro SaaS
In my case, my Micro SaaS apps have been my chrome extensions. Since I launched them, they've earned me an average $10k MRR, allowing me to quit my lousy full-time job years ago.
I sold my apps after scaling them for a life-changing lump amount. Since then, I've helped unfulfilled software developers escape the 9-5 through Micro SaaS.
Whether it's a profitable side hustle or a liferaft to quit their job and become their own Micro SaaS boss.
Having built my apps to the point where I could quit my job, then scaled and sold them, I feel I can share my skills with software developers worldwide.
Read my free guide on self-funded SaaS to discover more about Micro SaaS, or download your own copy. 12 chapters cover everything from Idea to Exit.
Watch my YouTube video to learn how to construct a Micro SaaS app in 10 steps.

Athirah Syamimi
3 years ago
Here's How I Built A Business Offering Unlimited Design Services in Just One Weekend.

Weekend project: limitless design service. It was fun to see whether I could start a business quickly.
I use no-code apps to save time and resources.
TL;DR I started a business utilizing EditorX for my website, Notion for client project management, and a few favors to finish my portfolio.
First step: research (Day 1)
I got this concept from a Kimp Instagram ad. The Minimalist Hustler Daily newsletter mentioned a similar and cheaper service (Graphically).
I Googled other unlimited design companies. Many provide different costs and services. Some supplied solely graphic design, web development, or copywriting.
Step 2: Brainstorming (Day 1)
I did something simple.
What benefits and services to provide
Price to charge
Since it's a one-person performance (for now), I'm focusing on graphic design. I can charge less.
So I don't overwhelm myself and can accommodate budget-conscious clientele.
Step 3: Construction (Day 1 & 2)
This project includes a management tool, a website, and a team procedure.
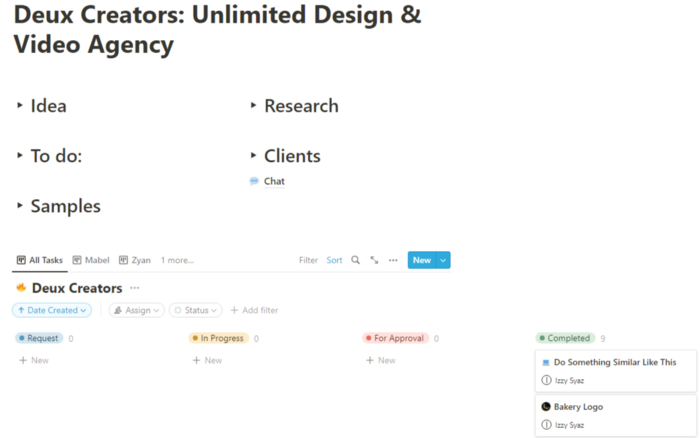
I built a project management tool and flow first. Once I had the flow and a Notion board, I tested it with design volunteers. They fake-designed while I built the website.
Tool for Project Management
I modified a Notion template. My goal is to keep clients and designers happy.
Team Approach
My sister, my partner, and I kept this business lean. I tweaked the Notion board to make the process smooth. By the end of Sunday, I’d say it’s perfect!
Website
I created the website after they finished the fake design demands. EditorX's drag-and-drop builder attracted me. I didn't need to learn code, and there are templates.
I used a template wireframe.
This project's hardest aspect is developing the site. It's my first time using EditorX and I'm no developer.
People answer all your inquiries in a large community forum.
As a first-time user developing a site in two days, I think I performed OK. Here's the site for feedback.

4th step: testing (Day 2)
Testing is frustrating because it works or doesn't. My testing day was split in two.
testing the workflow from payment to onboarding to the website
the demand being tested
It's working so far. If someone gets the trial, they can request design work.
I've gotten a couple of inquiries about demand. I’ll be working with them as a start.
Completion
Finally! I built my side project in one weekend. It's too early to tell if this is successful. I liked that I didn't squander months of resources testing out an idea.

Mircea Iosif
3 years ago
How To Start An Online Business That Will Be Profitable Without Investing A Lot Of Time

Don't know how to start an online business? Here's a guide. By following these recommendations, you can build a lucrative and profitable online business.
What Are Online Businesses Used For?
Most online businesses are websites. A self-created, self-managed website. You may sell things and services online.
To establish an internet business, you must locate a host and set up accounts with numerous companies. Once your accounts are set up, you may start publishing content and selling products or services.
How to Make Money from Your Online Business
Advertising and marketing are the best ways to make money online. You must develop strategies to contact new customers and generate leads. Make sure your website is search engine optimized so people can find you online.
Top 5 Online Business Tips for Startups:
1. Know your target audience's needs.
2. Make your website as appealing as possible.
3. Generate leads and sales with marketing.
4. Track your progress and learn from your mistakes to improve.
5. Be prepared to expand into new markets or regions.
How to Launch a Successful Online Business Without Putting in a Lot of Work
Build with a solid business model to start a profitable online business. By using these tips, you can start your online business without paying much.
First, develop a user-friendly website. You can use an internet marketing platform or create your own website. Once your website is live, optimize it for search engines and add relevant content.
Second, sell online. This can be done through ads or direct sales to website visitors. Finally, use social media to advertise your internet business. By accomplishing these things, you'll draw visitors to your website and make money.
When launching a business, invest long-term. This involves knowing your goals and how you'll pay for them. Volatility can have several effects on your business. If you offer things online, you may need to examine if the market is ready for them.
Invest wisely
Investing all your money in one endeavor can lead to too much risk and little ROI. Diversify your investments to take advantage of all available chances. So, your investments won't encounter unexpected price swings and you'll be immune to economic upheavals.
Financial news updates
When launching or running a thriving online business, financial news is crucial. By knowing current trends and upcoming developments, you can keep your business lucrative.
Keeping up with financial news can also help you avoid potential traps that could harm your bottom line. If you don't know about new legislation that could affect your industry, potential customers may choose another store when they learn about your business's problems.
Volatility ahead
You should expect volatility in the financial sector. Without a plan for coping with volatility, you could run into difficulty. If your organization relies on client input, you may not be able to exploit customer behavior shifts.
Your company could go bankrupt if you don't understand how fickle the stock market can be. By preparing for volatility, you can ensure your organization survives difficult times and market crashes.
Conclusion
Many internet businesses can be profitable. Start quickly with a few straightforward steps. Diversify your investments, follow financial news, and be prepared for volatility to develop a successful business.
Thanks for reading!
You might also like

xuanling11
3 years ago
Reddit NFT Achievement

Reddit's NFT market is alive and well.
NFT owners outnumber OpenSea on Reddit.
Reddit NFTs flip in OpenSea in days:
Fast-selling.
NFT sales will make Reddit's current communities more engaged.
I don't think NFTs will affect existing groups, but they will build hype for people to acquire them.
The first season of Collectibles is unique, but many missed the first season.
Second-season NFTs are less likely to be sold for a higher price than first-season ones.
If you use Reddit, it's fun to own NFTs.

Ari Joury, PhD
3 years ago
7 ways to turn into a major problem-solver

For some people, the glass is half empty. For others, it’s half full. And for some, the question is, How do I get this glass totally full again?
Problem-solvers are the last group. They're neutral. Pragmatists.
Problems surround them. They fix things instead of judging them. Problem-solvers improve the world wherever they go.
Some fail. Sometimes their good intentions have terrible results. Like when they try to help a grandma cross the road because she can't do it alone but discover she never wanted to.
Most programmers, software engineers, and data scientists solve problems. They use computer code to fix problems they see.
Coding is best done by understanding and solving the problem.
Despite your best intentions, building the wrong solution may have negative consequences. Helping an unwilling grandma cross the road.
How can you improve problem-solving?
1. Examine your presumptions.
Don’t think There’s a grandma, and she’s unable to cross the road. Therefore I must help her over the road. Instead think This grandma looks unable to cross the road. Let’s ask her whether she needs my help to cross it.
Maybe the grandma can’t cross the road alone, but maybe she can. You can’t tell for sure just by looking at her. It’s better to ask.
Maybe the grandma wants to cross the road. But maybe she doesn’t. It’s better to ask!
Building software is similar. Do only I find this website ugly? Who can I consult?
We all have biases, mental shortcuts, and worldviews. They simplify life.
Problem-solving requires questioning all assumptions. They might be wrong!
Think less. Ask more.
Secondly, fully comprehend the issue.
Grandma wants to cross the road? Does she want flowers from the shop across the street?
Understanding the problem advances us two steps. Instead of just watching people and their challenges, try to read their intentions.
Don't ask, How can I help grandma cross the road? Why would this grandma cross the road? What's her goal?
Understand what people want before proposing solutions.
3. Request more information. This is not a scam!
People think great problem solvers solve problems immediately. False!
Problem-solvers study problems. Understanding the problem makes solving it easy.
When you see a grandma struggling to cross the road, you want to grab her elbow and pull her over. However, a good problem solver would ask grandma what she wants. So:
Problem solver: Excuse me, ma’am? Do you wish to get over the road? Grandma: Yes indeed, young man! Thanks for asking. Problem solver: What do you want to do on the other side? Grandma: I want to buy a bouquet of flowers for my dear husband. He loves flowers! I wish the shop wasn’t across this busy road… Problem solver: Which flowers does your husband like best? Grandma: He loves red dahlia. I usually buy about 20 of them. They look so pretty in his vase at the window! Problem solver: I can get those dahlia for you quickly. Go sit on the bench over here while you’re waiting; I’ll be back in five minutes. Grandma: You would do that for me? What a generous young man you are!
A mediocre problem solver would have helped the grandma cross the road, but he might have forgotten that she needs to cross again. She must watch out for cars and protect her flowers on the way back.
A good problem solver realizes that grandma's husband wants 20 red dahlias and completes the task.
4- Rapid and intense brainstorming
Understanding a problem makes solutions easy. However, you may not have all the information needed to solve the problem.
Additionally, retrieving crucial information can be difficult.
You could start a blog. You don't know your readers' interests. You can't ask readers because you don't know who they are.
Brainstorming works here. Set a stopwatch (most smartphones have one) to ring after five minutes. In the remaining time, write down as many topics as possible.
No answer is wrong. Note everything.
Sort these topics later. Programming or data science? What might readers scroll past—are these your socks this morning?
Rank your ideas intuitively and logically. Write Medium stories using the top 35 ideas.
5 - Google it.
Doctor Google may answer this seemingly insignificant question. If you understand your problem, try googling or binging.
Someone has probably had your problem before. The problem-solver may have posted their solution online.
Use others' experiences. If you're social, ask a friend or coworker for help.
6 - Consider it later
Rest your brain.
Reread. Your brain needs rest to function.
Hustle culture encourages working 24/7. It doesn't take a neuroscientist to see that this is mental torture.
Leave an unsolvable problem. Visit friends, take a hot shower, or do whatever you enjoy outside of problem-solving.
Nap.
I get my best ideas in the morning after working on a problem. I couldn't have had these ideas last night.
Sleeping subconsciously. Leave it alone and you may be surprised by the genius it produces.
7 - Learn to live with frustration
There are problems that you’ll never solve.
Mathematicians are world-class problem-solvers. The brightest minds in history have failed to solve many mathematical problems.
A Gordian knot problem can frustrate you. You're smart!
Frustration-haters don't solve problems well. They choose simple problems to avoid frustration.
No. Great problem solvers want to solve a problem but know when to give up.
Frustration initially hurts. You adapt.
Famous last words
If you read this article, you probably solve problems. We've covered many ways to improve, so here's a summary:
Test your presumptions. Is the issue the same for everyone else when you see one? Or are your prejudices and self-judgments misguiding you?
Recognize the issue completely. On the surface, a problem may seem straightforward, but what's really going on? Try to see what the current situation might be building up to by thinking two steps ahead of the current situation.
Request more information. You are no longer a high school student. A two-sentence problem statement is not sufficient to provide a solution. Ask away if you need more details!
Think quickly and thoroughly. In a constrained amount of time, try to write down all your thoughts. All concepts are worthwhile! Later, you can order them.
Google it. There is a purpose for the internet. Use it.
Consider it later at night. A rested mind is more creative. It might seem counterintuitive to leave a problem unresolved. But while you're sleeping, your subconscious will handle the laborious tasks.
Accept annoyance as a normal part of life. Don't give up if you're feeling frustrated. It's a step in the procedure. It's also perfectly acceptable to give up on a problem because there are other, more pressing issues that need to be addressed.
You might feel stupid sometimes, but that just shows that you’re human. You care about the world and you want to make it better.
At the end of the day, that’s all there is to problem solving — making the world a little bit better.

Jano le Roux
3 years ago
The Real Reason Adobe Just Paid $20 billion for Figma
Sketch or Figma?
Designers are pissed.
The beast ate the beauty.
Figma deserves $20B.
Do designers deserve Adobe?
Adobe devours new creative tools and spits them out with a slimy Adobe aftertaste.
Frame.io — $1.3B
Magento — $1.7B
Macromedia — $3.6B
Nothing compares to the risky $20B acquisition.
If they can't be beaten, buy them.
And then make them boring.
Adobe's everywhere.
Like that friend who dabbles in everything creatively, there's not enough time to master one thing.
Figma was Adobe's thigh-mounted battle axe.
a UX design instrument with a sizable free tier.
a UX design tool with a simple and quick user interface.
a tool for fluid collaboration in user experience design.
a web-based UX design tool that functions well.
a UX design tool with a singular goal of perfection.
UX design software that replaced Adobe XD.
Adobe XD could do many of Figma's things, but it didn't focus on the details. This is a major issue when working with detail-oriented professionals.
UX designers.
Design enthusiasts first used Figma. More professionals used it. Institutions taught it. Finally, major brands adopted Figma.
Adobe hated that.
Adobe dispatched a team of lawyers to resolve the Figma issue, as big companies do. Figma didn’t bite for months.
Oh no.
Figma resisted.
Figma helped designers leave Adobe. Figma couldn't replace Photoshop, but most designers used it to remove backgrounds.
Online background removal tools improved.
The Figma problem grew into a thorn, a knife, and a battle ax in Adobe's soft inner thigh.
Figma appeared to be going public. Adobe couldn’t allow that. It bought Figma for $20B during the IPO drought.
Adobe has a new issue—investors are upset.
The actual cause of investors' ire toward Adobe
Spoiler: The math just doesn’t add up.
According to Adobe's press release, Figma's annual recurring revenue (ARR) is $400M and growing rapidly.
The $20B valuation requires a 50X revenue multiple, which is unheard of.
Venture capitalists typically use:
10% to 29% growth per year: ARR multiplied by 1 to 5
30% to 99% growth per year: ARR multiplied by 6 to 10
100% to 400% growth per year: ARR multiplied by 10 to 20
Showing an investor a 50x multiple is like telling friends you saw a UFO. They'll think you're crazy.
Adobe's stock fell immediately after the acquisition because it didn't make sense to a number-cruncher.
Designers started a Tweet storm in the digital town hall where VCs and designers often meet.
Adobe acquired Workfront for $1.5 billion at the end of 2020. This purchase made sense for investors.
Many investors missed the fact that Adobe is acquiring Figma not only for its ARR but also for its brilliant collaboration tech.
Adobe could use Figmas web app technology to make more products web-based to compete with Canva.
Figma's high-profile clients could switch to Adobe's enterprise software.
However, questions arise:
Will Adobe make Figma boring?
Will Adobe tone down Figma to boost XD?
Would you ditch Adobe and Figma for Sketch?