


More on Entrepreneurship/Creators

Sammy Abdullah
24 years ago
How to properly price SaaS
Price Intelligently put out amazing content on pricing your SaaS product. This blog's link to the whole report is worth reading. Our key takeaways are below.

Don't base prices on the competition. Competitor-based pricing has clear drawbacks. Their pricing approach is yours. Your company offers customers something unique. Otherwise, you wouldn't create it. This strategy is static, therefore you can't add value by raising prices without outpricing competitors. Look, but don't touch is the competitor-based moral. You want to know your competitors' prices so you're in the same ballpark, but they shouldn't guide your selections. Competitor-based pricing also drives down prices.
Value-based pricing wins. This is customer-based pricing. Value-based pricing looks outward, not inward or laterally at competitors. Your clients are the best source of pricing information. By valuing customer comments, you're focusing on buyers. They'll decide if your pricing and packaging are right. In addition to asking consumers about cost savings or revenue increases, look at data like number of users, usage per user, etc.
Value-based pricing increases prices. As you learn more about the client and your worth, you'll know when and how much to boost rates. Every 6 months, examine pricing.
Cloning top customers. You clone your consumers by learning as much as you can about them and then reaching out to comparable people or organizations. You can't accomplish this without knowing your customers. Segmenting and reproducing them requires as much detail as feasible. Offer pricing plans and feature packages for 4 personas. The top plan should state Contact Us. Your highest-value customers want more advice and support.
Question your 4 personas. What's the one item you can't live without? Which integrations matter most? Do you do analytics? Is support important or does your company self-solve? What's too cheap? What's too expensive?
Not everyone likes per-user pricing. SaaS organizations often default to per-user analytics. About 80% of companies utilizing per-user pricing should use an alternative value metric because their goods don't give more value with more users, so charging for them doesn't make sense.
At least 3:1 LTV/CAC. Break even on the customer within 2 years, and LTV to CAC is greater than 3:1. Because customer acquisition costs are paid upfront but SaaS revenues accrue over time, SaaS companies face an early financial shortfall while paying back the CAC.
ROI should be >20:1. Indeed. Ensure the customer's ROI is 20x the product's cost. Microsoft Office costs $80 a year, but consumers would pay much more to maintain it.
A/B Testing. A/B testing is guessing. When your pricing page varies based on assumptions, you'll upset customers. You don't have enough customers anyway. A/B testing optimizes landing pages, design decisions, and other site features when you know the problem but not pricing.
Don't discount. It cheapens the product, makes it permanent, and increases churn. By discounting, you're ruining your pricing analysis.

Navdeep Yadav
3 years ago
31 startup company models (with examples)
Many people find the internet's various business models bewildering.
This article summarizes 31 startup e-books.
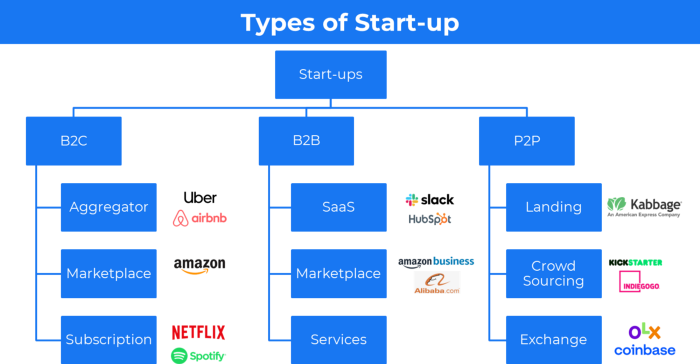
1. Using the freemium business model (free plus premium),
The freemium business model offers basic software, games, or services for free and charges for enhancements.
Examples include Slack, iCloud, and Google Drive
Provide a rudimentary, free version of your product or service to users.
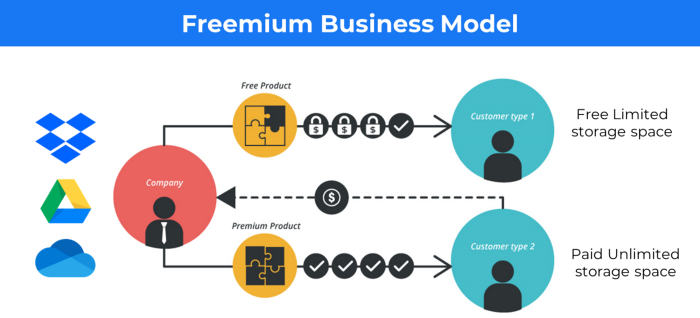
Google Drive and Dropbox offer 15GB and 2GB of free space but charge for more.
Freemium business model details (Click here)
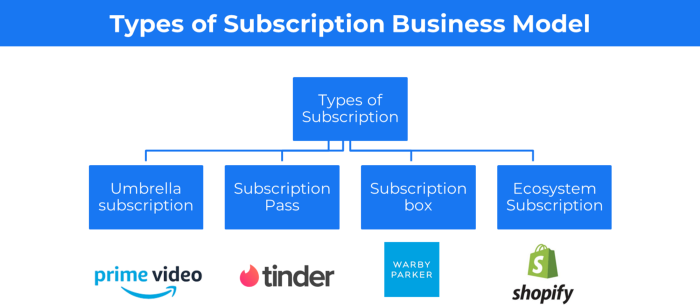
2. The Business Model of Subscription
Subscription business models sell a product or service for recurring monthly or yearly revenue.
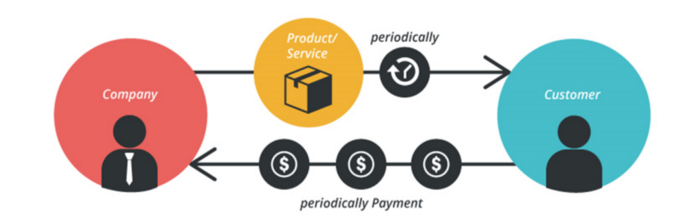
Examples: Tinder, Netflix, Shopify, etc
It's the next step to Freemium if a customer wants to pay monthly for premium features.
Subscription Business Model (Click here)
3. A market-based business strategy
It's an e-commerce site or app where third-party sellers sell products or services.
Examples are Amazon and Fiverr.
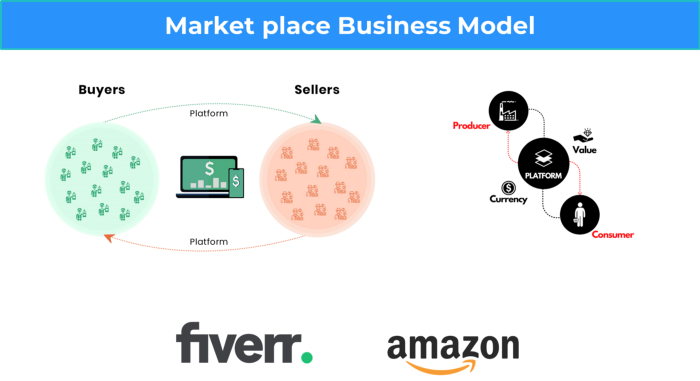
On Amazon's marketplace, a third-party vendor sells a product.
Freelancers on Fiverr offer specialized skills like graphic design.
Marketplace's business concept is explained.
4. Business plans using aggregates
In the aggregator business model, the service is branded.
Uber, Airbnb, and other examples
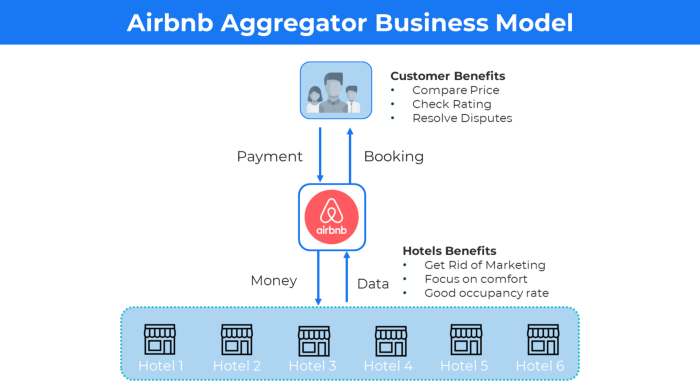
Marketplace and Aggregator business models differ.
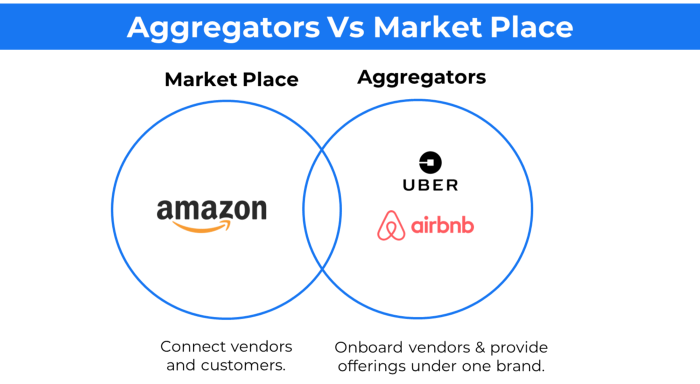
Amazon and Fiverr link merchants and customers and take a 10-20% revenue split.
Uber and Airbnb-style aggregator Join these businesses and provide their products.
5. The pay-as-you-go concept of business
This is a consumption-based pricing system. Cloud companies use it.
Example: Amazon Web Service and Google Cloud Platform (GCP) (AWS)
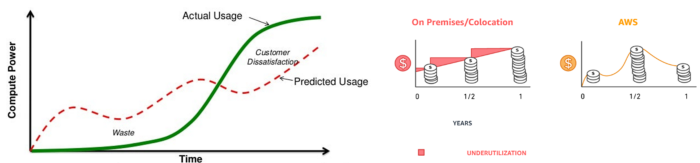
AWS, an Amazon subsidiary, offers over 200 pay-as-you-go cloud services.
“In short, the more you use the more you pay”
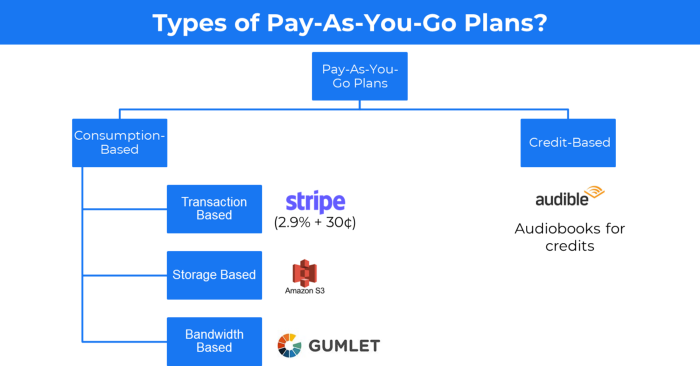
When it's difficult to divide clients into pricing levels, pay-as-you is employed.
6. The business model known as fee-for-service (FFS)
FFS charges fixed and variable fees for each successful payment.
For instance, PayU, Paypal, and Stripe
Stripe charges 2.9% + 30 per payment.
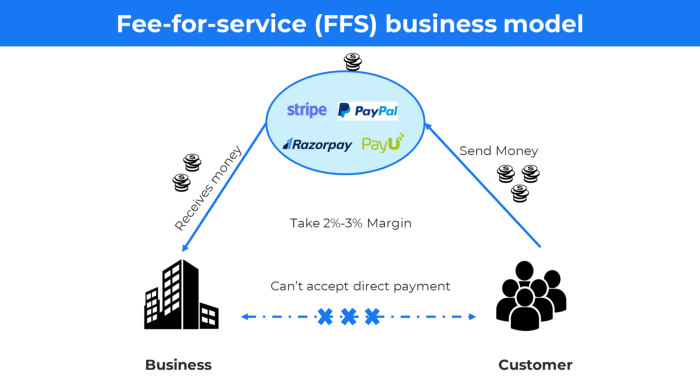
These firms offer a payment gateway to take consumer payments and deposit them to a business account.
Fintech business model
7. EdTech business strategy
In edtech, you generate money by selling material or teaching as a service.
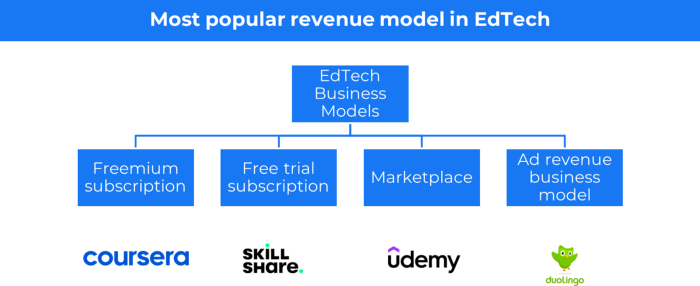
edtech business models
Freemium When course content is free but certification isn't, e.g. Coursera
FREE TRIAL SkillShare offers free trials followed by monthly or annual subscriptions.
Self-serving marketplace approach where you pick what to learn.
Ad-revenue model The company makes money by showing adverts to its huge user base.
Lock-in business strategy
Lock in prevents customers from switching to a competitor's brand or offering.
It uses switching costs or effort to transmit (soft lock-in), improved brand experience, or incentives.
Apple, SAP, and other examples
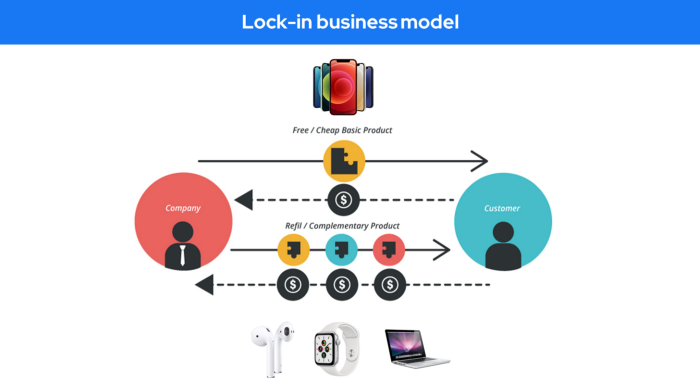
Apple offers an iPhone and then locks you in with extra hardware (Watch, Airpod) and platform services (Apple Store, Apple Music, cloud, etc.).
9. Business Model for API Licensing
APIs let third-party apps communicate with your service.
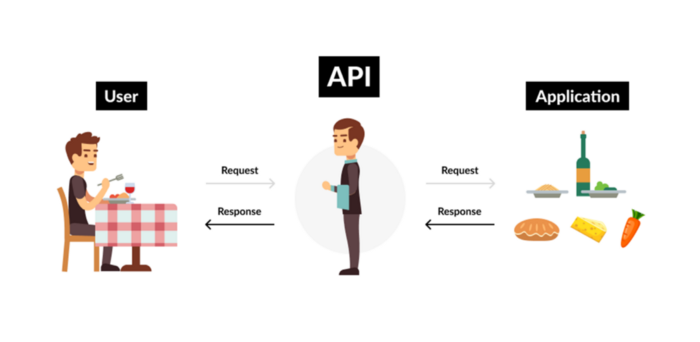
Uber and Airbnb use Google Maps APIs for app navigation.
Examples are Google Map APIs (Map), Sendgrid (Email), and Twilio (SMS).
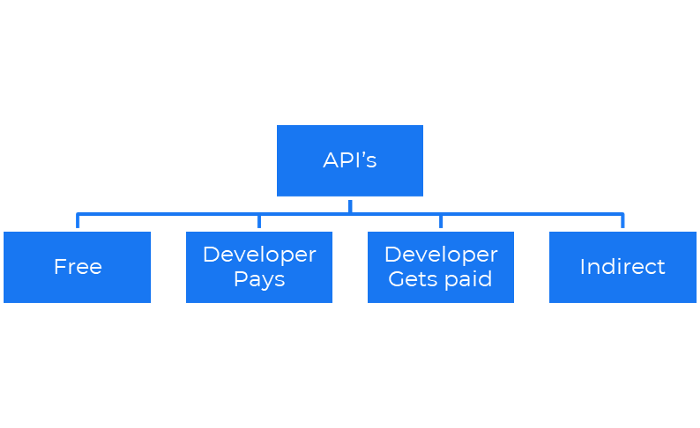
Business models for APIs
Free: The simplest API-driven business model that enables unrestricted API access for app developers. Google Translate and Facebook are two examples.
Developer Pays: Under this arrangement, service providers such as AWS, Twilio, Github, Stripe, and others must be paid by application developers.
The developer receives payment: These are the compensated content producers or developers who distribute the APIs utilizing their work. For example, Amazon affiliate programs
10. Open-source enterprise
Open-source software can be inspected, modified, and improved by anybody.
For instance, use Firefox, Java, or Android.

Google paid Mozilla $435,702 million to be their primary search engine in 2018.
Open-source software profits in six ways.
Paid assistance The Project Manager can charge for customization because he is quite knowledgeable about the codebase.
A full database solution is available as a Software as a Service (MongoDB Atlas), but there is a fee for the monitoring tool.
Open-core design R studio is a better GUI substitute for open-source applications.
sponsors of GitHub Sponsorships benefit the developers in full.
demands for paid features Earn Money By Developing Open Source Add-Ons for Current Products
Open-source business model
11. The business model for data
If the software or algorithm collects client data to improve or monetize the system.
Open AI GPT3 gets smarter with use.
Foursquare allows users to exchange check-in locations.
Later, they compiled large datasets to enable retailers like Starbucks launch new outlets.
12. Business Model Using Blockchain
Blockchain is a distributed ledger technology that allows firms to deploy smart contracts without a central authority.
Examples include Alchemy, Solana, and Ethereum.
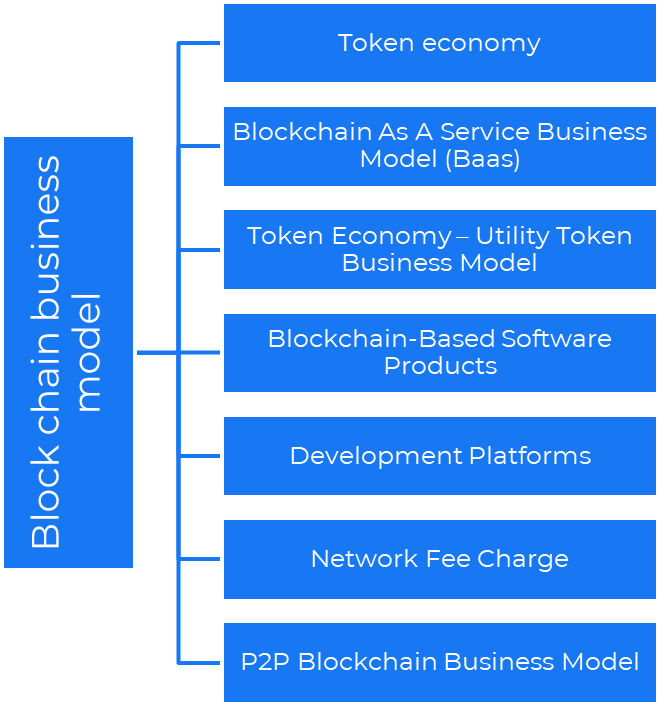
Business models using blockchain
Economy of tokens or utility When a business uses a token business model, it issues some kind of token as one of the ways to compensate token holders or miners. For instance, Solana and Ethereum
Bitcoin Cash P2P Business Model Peer-to-peer (P2P) blockchain technology permits direct communication between end users. as in IPFS
Enterprise Blockchain as a Service (Baas) BaaS focuses on offering ecosystem services similar to those offered by Amazon (AWS) and Microsoft (Azure) in the web 3 sector. Example: Ethereum Blockchain as a Service with Bitcoin (EBaaS).
Blockchain-Based Aggregators With AWS for blockchain, you can use that service by making an API call to your preferred blockchain. As an illustration, Alchemy offers nodes for many blockchains.
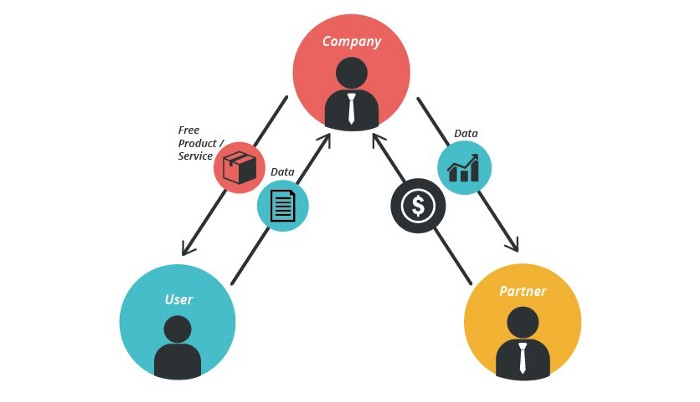
13. The free-enterprise model
In the freeterprise business model, free professional accounts are led into the funnel by the free product and later become B2B/enterprise accounts.
For instance, Slack and Zoom
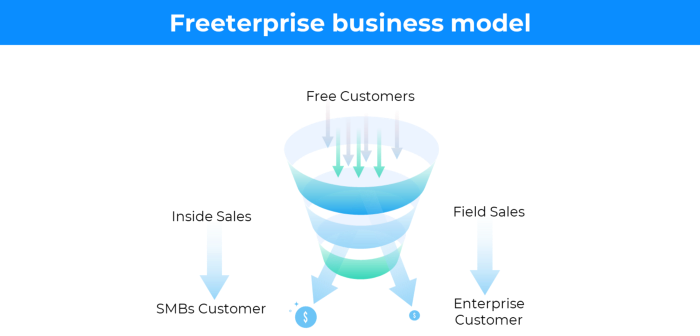
Freeterprise companies flourish through collaboration.
Start with a free professional account to build an enterprise.
14. Business plan for razor blades
It's employed in hardware where one piece is sold at a loss and profits are made through refills or add-ons.
Gillet razor & blades, coffee machine & beans, HP printer & cartridge, etc.
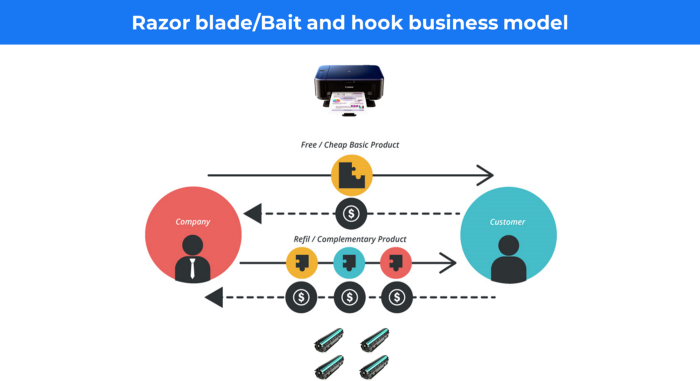
Sony sells the Playstation console at a loss but makes up for it by selling games and charging for online services.
Advantages of the Razor-Razorblade Method
lowers the risk a customer will try a product. enables buyers to test the goods and services without having to pay a high initial investment.
The product's ongoing revenue stream has the potential to generate sales that much outweigh the original investments.
Razor blade business model
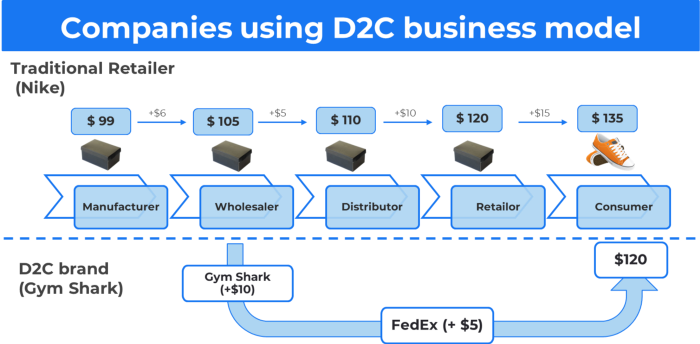
15. The business model of direct-to-consumer (D2C)
In D2C, the company sells directly to the end consumer through its website using a third-party logistic partner.
Examples include GymShark and Kylie Cosmetics.
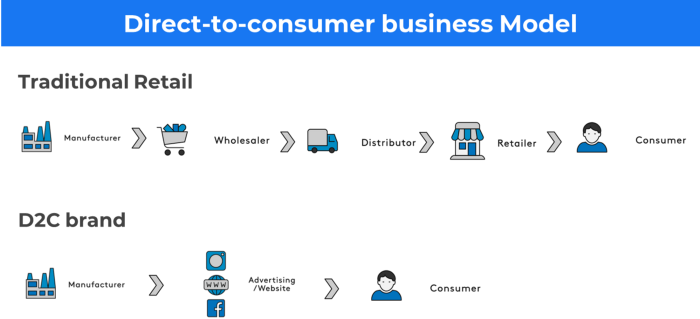
D2C brands can only expand via websites, marketplaces (Amazon, eBay), etc.
D2C benefits
Lower reliance on middlemen = greater profitability
You now have access to more precise demographic and geographic customer data.
Additional space for product testing
Increased customisation throughout your entire product line-Inventory Less
16. Business model: White Label vs. Private Label
Private label/White label products are made by a contract or third-party manufacturer.
Most amazon electronics are made in china and white-labeled.
Amazon supplements and electronics.
Contract manufacturers handle everything after brands select product quantities on design labels.
17. The franchise model
The franchisee uses the franchisor's trademark, branding, and business strategy (company).
For instance, KFC, Domino's, etc.
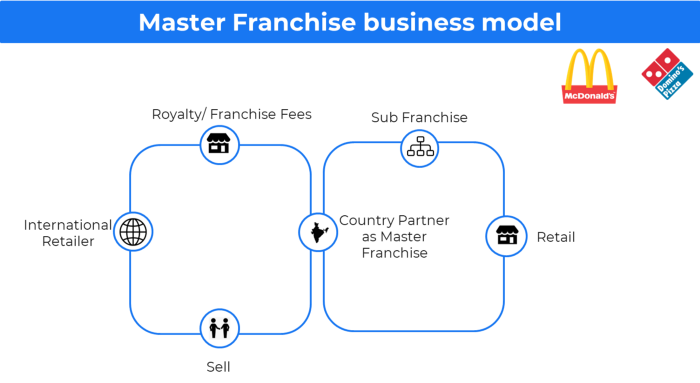
Subway, Domino, Burger King, etc. use this business strategy.
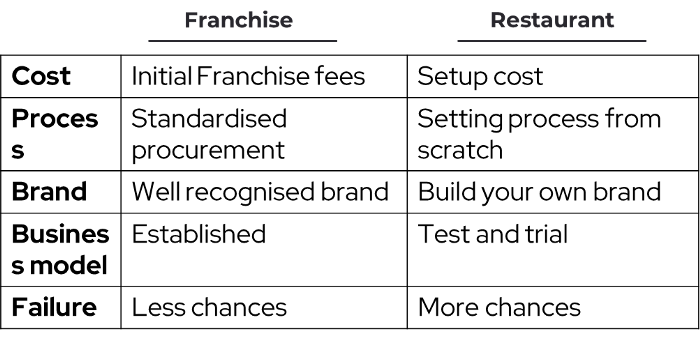
Many people pick a franchise because opening a restaurant is risky.
18. Ad-based business model
Social media and search engine giants exploit search and interest data to deliver adverts.
Google, Meta, TikTok, and Snapchat are some examples.
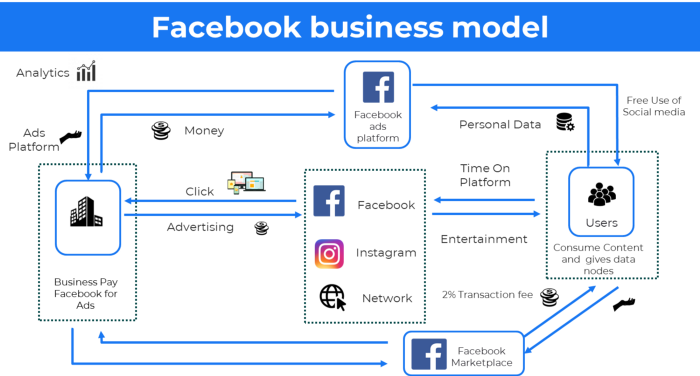
Users don't pay for the service or product given, e.g. Google users don't pay for searches.
In exchange, they collected data and hyper-personalized adverts to maximize revenue.
19. Business plan for octopuses
Each business unit functions separately but is connected to the main body.
Instance: Oyo
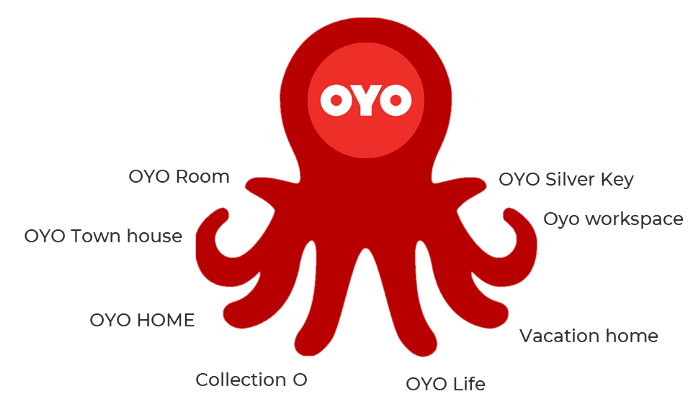
OYO is Asia's Airbnb, operating hotels, co-working, co-living, and vacation houses.
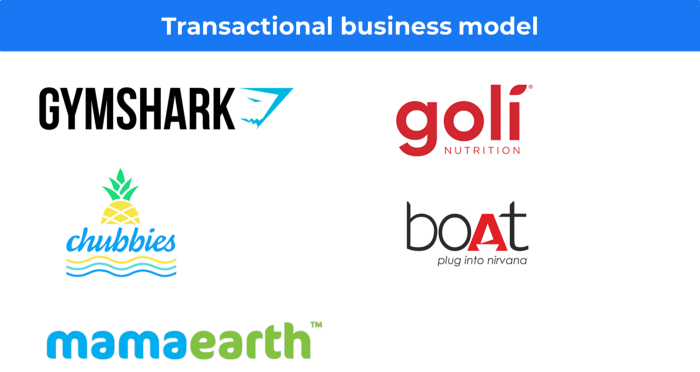
20, Transactional business model, number
Sales to customers produce revenue.
E-commerce sites and online purchases employ SSL.
Goli is an ex-GymShark.
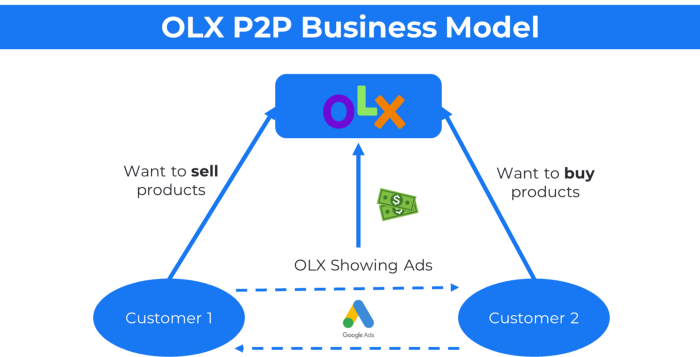
21. The peer-to-peer (P2P) business model
In P2P, two people buy and sell goods and services without a third party or platform.
Consider OLX.
22. P2P lending as a manner of operation
In P2P lending, one private individual (P2P Lender) lends/invests or borrows money from another (P2P Borrower).
Instance: Kabbage
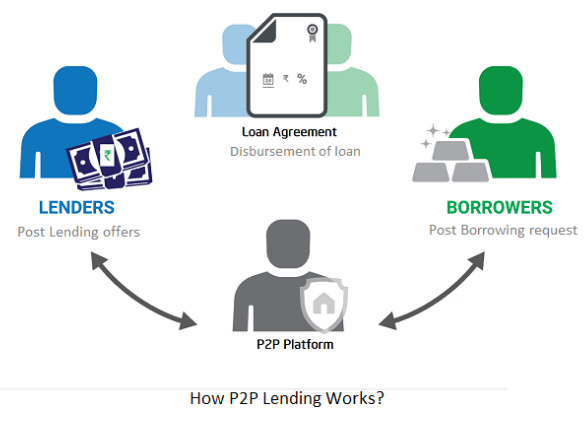
Social lending lets people lend and borrow money directly from each other without an intermediary financial institution.
23. A business model for brokers
Brokerages charge a commission or fee for their services.
Examples include eBay, Coinbase, and Robinhood.
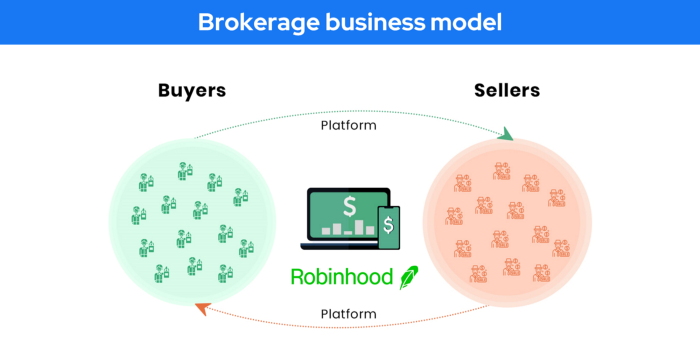
Brokerage businesses are common in Real estate, finance, and online and operate on this model.
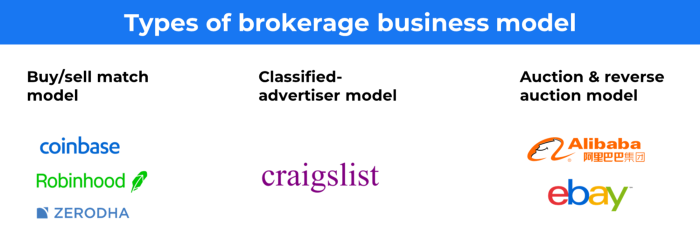
Buy/sell similar models Examples include financial brokers, insurance brokers, and others who match purchase and sell transactions and charge a commission.
These brokers charge an advertiser a fee based on the date, place, size, or type of an advertisement. This is known as the classified-advertiser model. For instance, Craiglist
24. Drop shipping as an industry
Dropshipping allows stores to sell things without holding physical inventories.
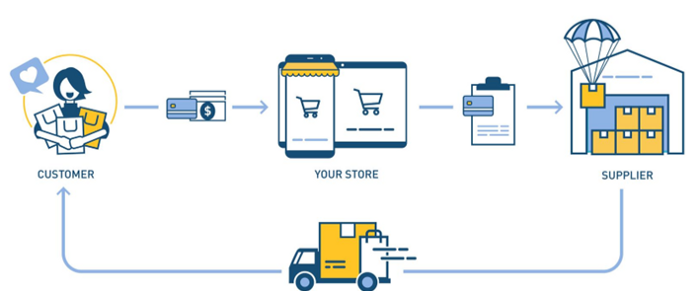
When a customer orders, use a third-party supplier and logistic partners.
Retailer product portfolio and customer experience Fulfiller The consumer places the order.
Dropshipping advantages
Less money is needed (Low overhead-No Inventory or warehousing)
Simple to start (costs under $100)
flexible work environment
New product testing is simpler
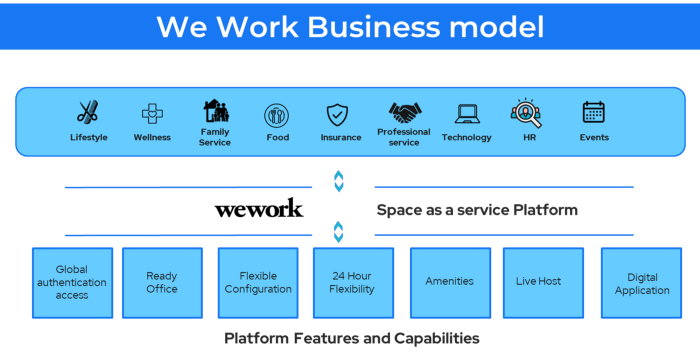
25. Business Model for Space as a Service
It's centered on a shared economy that lets millennials live or work in communal areas without ownership or lease.
Consider WeWork and Airbnb.
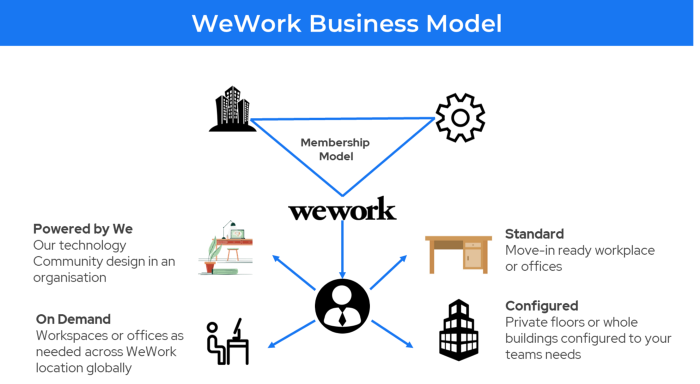
WeWork helps businesses with real estate, legal compliance, maintenance, and repair.
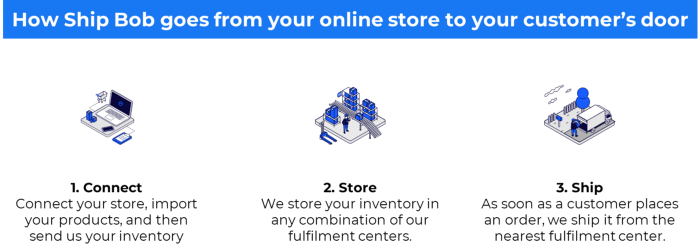
26. The business model for third-party logistics (3PL)
In 3PL, a business outsources product delivery, warehousing, and fulfillment to an external logistics company.
Examples include Ship Bob, Amazon Fulfillment, and more.

3PL partners warehouse, fulfill, and return inbound and outbound items for a charge.
Inbound logistics involves bringing products from suppliers to your warehouse.
Outbound logistics refers to a company's production line, warehouse, and customer.
27. The last-mile delivery paradigm as a commercial strategy
Last-mile delivery is the collection of supply chain actions that reach the end client.
Examples include Rappi, Gojek, and Postmates.
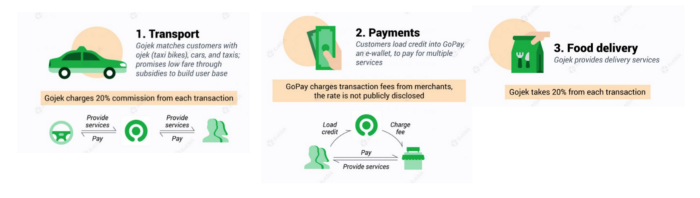
Last-mile is tied to on-demand and has a nighttime peak.
28. The use of affiliate marketing
Affiliate marketing involves promoting other companies' products and charging commissions.
Examples include Hubspot, Amazon, and Skillshare.
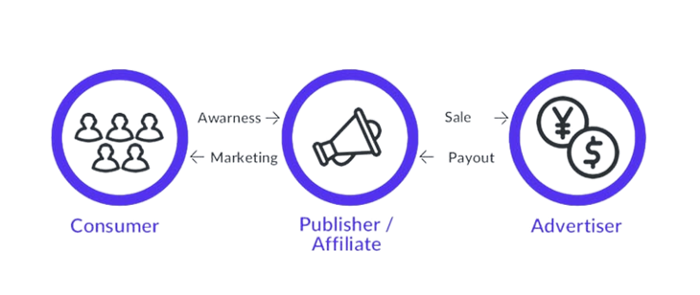
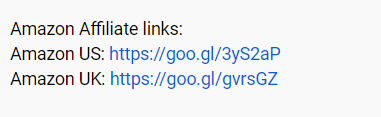
Your favorite youtube channel probably uses these short amazon links to get 5% of sales.
Affiliate marketing's benefits
In exchange for a success fee or commission, it enables numerous independent marketers to promote on its behalf.
Ensure system transparency by giving the influencers a specific tracking link and an online dashboard to view their profits.
Learn about the newest bargains and have access to promotional materials.
29. The business model for virtual goods
This is an in-app purchase for an intangible product.
Examples include PubG, Roblox, Candy Crush, etc.
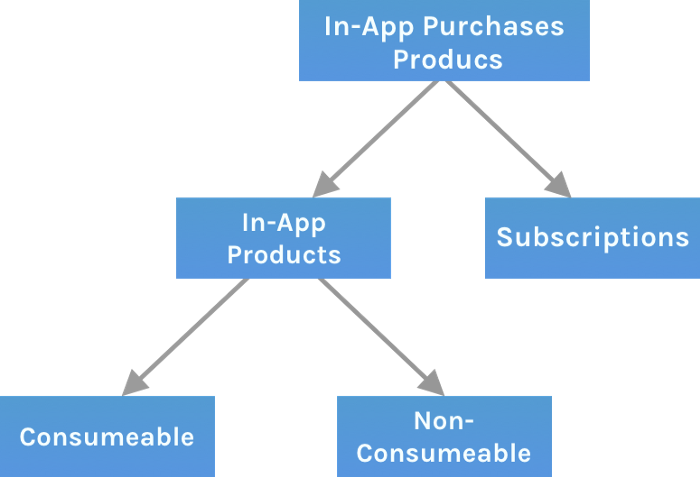
Consumables are like gaming cash that runs out. Non-consumable products provide a permanent advantage without repeated purchases.
30. Business Models for Cloud Kitchens
Ghost, Dark, Black Box, etc.
Delivery-only restaurant.
These restaurants don't provide dine-in, only delivery.
For instance, NextBite and Faasos

31. Crowdsourcing as a Business Model
Crowdsourcing = Using the crowd as a platform's source.
In crowdsourcing, you get support from people around the world without hiring them.
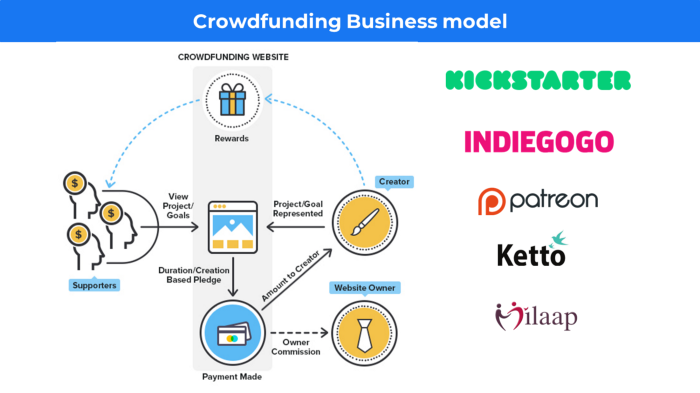
Crowdsourcing sites
Open-Source Software gives access to the software's source code so that developers can edit or enhance it. Examples include Firefox browsers and Linux operating systems.
Crowdfunding The oculus headgear would be an example of crowdfunding in essence, with no expectations.

Jenn Leach
3 years ago
In November, I made an effort to pitch 10 brands per day. Here's what I discovered.

I pitched 10 brands per workday for a total of 200.
How did I do?
It was difficult.
I've never pitched so much.
What did this challenge teach me?
the superiority of quality over quantity
When you need help, outsource
Don't disregard burnout in order to complete a challenge because it exists.
First, pitching brands for brand deals requires quality. Find firms that align with your brand to expose to your audience.
If you associate with any company, you'll lose audience loyalty. I didn't lose sight of that, but I couldn't resist finishing the task.
Outsourcing.
Delegating work to teammates is effective.
I wish I'd done it.
Three people can pitch 200 companies a month significantly faster than one.
One person does research, one to two do outreach, and one to two do follow-up and negotiating.
Simple.
In 2022, I'll outsource everything.
Burnout.
I felt this, so I slowed down at the end of the month.
Thanksgiving week in November was slow.
I was buying and decorating for Christmas. First time putting up outdoor holiday lights was fun.
Much was happening.
I'm not perfect.
I'm being honest.
The Outcomes
Less than 50 brands pitched.
Result: A deal with 3 brands.
I hoped for 4 brands with reaching out to 200 companies, so three with under 50 is wonderful.
That’s a 6% conversion rate!
Whoo-hoo!
I needed 2%.
Here's a screenshot from one of the deals I booked.
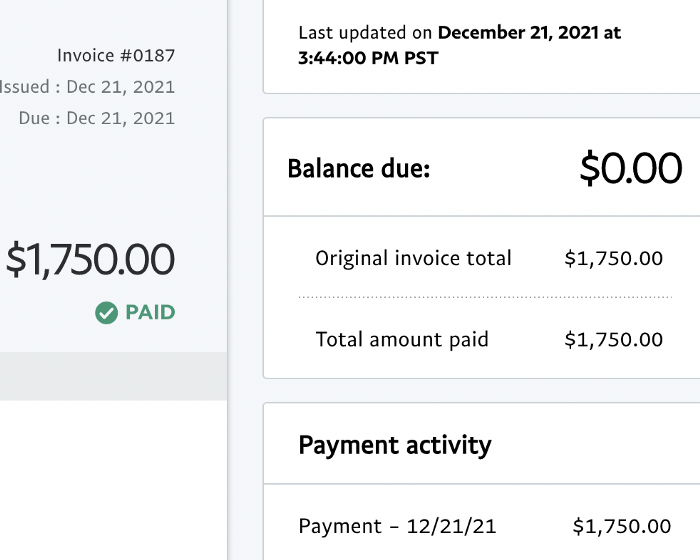
These companies fit my company well. Each campaign is different, but I've booked $2,450 in brand work with a couple of pending transactions for December and January.
$2,450 in brand work booked!
How did I do? You tell me.
Is this something you’d try yourself?
You might also like

Vishal Chawla
3 years ago
5 Bored Apes borrowed to claim $1.1 million in APE tokens
Takeaway
Unknown user took advantage of the ApeCoin airdrop to earn $1.1 million.
He used a flash loan to borrow five BAYC NFTs, claim the airdrop, and repay the NFTs.
Yuga Labs, the creators of BAYC, airdropped ApeCoin (APE) to anyone who owns one of their NFTs yesterday.
For the Bored Ape Yacht Club and Mutant Ape Yacht Club collections, the team allocated 150 million tokens, or 15% of the total ApeCoin supply, worth over $800 million. Each BAYC holder received 10,094 tokens worth $80,000 to $200,000.
But someone managed to claim the airdrop using NFTs they didn't own. They used the airdrop's specific features to carry it out. And it worked, earning them $1.1 million in ApeCoin.
The trick was that the ApeCoin airdrop wasn't based on who owned which Bored Ape at a given time. Instead, anyone with a Bored Ape at the time of the airdrop could claim it. So if you gave someone your Bored Ape and you hadn't claimed your tokens, they could claim them.
The person only needed to get hold of some Bored Apes that hadn't had their tokens claimed to claim the airdrop. They could be returned immediately.
So, what happened?
The person found a vault with five Bored Ape NFTs that hadn't been used to claim the airdrop.
A vault tokenizes an NFT or a group of NFTs. You put a bunch of NFTs in a vault and make a token. This token can then be staked for rewards or sold (representing part of the value of the collection of NFTs). Anyone with enough tokens can exchange them for NFTs.
This vault uses the NFTX protocol. In total, it contained five Bored Apes: #7594, #8214, #9915, #8167, and #4755. Nobody had claimed the airdrop because the NFTs were locked up in the vault and not controlled by anyone.
The person wanted to unlock the NFTs to claim the airdrop but didn't want to buy them outright s o they used a flash loan, a common tool for large DeFi hacks. Flash loans are a low-cost way to borrow large amounts of crypto that are repaid in the same transaction and block (meaning that the funds are never at risk of not being repaid).
With a flash loan of under $300,000 they bought a Bored Ape on NFT marketplace OpenSea. A large amount of the vault's token was then purchased, allowing them to redeem the five NFTs. The NFTs were used to claim the airdrop, before being returned, the tokens sold back, and the loan repaid.
During this process, they claimed 60,564 ApeCoin airdrops. They then sold them on Uniswap for 399 ETH ($1.1 million). Then they returned the Bored Ape NFT used as collateral to the same NFTX vault.
Attack or arbitrage?
However, security firm BlockSecTeam disagreed with many social media commentators. A flaw in the airdrop-claiming mechanism was exploited, it said.
According to BlockSecTeam's analysis, the user took advantage of a "vulnerability" in the airdrop.
"We suspect a hack due to a flaw in the airdrop mechanism. The attacker exploited this vulnerability to profit from the airdrop claim" said BlockSecTeam.
For example, the airdrop could have taken into account how long a person owned the NFT before claiming the reward.
Because Yuga Labs didn't take a snapshot, anyone could buy the NFT in real time and claim it. This is probably why BAYC sales exploded so soon after the airdrop announcement.

Protos
3 years ago
StableGains lost $42M in Anchor Protocol.
StableGains lost millions of dollars in customer funds in Anchor Protocol without telling its users. The Anchor Protocol offered depositors 19-20% APY before its parent ecosystem, Terra LUNA, lost tens of billions of dollars in market capitalization as LUNA fell below $0.01 and its stablecoin (UST) collapsed.
A Terra Research Forum member raised the alarm. StableGains changed its homepage and Terms and Conditions to reflect how it mitigates risk, a tacit admission that it should have done so from the start.
StableGains raised $600,000 in YCombinator's W22 batch. Moonfire, Broom Ventures, and Goodwater Capital invested $3 million more.
StableGains' 15% yield product attracted $42 million in deposits. StableGains kept most of its deposits in Anchor's UST pool earning 19-20% APY, kept one-quarter of the interest as a management fee, and then gave customers their promised 15% APY. It lost almost all customer funds when UST melted down. It changed withdrawal times, hurting customers.
- StableGains said de-pegging was unlikely. According to its website, 1 UST can be bought and sold for $1 of LUNA. LUNA became worthless, and Terra shut down its blockchain.
- It promised to diversify assets across several stablecoins to reduce the risk of one losing its $1 peg, but instead kept almost all of them in one basket.
- StableGains promised withdrawals in three business days, even if a stablecoin needed time to regain its peg. StableGains uses Coinbase for deposits and withdrawals, and customers receive the exact amount of USDC requested.
StableGains scrubs its website squeaky clean
StableGains later edited its website to say it only uses the "most trusted and tested stablecoins" and extended withdrawal times from three days to indefinite time "in extreme cases."
Previously, USDC, TerraUST (UST), and Dai were used (DAI). StableGains changed UST-related website content after the meltdown. It also removed most references to DAI.
Customers noticed a new clause in the Terms and Conditions denying StableGains liability for withdrawal losses. This new clause would have required customers to agree not to sue before withdrawing funds, avoiding a class-action lawsuit.
Customers must sign a waiver to receive a refund.
Erickson Kramer & Osborne law firm has asked StableGains to preserve all internal documents on customer accounts, marketing, and TerraUSD communications. The firm has not yet filed a lawsuit.
Thousands of StableGains customers lost an estimated $42 million.
Celsius Network customers also affected
CEL used Terra LUNA's Anchor Protocol. Celsius users lost money in the crypto market crash and UST meltdown. Many held CEL and LUNA as yielding deposits.
CEO Alex Mashinsky accused "unknown malefactors" of targeting Celsius Network without evidence. Celsius has not publicly investigated this claim as of this article's publication.
CEL fell before UST de-pegged. On June 2, 2021, it reached $8.01. May 19's close: $0.82.
When some Celsius Network users threatened to leave over token losses, Mashinsky replied, "Leave if you don't think I'm sincere and working harder than you, seven days a week."
Celsius Network withdrew $500 million from Anchor Protocol, but smaller holders had trouble.
Read original article here

Recep İnanç
3 years ago
Effective Technical Book Reading Techniques

Technical books aren't like novels. We need a new approach to technical texts. I've spent years looking for a decent reading method. I tried numerous ways before finding one that worked. This post explains how I read technical books efficiently.
What Do I Mean When I Say Effective?
Effectiveness depends on the book. Effective implies I know where to find answers after reading a reference book. Effective implies I learned the book's knowledge after reading it.
I use reference books as tools in my toolkit. I won't carry all my tools; I'll merely need them. Non-reference books teach me techniques. I never have to make an effort to use them since I always have them.
Reference books I like:
Design Patterns: Elements of Reusable Object-Oriented Software
Refactoring: Improving the Design of Existing Code
You can also check My Top Takeaways from Refactoring here.
Non-reference books I like:
The Approach
Technical books might be overwhelming to read in one sitting. Especially when you have no idea what is coming next as you read. When you don't know how deep the rabbit hole goes, you feel lost as you read. This is my years-long method for overcoming this difficulty.
Whether you follow the step-by-step guide or not, remember these:
Understand the terminology. Make sure you get the meaning of any terms you come across more than once. The likelihood that a term will be significant increases as you encounter it more frequently.
Know when to stop. I've always believed that in order to truly comprehend something, I must delve as deeply as possible into it. That, however, is not usually very effective. There are moments when you have to draw the line and start putting theory into practice (if applicable).
Look over your notes. When reading technical books or documents, taking notes is a crucial habit to develop. Additionally, you must regularly examine your notes if you want to get the most out of them. This will assist you in internalizing the lessons you acquired from the book. And you'll see that the urge to review reduces with time.
Let's talk about how I read a technical book step by step.
0. Read the Foreword/Preface
These sections are crucial in technical books. They answer Who should read it, What each chapter discusses, and sometimes How to Read? This is helpful before reading the book. Who could know the ideal way to read the book better than the author, right?
1. Scanning
I scan the chapter. Fast scanning is needed.
I review the headings.
I scan the pictures quickly.
I assess the chapter's length to determine whether I might divide it into more manageable sections.
2. Skimming
Skimming is faster than reading but slower than scanning.
I focus more on the captions and subtitles for the photographs.
I read each paragraph's opening and closing sentences.
I examined the code samples.
I attempt to grasp each section's basic points without getting bogged down in the specifics.
Throughout the entire reading period, I make an effort to make mental notes of what may require additional attention and what may not. Because I don't want to spend time taking physical notes, kindly notice that I am using the term "mental" here. It is much simpler to recall. You may think that this is more significant than typing or writing “Pay attention to X.”
I move on quickly. This is something I considered crucial because, when trying to skim, it is simple to start reading the entire thing.
3. Complete reading
Previous steps pay off.
I finished reading the chapter.
I concentrate on the passages that I mentally underlined when skimming.
I put the book away and make my own notes. It is typically more difficult than it seems for me. But it's important to speak in your own words. You must choose the right words to adequately summarize what you have read. How do those words make you feel? Additionally, you must be able to summarize your notes while you are taking them. Sometimes as I'm writing my notes, I realize I have no words to convey what I'm thinking or, even worse, I start to doubt what I'm writing down. This is a good indication that I haven't internalized that idea thoroughly enough.
I jot my inquiries down. Normally, I read on while compiling my questions in the hopes that I will learn the answers as I read. I'll explore those issues more if I wasn't able to find the answers to my inquiries while reading the book.
Bonus!
Best part: If you take lovely notes like I do, you can publish them as a blog post with a few tweaks.
Conclusion
This is my learning journey. I wanted to show you. This post may help someone with a similar learning style. You can alter the principles above for any technical material.