


More on Entrepreneurship/Creators

Stephen Moore
3 years ago
Adam Neumanns is working to create the future of living in a classic example of a guy failing upward.
The comeback tour continues…
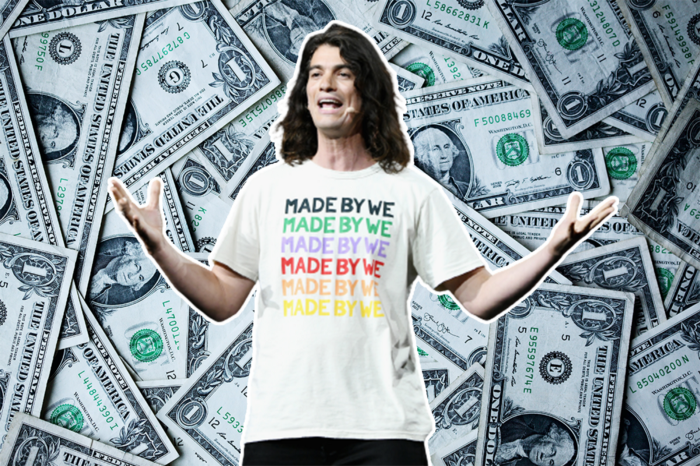
First, he founded a $47 billion co-working company (sorry, a “tech company”).
He established WeLive to disrupt apartment life.
Then he created WeGrow, a school that tossed aside the usual curriculum to feed children's souls and release their potential.
He raised the world’s consciousness.
Then he blew it all up (without raising the world’s consciousness). (He bought a wave pool.)
Adam Neumann's WeWork business burned investors' money. The founder sailed off with unimaginable riches, leaving long-time employees with worthless stocks and the company bleeding money. His track record, which includes a failing baby clothing company, should have stopped investors cold.
Once the dust settled, folks went on. We forgot about the Neumanns! We forgot about the private jets, company retreats, many houses, and WeWork's crippling. In that moment, the prodigal son of entrepreneurship returned, choosing the blockchain as his industry. His homecoming tour began with Flowcarbon, which sold Goddess Nature Tokens to lessen companies' carbon footprints.
Did it work?
Of course not.
Despite receiving $70 million from Andreessen Horowitz's a16z, the project has been halted just two months after its announcement.
This triumph should lower his grade.
Neumann seems to have moved on and has another revolutionary idea for the future of living. Flow (not Flowcarbon) aims to help people live in flow and will launch in 2023. It's the classic Neumann pitch: lofty goals, yogababble, and charisma to attract investors.
It's a winning formula for one investment fund. a16z has backed the project with its largest single check, $350 million. It has a splash page and 3,000 rental units, but is valued at over $1 billion. The blog post praised Neumann for reimagining the office and leading a paradigm-shifting global company.

Flow's mission is to solve the nation's housing crisis. How? Idk. It involves offering community-centric services in apartment properties to the same remote workforce he once wooed with free beer and a pingpong table. Revolutionary! It seems the goal is to apply WeWork's goals of transforming physical spaces and building community to apartments to solve many of today's housing problems.
The elevator pitch probably sounded great.
At least a16z knows it's a near-impossible task, calling it a seismic shift. Marc Andreessen opposes affordable housing in his wealthy Silicon Valley town. As details of the project emerge, more investors will likely throw ethics and morals out the window to go with the flow, throwing money at a man known for burning through it while building toxic companies, hoping he can bank another fantasy valuation before it all crashes.
Insanity is repeating the same action and expecting a different result. Everyone on the Neumann hype train needs to sober up.
Like WeWork, this venture Won’tWork.
Like before, it'll cause a shitstorm.

Greg Lim
3 years ago
How I made $160,000 from non-fiction books
I've sold over 40,000 non-fiction books on Amazon and made over $160,000 in six years while writing on the side.
I have a full-time job and three young sons; I can't spend 40 hours a week writing. This article describes my journey.
I write mainly tech books:
Thanks to my readers, many wrote positive evaluations. Several are bestsellers.
A few have been adopted by universities as textbooks:
My books' passive income allows me more time with my family.
Knowing I could quit my job and write full time gave me more confidence. And I find purpose in my work (i am in christian ministry).
I'm always eager to write. When work is a dread or something bad happens, writing gives me energy. Writing isn't scary. In fact, I can’t stop myself from writing!
Writing has also established my tech authority. Universities use my books, as I've said. Traditional publishers have asked me to write books.
These mindsets helped me become a successful nonfiction author:
1. You don’t have to be an Authority
Yes, I have computer science experience. But I'm no expert on my topics. Before authoring "Beginning Node.js, Express & MongoDB," my most profitable book, I had no experience with those topics. Node was a new server-side technology for me. Would that stop me from writing a book? It can. I liked learning a new technology. So I read the top three Node books, took the top online courses, and put them into my own book (which makes me know more than 90 percent of people already).
I didn't have to worry about using too much jargon because I was learning as I wrote. An expert forgets a beginner's hardship.
"The fellow learner can aid more than the master since he knows less," says C.S. Lewis. The problem he must explain is recent. The expert has forgotten.”
2. Solve a micro-problem (Niching down)
I didn't set out to write a definitive handbook. I found a market with several challenges and wrote one book. Ex:
- Instead of web development, what about web development using Angular?
- Instead of Blockchain, what about Blockchain using Solidity and React?
- Instead of cooking recipes, how about a recipe for a specific kind of diet?
- Instead of Learning math, what about Learning Singapore Math?
3. Piggy Backing Trends
The above topics may still be a competitive market. E.g. Angular, React. To stand out, include the latest technologies or trends in your book. Learn iOS 15 instead of iOS programming. Instead of personal finance, what about personal finance with NFTs.
Even though you're a newbie author, your topic is well-known.
4. Publish short books
My books are known for being direct. Many people like this:
Your reader will appreciate you cutting out the fluff and getting to the good stuff. A reader can finish and review your book.
Second, short books are easier to write. Instead of creating a 500-page book for $50 (which few will buy), write a 100-page book that answers a subset of the problem and sell it for less. (You make less, but that's another subject). At least it got published instead of languishing. Less time spent creating a book means less time wasted if it fails. Write a small-bets book portfolio like Daniel Vassallo!
Third, it's $2.99-$9.99 on Amazon (gets 70 percent royalties for ebooks). Anything less receives 35% royalties. $9.99 books have 20,000–30,000 words. If you write more and charge more over $9.99, you get 35% royalties. Why not make it a $9.99 book?
(This is the ebook version.) Paperbacks cost more. Higher royalties allow for higher prices.
5. Validate book idea
Amazon will tell you if your book concept, title, and related phrases are popular. See? Check its best-sellers list.
150,000 is preferable. It sells 2–3 copies daily. Consider your rivals. Profitable niches have high demand and low competition.
Don't be afraid of competitive niches. First, it shows high demand. Secondly, what are the ways you can undercut the completion? Better book? Or cheaper option? There was lots of competition in my NodeJS book's area. None received 4.5 stars or more. I wrote a NodeJS book. Today, it's a best-selling Node book.
What’s Next
So long. Part II follows. Meanwhile, I will continue to write more books!
Follow my journey on Twitter.
This post is a summary. Read full article here

ʟ ᴜ ᴄ ʏ
3 years ago
The Untapped Gold Mine of Inspiration and Startup Ideas
I joined the 1000 Digital Startups Movement (Gerakan 1000 Startup Digital) in 2017 and learned a lot about the startup sector. My previous essay outlined what a startup is and what must be prepared. Here I'll offer raw ideas for better products.

Intro
A good startup solves a problem. These can include environmental, economic, energy, transportation, logistics, maritime, forestry, livestock, education, tourism, legal, arts and culture, communication, and information challenges. Everything I wrote is simply a basic idea (as inspiration) and requires more mapping and validation. Learn how to construct a startup to maximize launch success.
Adrian Gunadi (Investree Co-Founder) taught me that a Founder or Co-Founder must be willing to be CEO (Chief Everything Officer). Everything is independent, including drafting a proposal, managing finances, and scheduling appointments. The best individuals will come to you if you're the best. It's easier than consulting Andy Zain (Kejora Capital Founder).
Description
To help better understanding from your idea, try to answer this following questions:
- Describe your idea/application
Maximum 1000 characters.
- Background
Explain the reasons that prompted you to realize the idea/application.
- Objective
Explain the expected goals of the creation of the idea/application.
- Solution
A solution that tells your idea can be the right solution for the problem at hand.
- Uniqueness
What makes your idea/app unique?
- Market share
Who are the people who need and are looking for your idea?
- Marketing Ways and Business Models
What is the best way to sell your idea and what is the business model?
Not everything here is a startup idea. It's meant to inspire creativity and new perspectives.
Ideas
#Application
1. Medical students can operate on patients or not. Applications that train prospective doctors to distinguish body organs and their placement are useful. In the advanced stage, the app can be built with numerous approaches so future doctors can practice operating on patients based on their ailments. If they made a mistake, they'd start over. Future doctors will be more assured and make fewer mistakes this way.
2. VR (virtual reality) technology lets people see 3D space from afar. Later, similar technology was utilized to digitally sell properties, so buyers could see the inside and room contents. Every gadget has flaws. It's like a gold mine for robbers. VR can let prospective students see a campus's facilities. This facility can also help hotels promote their products.
3. How can retail entrepreneurs maximize sales? Most popular goods' sales data. By using product and brand/type sales figures, entrepreneurs can avoid overstocking. Walmart computerized their procedures to track products from the manufacturer to the store. As Retail Link products sell out, suppliers can immediately step in.
4. Failing to marry is something to be avoided. But if it had to happen, the loss would be like the proverb “rub salt into the wound”. On the I do Now I dont website, Americans who don't marry can resell their jewelry to other brides-to-be. If some want to cancel the wedding and receive their down money and dress back, others want a wedding with particular criteria, such as a quick date and the expected building. Create a DP takeover marketplace for both sides.
#Games
1. Like in the movie, players must exit the maze they enter within 3 minutes or the shape will change, requiring them to change their strategy. The maze's transformation time will shorten after a few stages.
2. Treasure hunts involve following clues to uncover hidden goods. Here, numerous sponsors are combined in one boat, and participants can choose a game based on the prizes. Let's say X-mart is a sponsor and provides riddles or puzzles to uncover the prize in their store. After gathering enough points, the player can trade them for a gift utilizing GPS and AR (augmented reality). Players can collaborate to increase their chances of success.
3. Where's Wally? Where’s Wally displays a thick image with several things and various Wally-like characters. We must find the actual Wally, his companions, and the desired object. Make a game with a map where players must find objects for the next level. The player must find 5 artifacts randomly placed in an Egyptian-style mansion, for example. In the room, there are standard tickets, pass tickets, and gold tickets that can be removed for safekeeping, as well as a wall-mounted carpet that can be stored but not searched and turns out to be a flying rug that can be used to cross/jump to a different place. Regular tickets are spread out since they can buy life or stuff. At a higher level, a black ticket can lower your ordinary ticket. Objects can explode, scattering previously acquired stuff. If a player runs out of time, they can exchange a ticket for more.
#TVprogram
1. At the airport there are various visitors who come with different purposes. Asking tourists to live for 1 or 2 days in the city will be intriguing to witness.
2. Many professions exist. Carpenters, cooks, and lawyers must have known about job desks. Does HRD (Human Resource Development) only recruit new employees? Many don't know how to become a CEO, CMO, COO, CFO, or CTO. Showing young people what a Program Officer in an NGO does can help them choose a career.
#StampsCreations
Philatelists know that only the government can issue stamps. I hope stamps are creative so they have more worth.
1. Thermochromic pigments (leuco dyes) are well-known for their distinctive properties. By putting pigments to black and white batik stamps, for example, the black color will be translucent and display the basic color when touched (at a hot temperature).
2. In 2012, Liechtenstein Post published a laser-art Chinese zodiac stamp. Belgium (Bruges Market Square 2012), Taiwan (Swallow Tail Butterfly 2009), etc. Why not make a stencil of the president or king/queen?
3. Each country needs its unique identity, like Taiwan's silk and bamboo stamps. Create from your country's history. Using traditional paper like washi (Japan), hanji (Korea), and daluang/saeh (Indonesia) can introduce a country's culture.
4. Garbage has long been a problem. Bagasse, banana fronds, or corn husks can be used as stamp material.
5. Austria Post published a stamp containing meteor dust in 2006. 2004 meteorite found in Morocco produced the dust. Gibraltar's Rock of Gilbraltar appeared on stamps in 2002. What's so great about your country? East Java is muddy (Lapindo mud). Lapindo mud stamps will be popular. Red sand at Pink Beach, East Nusa Tenggara, could replace the mud.
#PostcardCreations
1. Map postcards are popular because they make searching easier. Combining laser-cut road map patterns with perforated 200-gram paper glued on 400-gram paper as a writing medium. Vision-impaired people can use laser-cut maps.
2. Regional art can be promoted by tucking traditional textiles into postcards.
3. A thin canvas or plain paper on the card's front allows the giver to be creative.
4. What is local crop residue? Cork lids, maize husks, and rice husks can be recycled into postcard materials.
5. Have you seen a dried-flower bookmark? Cover the postcard with mica and add dried flowers. If you're worried about losing the flowers, you can glue them or make a postcard envelope.
6. Wood may be ubiquitous; try a 0.2-mm copper plate engraved with an image and connected to a postcard as a writing medium.
7. Utilized paper pulp can be used to hold eggs, smartphones, and food. Form a smooth paper pulp on the plate with the desired image, the Golden Gate bridge, and paste it on your card.
8. Postcards can promote perfume. When customers rub their hands on the card with the perfume image, they'll smell the aroma.
#Tour #Travel
Tourism activities can be tailored to tourists' interests or needs. Each tourist benefits from tourism's distinct aim.
Let's define tourism's objective and purpose.
Holiday Tour is a tour that its participants plan and do in order to relax, have fun, and amuse themselves.
A familiarization tour is a journey designed to help travelers learn more about (survey) locales connected to their line of work.
An educational tour is one that aims to give visitors knowledge of the field of work they are visiting or an overview of it.
A scientific field is investigated and knowledge gained as the major goal of a scientific tour.
A pilgrimage tour is one designed to engage in acts of worship.
A special mission tour is one that has a specific goal, such a commerce mission or an artistic endeavor.
A hunting tour is a destination for tourists that plans organized animal hunting that is only allowed by local authorities for entertainment purposes.
Every part of life has tourism potential. Activities include:
1. Those who desire to volunteer can benefit from the humanitarian theme and collaboration with NGOs. This activity's profit isn't huge but consider the environmental impact.
2. Want to escape the city? Meditation travel can help. Beautiful spots around the globe can help people forget their concerns. A certified yoga/meditation teacher can help travelers release bad energy.
3. Any prison visitors? Some prisons, like those for minors under 17, are open to visitors. This type of tourism helps mental convicts reach a brighter future.
4. Who has taken a factory tour/study tour? Outside-of-school study tour (for ordinary people who have finished their studies). Not everyone in school could tour industries, workplaces, or embassies to learn and be inspired. Shoyeido (an incense maker) and Royce (a chocolate maker) offer factory tours in Japan.
5. Develop educational tourism like astronomy and archaeology. Until now, only a few astronomy enthusiasts have promoted astronomy tourism. In Indonesia, archaeology activities focus on site preservation, and to participate, office staff must undertake a series of training (not everyone can take a sabbatical from their routine). Archaeological tourist activities are limited, whether held by history and culture enthusiasts or in regional tours.
6. Have you ever longed to observe a film being made or your favorite musician rehearsing? Such tours can motivate young people to pursue entertainment careers.
7. Pamper your pets to reduce stress. Many pet owners don't have time for walks or treats. These premium services target the wealthy.
8. A quirky idea to provide tours for imaginary couples or things. Some people marry inanimate objects or animals and seek to make their lover happy; others cherish their ashes after death.
#MISCideas
1. Fashion is a lifestyle, thus people often seek fresh materials. Chicken claws, geckos, snake skin casings, mice, bats, and fish skins are also used. Needs some improvement, definitely.
2. As fuel supplies become scarcer, people hunt for other energy sources. Sound is an underutilized renewable energy. The Batechsant technology converts environmental noise into electrical energy, according to study (Battery Technology Of Sound Power Plant). South Korean researchers use Sound-Driven Piezoelectric Nanowire based on Nanogenerators to recharge cell phone batteries. The Batechsant system uses existing noise levels to provide electricity for street lamp lights, aviation, and ships. Using waterfall sound can also energize hard-to-reach locations.
3. A New York Times reporter said IQ doesn't ensure success. Our school system prioritizes IQ above EQ (Emotional Quotient). EQ is a sort of human intelligence that allows a person to perceive and analyze the dynamics of his emotions when interacting with others (and with himself). EQ is suspected of being a bigger source of success than IQ. EQ training can gain greater attention to help people succeed. Prioritize role models from school stakeholders, teachers, and parents to improve children' EQ.
4. Teaching focuses more on theory than practice, so students are less eager to explore and easily forget if they don't pay attention. Has an engineer ever made bricks from arid red soil? Morocco's non-college-educated builders can create weatherproof bricks from red soil without equipment. Can mechanical engineering grads create a water pump to solve water shortages in remote areas? Art graduates can innovate beyond only painting. Artists may create kinetic sculpture by experimenting so much. Young people should understand these sciences so they can be more creative with their potential. These might be extracurricular activities in high school and university.
5. People have been trying to recycle agricultural waste for a long time. Mycelium helps replace light, easily crushed tiles and bricks (a collection of hyphae like in the manufacture of tempe). Waste must contain lignocellulose. In this vein, anti-mainstream painting canvases can be made. The goal is to create the canvas uneven like an amoeba outline, not square or spherical. The resulting canvas is lightweight and needs no frame. Then what? Open source your idea like Precious Plastic to establish a community. By propagating this notion, many knowledgeable people will help improve your product's quality and impact.
6. As technology and humans adapt, fraud increases. Making phony doctor's letters to fool superiors, fake credentials to get hired, fraudulent land certificates to make money, and fake news (hoax). The existence of a Wikimedia can aid the community by comparing bogus and original information.
7. Do you often hit a problem-solving impasse? Since the Doraemon bag hasn't been made, construct an Idea Bank. Everyone can contribute to solving problems here. How do you recruit volunteers? Obviously, a reward is needed. Contributors can become moderators or gain complimentary tickets to TIA (Tech in Asia) conferences. Idea Bank-related concepts: the rise of startups without a solid foundation generates an age as old as corn that does not continue. Those with startup ideas should describe them here so they can be validated by other users. Other users can contribute input if a comparable notion is produced to improve the product or integrate it. Similar-minded users can become Co-Founders.
8. Why not invest in fruit/vegetables, inspired by digital farming? The landowner obtains free fruit without spending much money on maintenance. Investors can get fruits/vegetables in larger quantities, fresher, and cheaper during harvest. Fruits and vegetables are often harmed if delivered too slowly. Rich investors with limited land can invest in teak, agarwood, and other trees. When harvesting, investors might choose raw results or direct wood sales earnings. Teak takes at least 7 years to harvest, therefore long-term wood investments carry the risk of crop failure.
9. Teenagers in distant locations can't count, read, or write. Many factors hinder locals' success. Life's demands force them to work instead of study. Creating a learning playground may attract young people to learning. Make a skatepark at school. Skateboarders must learn in school. Donations buy skateboards.
10. Globally, online taxi-bike is known. By hiring a motorcycle/car online, people no longer bother traveling without a vehicle. What if you wish to cross the island or visit remote areas? Is online boat or helicopter rental possible like online taxi-bike? Such a renting process has been done independently thus far and cannot be done quickly.
11. What do startups need now? A startup or investor consultant. How many startups fail to become Unicorns? Many founders don't know how to manage investor money, therefore they waste it on promotions and other things. Many investors only know how to invest and can't guide a struggling firm.
“In times of crisis, the wise build bridges, while the foolish build barriers.” — T’Challa [Black Panther]
Don't chase cash. Money is a byproduct. Profit-seeking is stressful. Market requirements are opportunities. If you have something to say, please comment.
This is only informational. Before implementing ideas, do further study.
You might also like

Glorin Santhosh
3 years ago
Start organizing your ideas by using The Second Brain.

Building A Second Brain helps us remember connections, ideas, inspirations, and insights. Using contemporary technologies and networks increases our intelligence.
This approach makes and preserves concepts. It's a straightforward, practical way to construct a second brain—a remote, centralized digital store for your knowledge and its sources.
How to build ‘The Second Brain’
Have you forgotten any brilliant ideas? What insights have you ignored?
We're pressured to read, listen, and watch informative content. Where did the data go? What happened?
Our brains can store few thoughts at once. Our brains aren't idea banks.
Building a Second Brain helps us remember thoughts, connections, and insights. Using digital technologies and networks expands our minds.
Ten Rules for Creating a Second Brain
1. Creative Stealing
Instead of starting from scratch, integrate other people's ideas with your own.
This way, you won't waste hours starting from scratch and can focus on achieving your goals.
Users of Notion can utilize and customize each other's templates.
2. The Habit of Capture
We must record every idea, concept, or piece of information that catches our attention since our minds are fragile.
When reading a book, listening to a podcast, or engaging in any other topic-related activity, save and use anything that resonates with you.
3. Recycle Your Ideas
Reusing our own ideas across projects might be advantageous since it helps us tie new information to what we already know and avoids us from starting a project with no ideas.
4. Projects Outside of Category
Instead of saving an idea in a folder, group it with documents for a project or activity.
If you want to be more productive, gather suggestions.
5. Burns Slowly
Even if you could finish a job, work, or activity if you focused on it, you shouldn't.
You'll get tired and can't advance many projects. It's easier to divide your routine into daily tasks.
Few hours of daily study is more productive and healthier than entire nights.
6. Begin with a surplus
Instead of starting with a blank sheet when tackling a new subject, utilise previous articles and research.
You may have read or saved related material.
7. Intermediate Packets
A bunch of essay facts.
You can utilize it as a document's section or paragraph for different tasks.
Memorize useful information so you can use it later.
8. You only know what you make
We can see, hear, and read about anything.
What matters is what we do with the information, whether that's summarizing it or writing about it.
9. Make it simpler for yourself in the future.
Create documents or files that your future self can easily understand. Use your own words, mind maps, or explanations.
10. Keep your thoughts flowing.
If you don't employ the knowledge in your second brain, it's useless.
Few people exercise despite knowing its benefits.
Conclusion:
You may continually move your activities and goals closer to completion by organizing and applying your information in a way that is results-focused.
Profit from the information economy's explosive growth by turning your specialized knowledge into cash.
Make up original patterns and linkages between topics.
You may reduce stress and information overload by appropriately curating and managing your personal information stream.
Learn how to apply your significant experience and specific knowledge to a new job, business, or profession.
Without having to adhere to tight, time-consuming constraints, accumulate a body of relevant knowledge and concepts over time.
Take advantage of all the learning materials that are at your disposal, including podcasts, online courses, webinars, books, and articles.

Jon Brosio
3 years ago
You can learn more about marketing from these 8 copywriting frameworks than from a college education.
Email, landing pages, and digital content

Today's most significant skill:
Copywriting.
Unfortunately, most people don't know how to write successful copy because they weren't taught in school.
I've been obsessed with copywriting for two years. I've read 15 books, completed 3 courses, and studied internet's best digital entrepreneurs.
Here are 8 copywriting frameworks that educate more than a four-year degree.
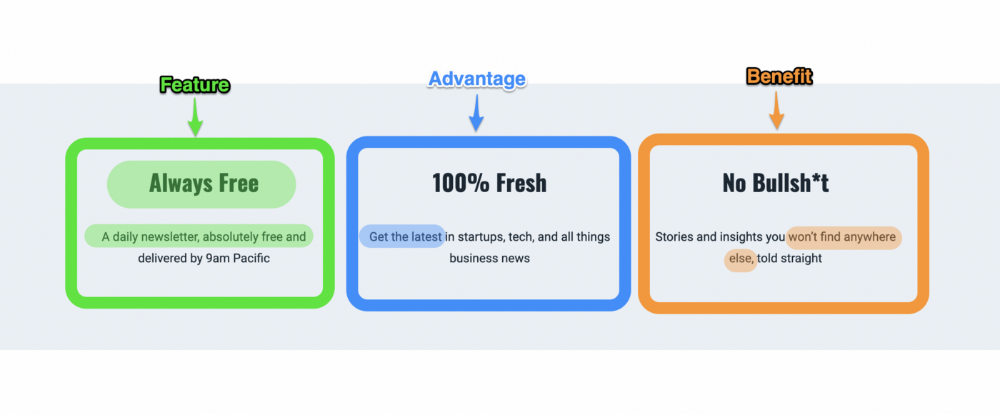
1. Feature — Advantage — Benefit (F.A.B)
This is the most basic copywriting foundation. Email marketing, landing page copy, and digital video ads can use it.
F.A.B says:
How it works (feature)
which is helpful (advantage)
What's at stake (benefit)
The Hustle uses this framework on their landing page to convince people to sign up:
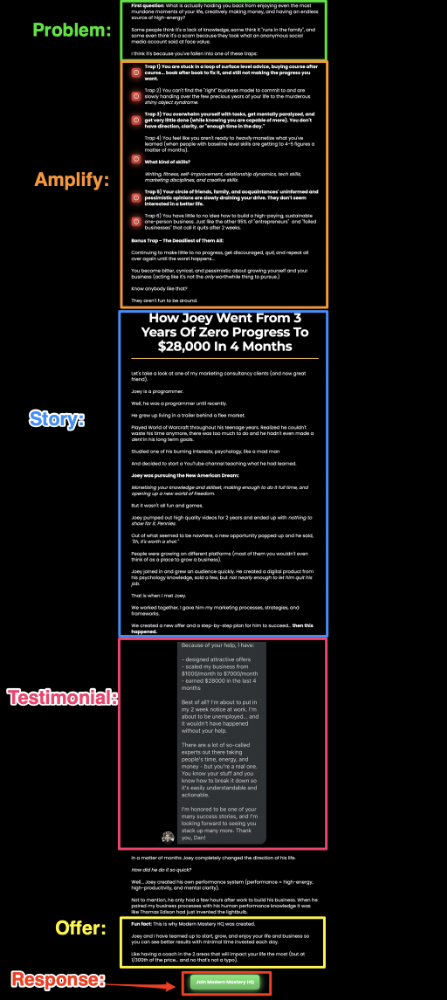
2. P. A. S. T. O. R.
This framework is for longer-form copywriting. PASTOR uses stories to engage with prospects. It explains why people should buy this offer.
PASTOR means:
Problem
Amplify
Story
Testimonial
Offer
Response
Dan Koe's landing page is a great example. It shows PASTOR frame-by-frame.
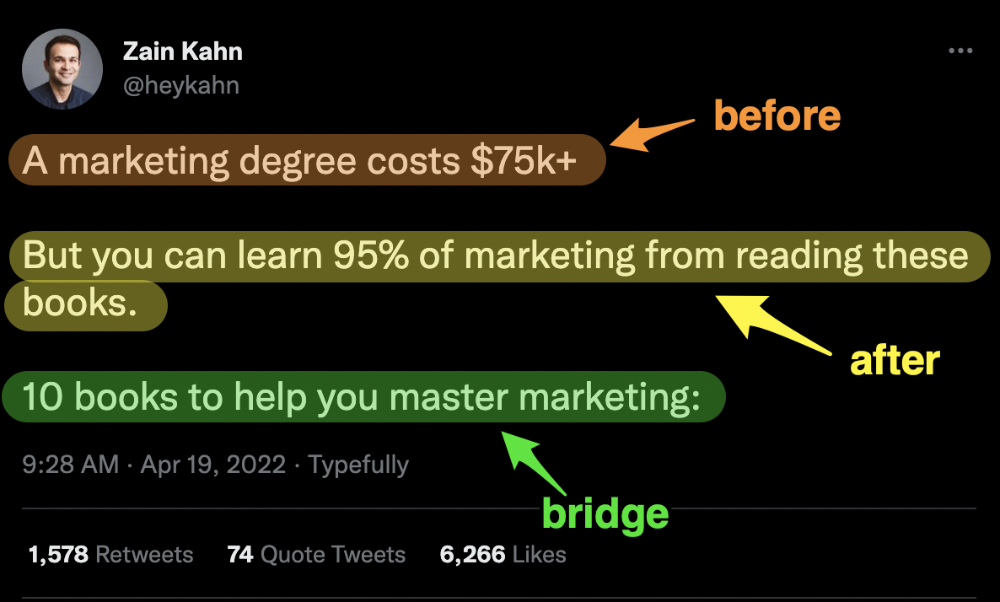
3. Before — After — Bridge
Before-after-bridge is a copywriting framework that draws attention and shows value quickly.
This framework highlights:
where you are
where you want to be
how to get there
Works great for: Email threads/landing pages
Zain Kahn utilizes this framework to write viral threads.
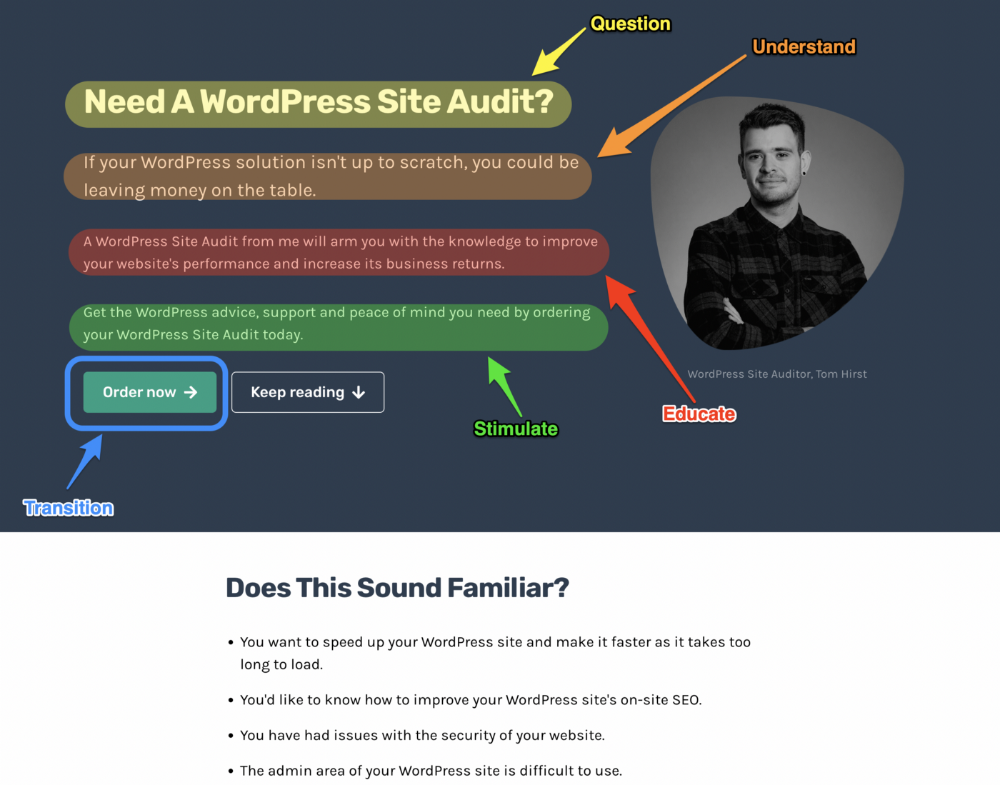
4. Q.U.E.S.T
QUEST is about empathetic writing. You know their issues, obstacles, and headaches. This allows coverups.
QUEST:
Qualifies
Understands
Educates
Stimulates
Transitions
Tom Hirst's landing page uses the QUEST framework.
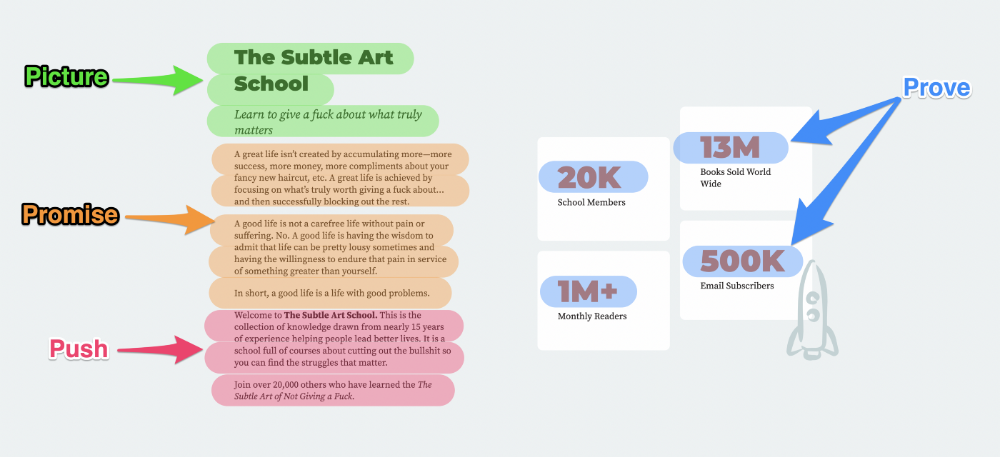
5. The 4P’s model
The 4P’s approach pushes your prospect to action. It educates and persuades quickly.
4Ps:
The problem the visitor is dealing with
The promise that will help them
The proof the promise works
A push towards action
Mark Manson is a bestselling author, digital creator, and pop-philosopher. He's also a great copywriter, and his membership offer uses the 4P’s framework.
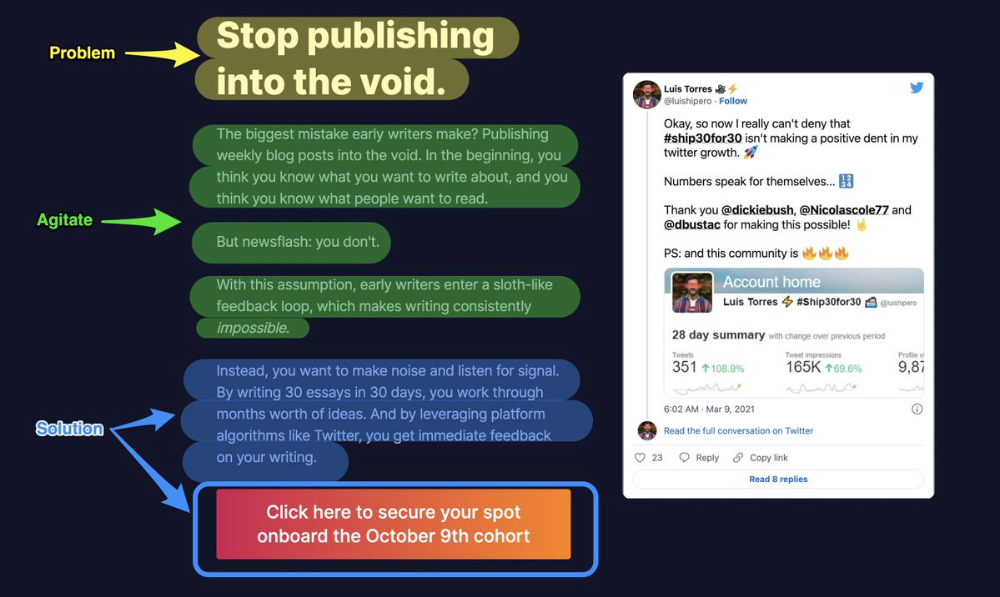
6. Problem — Agitate — Solution (P.A.S)
Up-and-coming marketers should understand problem-agitate-solution copywriting. Once you understand one structure, others are easier. It drives passion and presents a clear solution.
PAS outlines:
The issue the visitor is having
It then intensifies this issue through emotion.
finally offers an answer to that issue (the offer)
The customer's story loops. Nicolas Cole and Dickie Bush use PAS to promote Ship 30 for 30.
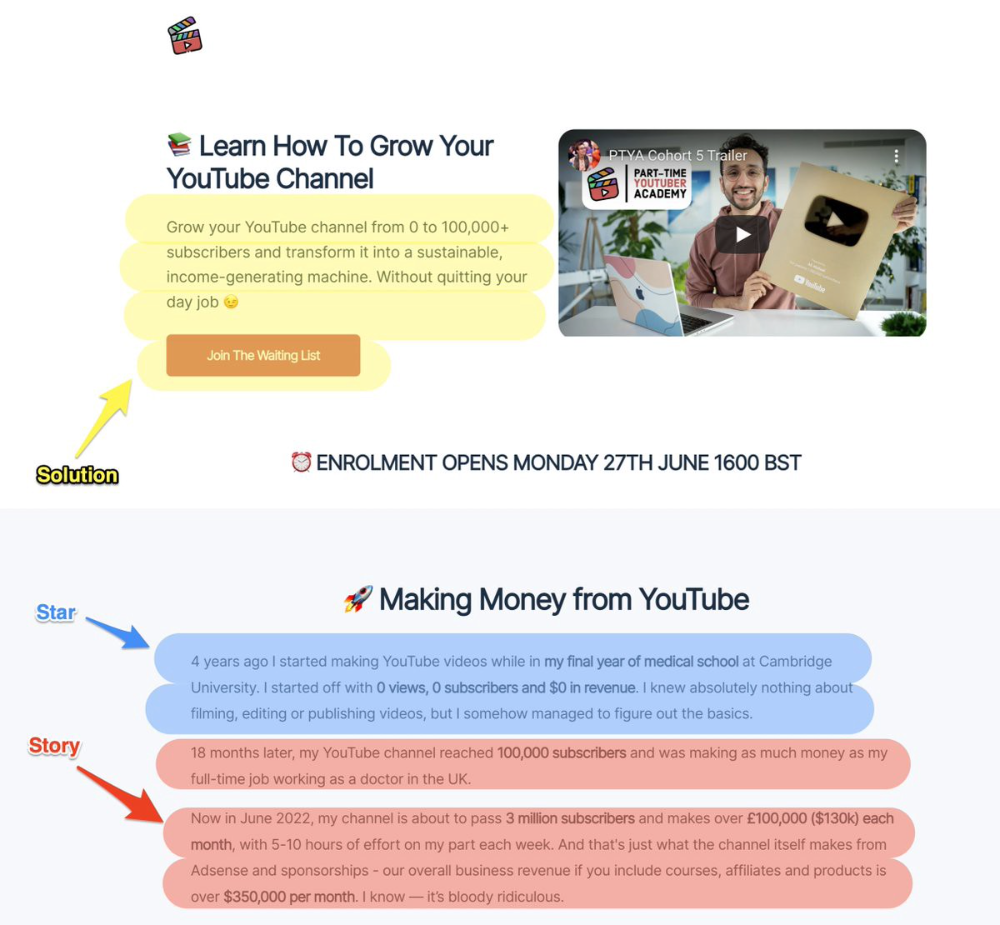
7. Star — Story — Solution (S.S.S)
PASTOR + PAS = star-solution-story. Like PAS, it employs stories to persuade.
S.S.S. is effective storytelling:
Star: (Person had a problem)
Story: (until they had a breakthrough)
Solution: (That created a transformation)
Ali Abdaal is a YouTuber with a great S.S.S copy.
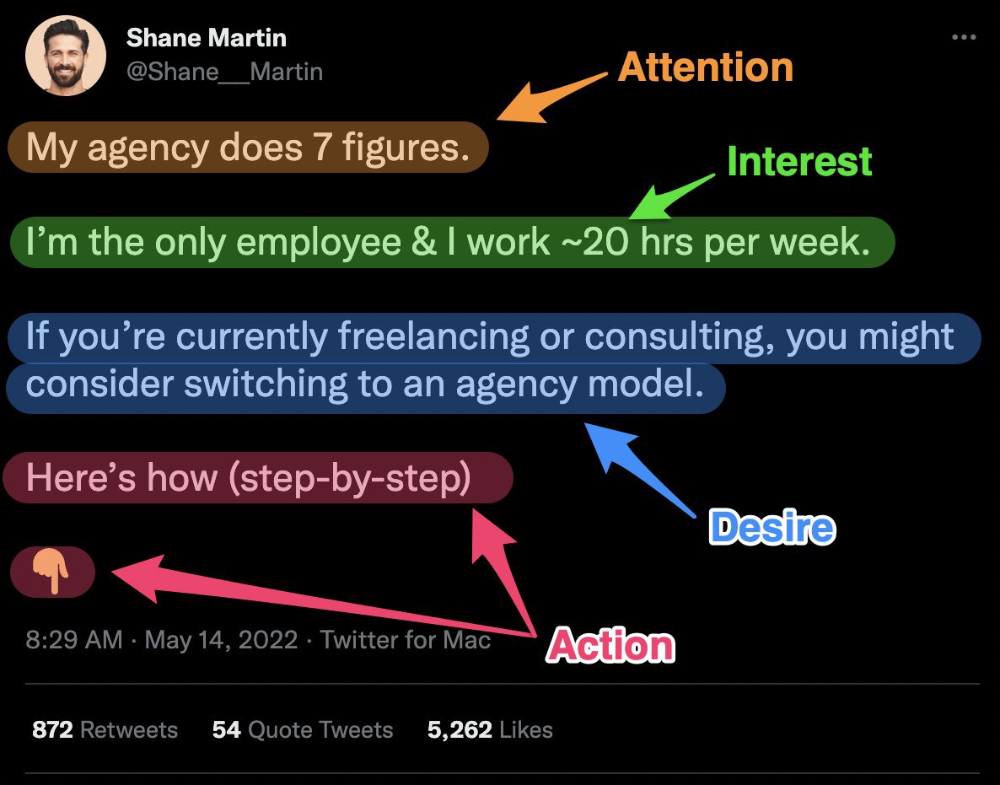
8. Attention — Interest — Desire — Action
AIDA is another classic. This copywriting framework is great for fast-paced environments (think all digital content on Linkedin, Twitter, Medium, etc.).
It works with:
Page landings
writing on thread
Email
It's a good structure since it's concise, attention-grabbing, and action-oriented.
Shane Martin, Twitter's creator, uses this approach to create viral content.
TL;DR
8 copywriting frameworks that teach marketing better than a four-year degree
Feature-advantage-benefit
Before-after-bridge
Star-story-solution
P.A.S.T.O.R
Q.U.E.S.T
A.I.D.A
P.A.S
4P’s

Aparna Jain
3 years ago
Negative Effects of Working for a FAANG Company
Consider yourself lucky if your last FAANG interview was rejected.

FAANG—Facebook, Apple, Amazon, Netflix, Google
(I know its manga now, but watch me not care)
These big companies offer many benefits.
large salaries and benefits
Prestige
high expectations for both you and your coworkers.
However, these jobs may have major drawbacks that only become apparent when you're thrown to the wolves, so it's up to you whether you see them as drawbacks or opportunities.
I know most college graduates start working at big tech companies because of their perceived coolness.
I've worked in these companies for years and can tell you what to expect if you get a job here.
Little fish in a vast ocean
The most obvious. Most billion/trillion-dollar companies employ thousands.
You may work on a small, unnoticed product part.
Directors and higher will sometimes make you redo projects they didn't communicate well without respecting your time, talent, or will to work on trivial stuff that doesn't move company needles.
Peers will only say, "Someone has to take out the trash," even though you know company resources are being wasted.
The power imbalance is frustrating.
What you can do about it
Know your WHY. Consider long-term priorities. Though riskier, I stayed in customer-facing teams because I loved building user-facing products.
This increased my impact. However, if you enjoy helping coworkers build products, you may be better suited for an internal team.
I told the Directors and Vice Presidents that their actions could waste Engineering time, even though it was unpopular. Some were receptive, some not.
I kept having tough conversations because they were good for me and the company.
However, some of my coworkers praised my candor but said they'd rather follow the boss.
An outdated piece of technology can take years to update.
Apple introduced Swift for iOS development in 2014. Most large tech companies adopted the new language after five years.
This is frustrating if you want to learn new skills and increase your market value.
Knowing that my lack of Swift practice could hurt me if I changed jobs made writing verbose Objective C painful.
What you can do about it
Work on the new technology in side projects; one engineer rewrote the Lyft app in Swift over the course of a weekend and promoted its adoption throughout the entire organization.
To integrate new technologies and determine how to combine legacy and modern code, suggest minor changes to the existing codebase.
Most managers spend their entire day in consecutive meetings.
After their last meeting, the last thing they want is another meeting to discuss your career goals.
Sometimes a manager has 15-20 reports, making it hard to communicate your impact.
Misunderstandings and stress can result.
Especially when the manager should focus on selfish parts of the team. Success won't concern them.
What you can do about it
Tell your manager that you are a self-starter and that you will pro-actively update them on your progress, especially if they aren't present at the meetings you regularly attend.
Keep being proactive and look for mentorship elsewhere if you believe your boss doesn't have enough time to work on your career goals.
Alternately, look for a team where the manager has more authority to assist you in making career decisions.
After a certain point, company loyalty can become quite harmful.
Because big tech companies create brand loyalty, too many colleagues stayed in unhealthy environments.
When you work for a well-known company and strangers compliment you, it's fun to tell your friends.
Work defines you. This can make you stay too long even though your career isn't progressing and you're unhappy.
Google may become your surname.
Workplaces are not families.
If you're unhappy, don't stay just because they gave you the paycheck to buy your first home and make you feel like you owe your life to them.
Many employees stayed too long. Though depressed and suicidal.
What you can do about it
Your life is not worth a company.
Do you want your job title and workplace to be listed on your gravestone? If not, leave if conditions deteriorate.
Recognize that change can be challenging. It's difficult to leave a job you've held for a number of years.
Ask those who have experienced this change how they handled it.
You still have a bright future if you were rejected from FAANG interviews.
Rejections only lead to amazing opportunities. If you're young and childless, work for a startup.
Companies may pay more than FAANGs. Do your research.
Ask recruiters and hiring managers tough questions about how the company and teams prioritize respectful working hours and boundaries for workers.
I know many 15-year-olds who have a lifelong dream of working at Google, and it saddens me that they're chasing a name on their resume instead of excellence.
This article is not meant to discourage you from working at these companies, but to share my experience about what HR/managers will never mention in interviews.
Read both sides before signing the big offer letter.