


More on Web3 & Crypto

Jeff Scallop
3 years ago
The Age of Decentralized Capitalism and DeFi
DeCap is DeFi's killer app.
“Software is eating the world.” Marc Andreesen, venture capitalist
DeFi. Imagine a blockchain-based alternative financial system that offers the same products and services as traditional finance, but with more variety, faster, more secure, lower cost, and simpler access.
Decentralised finance (DeFi) is a marketplace without gatekeepers or central authority managing the flow of money, where customers engage directly with smart contracts running on a blockchain.
DeFi grew exponentially in 2020/21, with Total Value Locked (an inadequate estimate for market size) topping at $100 billion. After that, it crashed.
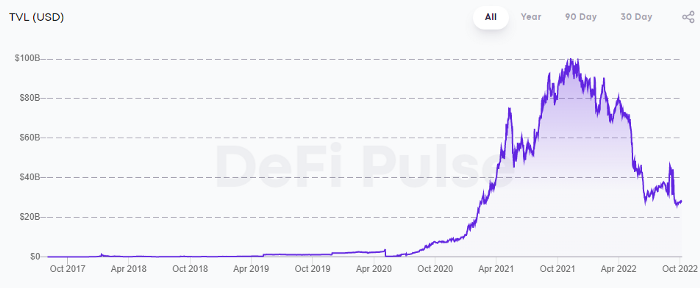
The accumulation of funds by individuals with high discretionary income during the epidemic, the novelty of crypto trading, and the high yields given (5% APY for stablecoins on established platforms to 100%+ for risky assets) are among the primary elements explaining this exponential increase.
No longer your older brothers DeFi
Since transactions are anonymous, borrowers had to overcollateralize DeFi 1.0. To borrow $100 in stablecoins, you must deposit $150 in ETH. DeFi 1.0's business strategy raises two problems.
Why does DeFi offer interest rates that are higher than those of the conventional financial system?;
Why would somebody put down more cash than they intended to borrow?
Maxed out on their own resources, investors took loans to acquire more crypto; the demand for those loans raised DeFi yields, which kept crypto prices increasing; as crypto prices rose, investors made a return on their positions, allowing them to deposit more money and borrow more crypto.
This is a bull market game. DeFi 1.0's overcollateralization speculation is dead. Cryptocrash sank it.
The “speculation by overcollateralisation” world of DeFi 1.0 is dead
At a JP Morgan digital assets conference, institutional investors were more interested in DeFi than crypto or fintech. To me, that shows DeFi 2.0's institutional future.
DeFi 2.0 protocols must handle KYC/AML, tax compliance, market abuse, and cybersecurity problems to be institutional-ready.
Stablecoins gaining market share under benign regulation and more CBDCs coming online in the next couple of years could help DeFi 2.0 separate from crypto volatility.
DeFi 2.0 will have a better footing to finally decouple from crypto volatility
Then we can transition from speculation through overcollateralization to DeFi's genuine comparative advantages: cheaper transaction costs, near-instant settlement, more efficient price discovery, faster time-to-market for financial innovation, and a superior audit trail.
Akin to Amazon for financial goods
Amazon decimated brick-and-mortar shops by offering millions of things online, warehouses by keeping just-in-time inventory, and back-offices by automating invoicing and payments. Software devoured retail. DeFi will eat banking with software.
DeFi is the Amazon for financial items that will replace fintech. Even the most advanced internet brokers offer only 100 currency pairings and limited bonds, equities, and ETFs.
Old banks settlement systems and inefficient, hard-to-upgrade outdated software harm them. For advanced gamers, it's like driving an F1 vehicle on dirt.
It is like driving a F1 car on a dirt road, for the most sophisticated players
Central bankers throughout the world know how expensive and difficult it is to handle cross-border payments using the US dollar as the reserve currency, which is vulnerable to the economic cycle and geopolitical tensions.
Decentralization is the only method to deliver 24h global financial markets. DeFi 2.0 lets you buy and sell startup shares like Google or Tesla. VC funds will trade like mutual funds. Or create a bundle coverage for your car, house, and NFTs. Defi 2.0 consumes banking and creates Global Wall Street.
Defi 2.0 is how software eats banking and delivers the global Wall Street
Decentralized Capitalism is Emerging
90% of markets are digital. 10% is hardest to digitalize. That's money creation, ID, and asset tokenization.
90% of financial markets are already digital. The only problem is that the 10% left is the hardest to digitalize
Debt helped Athens construct a powerful navy that secured trade routes. Bonds financed the Renaissance's wars and supply chains. Equity fueled industrial growth. FX drove globalization's payments system. DeFi's plans:
If the 20th century was a conflict between governments and markets over economic drivers, the 21st century will be between centralized and decentralized corporate structures.
Offices vs. telecommuting. China vs. onshoring/friendshoring. Oil & gas vs. diverse energy matrix. National vs. multilateral policymaking. DAOs vs. corporations Fiat vs. crypto. TradFi vs.
An age where the network effects of the sharing economy will overtake the gains of scale of the monopolistic competition economy
This is the dawn of Decentralized Capitalism (or DeCap), an age where the network effects of the sharing economy will reach a tipping point and surpass the scale gains of the monopolistic competition economy, further eliminating inefficiencies and creating a more robust economy through better data and automation. DeFi 2.0 enables this.
DeFi needs to pay the piper now.
DeCap won't be Web3.0's Shangri-La, though. That's too much for an ailing Atlas. When push comes to shove, DeFi folks want to survive and fight another day for the revolution. If feasible, make a tidy profit.
Decentralization wasn't meant to circumvent regulation. It circumvents censorship. On-ramp, off-ramp measures (control DeFi's entry and exit points, not what happens in between) sound like a good compromise for DeFi 2.0.
The sooner authorities realize that DeFi regulation is made ex-ante by writing code and constructing smart contracts with rules, the faster DeFi 2.0 will become the more efficient and safe financial marketplace.
More crucially, we must boost system liquidity. DeFi's financial stability risks are downplayed. DeFi must improve its liquidity management if it's to become mainstream, just as banks rely on capital constraints.
This reveals the complex and, frankly, inadequate governance arrangements for DeFi protocols. They redistribute control from tokenholders to developers, which is bad governance regardless of the economic model.
But crypto can only ride the existing banking system for so long before forming its own economy. DeFi will upgrade web2.0's financial rails till then.

Alex Bentley
3 years ago
Why Bill Gates thinks Bitcoin, crypto, and NFTs are foolish
Microsoft co-founder Bill Gates assesses digital assets while the bull is caged.

Bill Gates is well-respected.
Reasonably. He co-founded and led Microsoft during its 1980s and 1990s revolution.
After leaving Microsoft, Bill Gates pursued other interests. He and his wife founded one of the world's largest philanthropic organizations, Bill & Melinda Gates Foundation. He also supports immunizations, population control, and other global health programs.
When Gates criticized Bitcoin, cryptocurrencies, and NFTs, it made news.
Bill Gates said at the 58th Munich Security Conference...
“You have an asset class that’s 100% based on some sort of greater fool theory that somebody’s going to pay more for it than I do.”
Gates means digital assets. Like many bitcoin critics, he says digital coins and tokens are speculative.
And he's not alone. Financial experts have dubbed Bitcoin and other digital assets a "bubble" for a decade.
Gates also made fun of Bored Ape Yacht Club and NFTs, saying, "Obviously pricey digital photographs of monkeys will help the world."
Why does Bill Gates dislike digital assets?
According to Gates' latest comments, Bitcoin, cryptos, and NFTs aren't good ways to hold value.
Bill Gates is a better investor than Elon Musk.
“I’m used to asset classes, like a farm where they have output, or like a company where they make products,” Gates said.
The Guardian claimed in April 2021 that Bill and Melinda Gates owned the most U.S. farms. Over 242,000 acres of farmland.
The Gates couple has enough farmland to cover Hong Kong.

Bill Gates is a classic investor. He wants companies with an excellent track record, strong fundamentals, and good management. Or tangible assets like land and property.
Gates prefers the "old economy" over the "new economy"
Gates' criticism of Bitcoin and cryptocurrency ventures isn't surprising. These digital assets lack all of Gates's investing criteria.
Volatile digital assets include Bitcoin. Their costs might change dramatically in a day. Volatility scares risk-averse investors like Gates.
Gates has a stake in the old financial system. As Microsoft's co-founder, Gates helped develop a dominant tech company.
Because of his business, he's one of the world's richest men.
Bill Gates is invested in protecting the current paradigm.
He won't invest in anything that could destroy the global economy.
When Gates criticizes Bitcoin, cryptocurrencies, and NFTs, he's suggesting they're a hoax. These soapbox speeches are one way he protects his interests.
Digital assets aren't a bad investment, though. Many think they're the future.
Changpeng Zhao and Brian Armstrong are two digital asset billionaires. Two crypto exchange CEOs. Binance/Coinbase.
Digital asset revolution won't end soon.
If you disagree with Bill Gates and plan to invest in Bitcoin, cryptocurrencies, or NFTs, do your own research and understand the risks.
But don’t take Bill Gates’ word for it.
He’s just an old rich guy with a lot of farmland.
He has a lot to lose if Bitcoin and other digital assets gain global popularity.
This post is a summary. Read the full article here.

Chris
2 years ago
What the World's Most Intelligent Investor Recently Said About Crypto
Cryptoshit. This thing is crazy to buy.
Charlie Munger is revered and powerful in finance.
Munger, vice chairman of Berkshire Hathaway, is noted for his wit, no-nonsense attitude to investment, and ability to spot promising firms and markets.
Munger's crypto views have upset some despite his reputation as a straight shooter.
“There’s only one correct answer for intelligent people, just totally avoid all the people that are promoting it.” — Charlie Munger
The Munger Interview on CNBC (4:48 secs)
This Monday, CNBC co-anchor Rebecca Quick interviewed Munger and brought up his 2007 statement, "I'm not allowed to have an opinion on this subject until I can present the arguments against my viewpoint better than the folks who are supporting it."
Great investing and life advice!
If you can't explain the opposing reasons, you're not informed enough to have an opinion.
In today's world, it's important to grasp both sides of a debate before supporting one.
Rebecca inquired:
Does your Wall Street Journal article on banning cryptocurrency apply? If so, would you like to present the counterarguments?
Mungers reply:
I don't see any viable counterarguments. I think my opponents are idiots, hence there is no sensible argument against my position.
Consider his words.
Do you believe Munger has studied both sides?
He said, "I assume my opponents are idiots, thus there is no sensible argument against my position."
This is worrisome, especially from a guy who once encouraged studying both sides before forming an opinion.
Munger said:
National currencies have benefitted humanity more than almost anything else.
Hang on, I think we located the perpetrator.
Munger thinks crypto will replace currencies.
False.
I doubt he studied cryptocurrencies because the name is deceptive.
He misread a headline as a Dollar destroyer.
Cryptocurrencies are speculations.
Like Tesla, Amazon, Apple, Google, Microsoft, etc.
Crypto won't replace dollars.
In the interview with CNBC, Munger continued:
“I’m not proud of my country for allowing this crap, what I call the cryptoshit. It’s worthless, it’s no good, it’s crazy, it’ll do nothing but harm, it’s anti-social to allow it.” — Charlie Munger
Not entirely inaccurate.
Daily cryptos are established solely to pump and dump regular investors.
Let's get into Munger's crypto aversion.
Rat poison is bitcoin.
Munger famously dubbed Bitcoin rat poison and a speculative bubble that would implode.
Partially.
But the bubble broke. Since 2021, the market has fallen.
Scam currencies and NFTs are being eliminated, which I like.
Whoa.
Why does Munger doubt crypto?
Mungers thinks cryptocurrencies has no intrinsic value.
He worries about crypto fraud and money laundering.
Both are valid issues.
Yet grouping crypto is intellectually dishonest.
Ethereum, Bitcoin, Solana, Chainlink, Flow, and Dogecoin have different purposes and values (not saying they’re all good investments).
Fraudsters who hurt innocents will be punished.
Therefore, complaining is useless.
Why not stop it? Repair rather than complain.
Regrettably, individuals today don't offer solutions.
Blind Areas for Mungers
As with everyone, Mungers' bitcoin views may be impacted by his biases and experiences.
OK.
But Munger has always advocated classic value investing and may be wary of investing in an asset outside his expertise.
Mungers' banking and insurance investments may influence his bitcoin views.
Could a coworker or acquaintance have told him crypto is bad and goes against traditional finance?
Right?
Takeaways
Do you respect Charlie Mungers?
Yes and no, like any investor or individual.
To understand Mungers' bitcoin beliefs, you must be critical.
Mungers is a successful investor, but his views about bitcoin should be considered alongside other viewpoints.
Munger’s success as an investor has made him an influencer in the space.
Influence gives power.
He controls people's thoughts.
Munger's ok. He will always be heard.
I'll do so cautiously.
You might also like

Niharikaa Kaur Sodhi
3 years ago
The Only Paid Resources I Turn to as a Solopreneur

4 Pricey Tools That Are Valuable
I pay based on ROI (return on investment).
If a $20/month tool or $500 online course doubles my return, I'm in.
Investing helps me build wealth.
Canva Pro
I initially refused to pay.
My course content needed updating a few months ago. My Google Docs text looked cleaner and more professional in Canva.
I've used it to:
product cover pages
eBook covers
Product page infographics
See my Google Sheets vs. Canva product page graph.
Google Sheets vs Canva
Yesterday, I used it to make a LinkedIn video thumbnail. It took less than 5 minutes and improved my video.

In 30 hours, the video had 39,000 views.
Here's more.
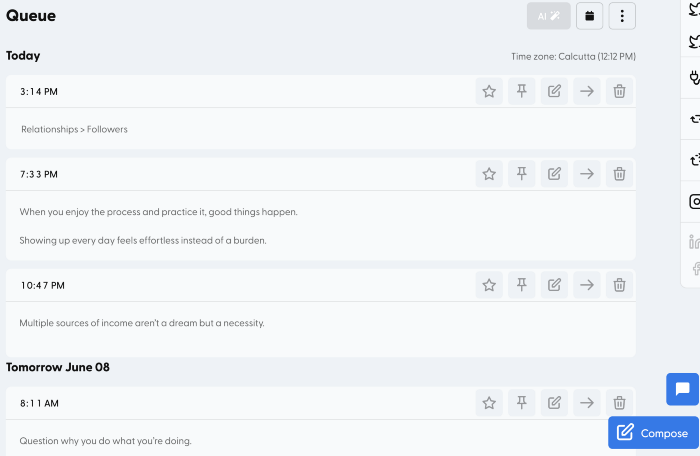
HypeFury
Hypefury rocks!
It builds my brand as I sleep. What else?
Because I'm traveling this weekend, I planned tweets for 10 days. It took me 80 minutes.
So while I travel or am absent, my content mill keeps producing.
Also I like:
I can reach hundreds of people thanks to auto-DMs. I utilize it to advertise freebies; for instance, leave an emoji remark to receive my checklist. And they automatically receive a message in their DM.
Scheduled Retweets: By appearing in a different time zone, they give my tweet a second chance.
It helps me save time and expand my following, so that's my favorite part.
It’s also super neat:
Zoom Pro
My course involves weekly and monthly calls for alumni.
Google Meet isn't great for group calls. The interface isn't great.
Zoom Pro is expensive, and the monthly payments suck, but it's necessary.
It gives my students a smooth experience.
Previously, we'd do 40-minute meetings and then reconvene.
Zoom's free edition limits group calls to 40 minutes.
This wouldn't be a good online course if I paid hundreds of dollars.
So I felt obligated to help.
YouTube Premium
My laptop has an ad blocker.
I bought an iPad recently.
When you're self-employed and work from home, the line between the two blurs. My bed is only 5 steps away!
When I read or watched videos on my laptop, I'd slide into work mode. Only option was to view on phone, which is awkward.
YouTube premium handles it. No more advertisements and I can listen on the move.
3 Expensive Tools That Aren't Valuable
Marketing strategies are sometimes aimed to make you feel you need 38474 cool features when you don’t.
Certain tools are useless.
I found it useless.
Depending on your needs. As a writer and creator, I get no return.
They could for other jobs.
Shield Analytics
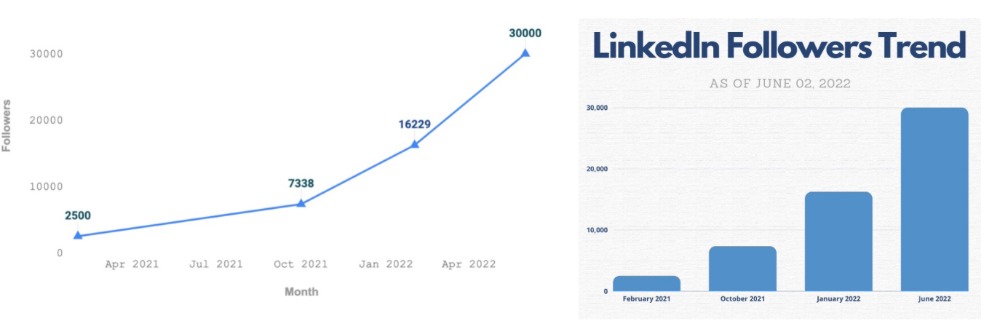
It tracks LinkedIn stats, like:
follower growth
trend chart for impressions
Engagement, views, and comment stats for posts
and much more.
Middle-tier creator costs $12/month.
I got a 25% off coupon but canceled my free trial before writing this. It's not worth the discount.
Why?
LinkedIn provides free analytics. See:
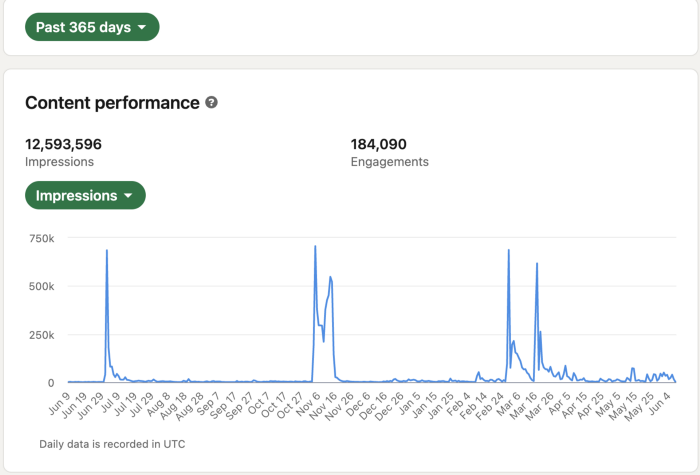
Not thorough and won't show top posts.
I don't need to see my top posts because I love experimenting with writing.
Slack Premium
Slack was my classroom. Slack provided me a premium trial during the prior cohort.
I skipped it.
Sure, voice notes are better than a big paragraph. I didn't require pro features.
Marketing methods sometimes make you think you need 38474 amazing features. Don’t fall for it.
Calendly Pro
This may be worth it if you get many calls.
I avoid calls. During my 9-5, I had too many pointless calls.
I don't need:
ability to schedule calls for 15, 30, or 60 minutes: I just distribute each link separately.
I have a Gumroad consultation page with a payment option.
follow-up emails: I hardly ever make calls, so
I just use one calendar, therefore I link to various calendars.
I'll admit, the integrations are cool. Not for me.
If you're a coach or consultant, the features may be helpful. Or book meetings.
Conclusion
Investing is spending to make money.
Use my technique — put money in tools that help you make money. This separates it from being an investment instead of an expense.
Try free versions of these tools before buying them since everyone else is.

Aure's Notes
3 years ago
I met a man who in just 18 months scaled his startup to $100 million.
A fascinating business conversation.

This week at Web Summit, I had mentor hour.
Mentor hour connects startups with experienced entrepreneurs.
The YC-selected founder who mentored me had grown his company to $100 million in 18 months.
I had 45 minutes to question him.
I've compiled this.
Context
Founder's name is Zack.
After working in private equity, Zack opted to acquire an MBA.
Surrounded by entrepreneurs at a prominent school, he decided to become one himself.
Unsure how to proceed, he bet on two horses.
On one side, he received an offer from folks who needed help running their startup owing to lack of time. On the other hand, he had an idea for a SaaS to start himself.
He just needed to validate it.
Validating
Since Zack's proposal helped companies, he contacted university entrepreneurs for comments.
He contacted university founders.
Once he knew he'd correctly identified the problem and that people were willing to pay to address it, he started developing.
He earned $100k in a university entrepreneurship competition.
His plan was evident by then.
The other startup's founders saw his potential and granted him $400k to launch his own SaaS.
Hiring
He started looking for a tech co-founder because he lacked IT skills.
He interviewed dozens and picked the finest.
As he didn't want to wait for his program to be ready, he contacted hundreds of potential clients and got 15 letters of intent promising they'd join up when it was available.
YC accepted him by then.
He had enough positive signals to raise.
Raising
He didn't say how many VCs he called, but he indicated 50 were interested.
He jammed meetings into two weeks to generate pressure and encourage them to invest.
Seed raise: $11 million.
Selling
His objective was to contact as many entrepreneurs as possible to promote his product.
He first contacted startups by scraping CrunchBase data.
Once he had more money, he started targeting companies with ZoomInfo.
His VC urged him not to hire salespeople until he closed 50 clients himself.
He closed 100 and hired a CRO through a headhunter.
Scaling
Three persons started the business.
He primarily works in sales.
Coding the product was done by his co-founder.
Another person performing operational duties.
He regretted recruiting the third co-founder, who was ineffective (could have hired an employee instead).
He wanted his company to be big, so he hired two young marketing people from a competing company.
After validating several marketing channels, he chose PR.
$100 Million and under
He developed a sales team and now employs 30 individuals.
He raised a $100 million Series A.
Additionally, he stated
He’s been rejected a lot. Like, a lot.
Two great books to read: Steve Jobs by Isaacson, and Why Startups Fail by Tom Eisenmann.
The best skill to learn for non-tech founders is “telling stories”, which means sales. A founder’s main job is to convince: co-founders, employees, investors, and customers. Learn code, or learn sales.
Conclusion
I often read about these stories but hardly take them seriously.
Zack was amazing.
Three things about him stand out:
His vision. He possessed a certain amount of fire.
His vitality. The man had a lot of enthusiasm and spoke quickly and decisively. He takes no chances and pushes the envelope in all he does.
His Rolex.
He didn't do all this in 18 months.
Not really.
He couldn't launch his company without private equity experience.
These accounts disregard entrepreneurs' original knowledge.
Hormozi will tell you how he founded Gym Launch, but he won't tell you how he had a gym first, how he worked at uni to pay for his gym, or how he went to the gym and learnt about fitness, which gave him the idea to open his own.
Nobody knows nothing. If you scale quickly, it's probable because you gained information early.
Lincoln said, "Give me six hours to chop down a tree, and I'll spend four sharpening the axe."
Sharper axes cut trees faster.

Aaron Dinin, PhD
3 years ago
I put my faith in a billionaire, and he destroyed my business.
How did his money blind me?

Like most fledgling entrepreneurs, I wanted a mentor. I met as many nearby folks with "entrepreneur" in their LinkedIn biographies for coffee.
These meetings taught me a lot, and I'd suggest them to any new creator. Attention! Meeting with many experienced entrepreneurs means getting contradictory advice. One entrepreneur will tell you to do X, then the next one you talk to may tell you to do Y, which are sometimes opposites. You'll have to chose which suggestion to take after the chats.
I experienced this. Same afternoon, I had two coffee meetings with experienced entrepreneurs. The first meeting was with a billionaire entrepreneur who took his company public.
I met him in a swanky hotel lobby and ordered a drink I didn't pay for. As a fledgling entrepreneur, money was scarce.
During the meeting, I demoed the software I'd built, he liked it, and we spent the hour discussing what features would make it a success. By the end of the meeting, he requested I include a killer feature we both agreed would attract buyers. The feature was complex and would require some time. The billionaire I was sipping coffee with in a beautiful hotel lobby insisted people would love it, and that got me enthusiastic.
The second meeting was with a young entrepreneur who had recently raised a small amount of investment and looked as eager to pitch me as I was to pitch him. I forgot his name. I mostly recall meeting him in a filthy coffee shop in a bad section of town and buying his pricey cappuccino. Water for me.
After his pitch, I demoed my app. When I was done, he barely noticed. He questioned my customer acquisition plan. Who was my client? What did they offer? What was my plan? Etc. No decent answers.
After our meeting, he insisted I spend more time learning my market and selling. He ignored my questions about features. Don't worry about features, he said. Customers will request features. First, find them.
Putting your faith in results over relevance
Problems plagued my afternoon. I met with two entrepreneurs who gave me differing advice about how to proceed, and I had to decide which to pursue. I couldn't decide.
Ultimately, I followed the advice of the billionaire.
Obviously.
Who wouldn’t? That was the guy who clearly knew more.
A few months later, I constructed the feature the billionaire said people would line up for.
The new feature was unpopular. I couldn't even get the billionaire to answer an email showing him what I'd done. He disappeared.
Within a few months, I shut down the company, wasting all the time and effort I'd invested into constructing the killer feature the billionaire said I required.
Would follow the struggling entrepreneur's advice have saved my company? It would have saved me time in retrospect. Potential consumers would have told me they didn't want what I was producing, and I could have shut down the company sooner or built something they did want. Both outcomes would have been better.
Now I know, but not then. I favored achievement above relevance.
Success vs. relevance
The millionaire gave me advice on building a large, successful public firm. A successful public firm is different from a startup. Priorities change in the last phase of business building, which few entrepreneurs reach. He gave wonderful advice to founders trying to double their stock values in two years, but it wasn't beneficial for me.
The other failing entrepreneur had relevant, recent experience. He'd recently been in my shoes. We still had lots of problems. He may not have achieved huge success, but he had valuable advice on how to pass the closest hurdle.
The money blinded me at the moment. Not alone So much of company success is defined by money valuations, fundraising, exits, etc., so entrepreneurs easily fall into this trap. Money chatter obscures the value of knowledge.
Don't base startup advice on a person's income. Focus on what and when the person has learned. Relevance to you and your goals is more important than a person's accomplishments when considering advice.