


What The Hell Is A Crypto Punk?
We are Crypto Punks, and we are changing your world.
A “Crypto Punk” is a new generation of entrepreneurs who value individual liberty and collective value creation and co-creation through decentralization. While many Crypto Punks were born and raised in a digital world, some of the early pioneers in the crypto space are from the Oregon Trail generation. They were born to an analog world, but grew up simultaneously alongside the birth of home computing, the Internet, and mobile computing.
A Crypto Punk’s world view is not the same as previous generations. By the time most Crypto Punks were born everything from fiat currency, the stock market, pharmaceuticals, the Internet, to advanced operating systems and microprocessing were already present or emerging. Crypto Punks were born into pre-existing conditions and systems of control, not governed by logic or reason but by greed, corporatism, subversion, bureaucracy, censorship, and inefficiency.
All Systems Are Human Made
Crypto Punks understand that all systems were created by people and that previous generations did not have access to information technologies that we have today. This is why Crypto Punks have different values than their parents, and value liberty, decentralization, equality, social justice, and freedom over wealth, money, and power. They understand that the only path forward is to work together to build new and better systems that make the old world order obsolete.
Unlike the original cypher punks and cyber punks, Crypto Punks are a new iteration or evolution of these previous cultures influenced by cryptography, blockchain technology, crypto economics, libertarianism, holographics, democratic socialism, and artificial intelligence. They are tasked with not only undoing the mistakes of previous generations, but also innovating and creating new ways of solving complex problems with advanced technology and solutions.
Where Crypto Punks truly differ is in their understanding that computer systems can exist for more than just engagement and entertainment, but actually improve the human condition by automating bureaucracy and inefficiency by creating more efficient economic incentives and systems.
Crypto Punks Value Transparency and Do Not Trust Flawed, Unequal, and Corrupt Systems
Crypto Punks have a strong distrust for inherently flawed and corrupt systems. This why Crypto Punks value transparency, free speech, privacy, and decentralization. As well as arguably computer systems over human powered systems.
Crypto Punks are the children of the Great Recession, and will never forget the economic corruption that still enslaves younger generations.
Crypto Punks were born to think different, and raised by computers to view reality through an LED looking glass. They will not surrender to the flawed systems of economic wage slavery, inequality, censorship, and subjection. They will literally engineer their own unstoppable financial systems and trade in cryptography over fiat currency merely to prove that belief systems are more powerful than corruption.
Crypto Punks are here to help achieve freedom from world governments, corporations and bankers who monetizine our data to control our lives.
Crypto Punks Decentralize
Despite all the evils of the world today, Crypto Punks know they have the power to create change. This is why Crypto Punks are optimistic about the future despite all the indicators that humanity is destined for failure.
Crypto Punks believe in systems that prioritize people and the planet above profit. Even so, Crypto Punks still believe in capitalistic systems, but only capitalistic systems that incentivize good behaviors that do not violate the common good for the sake of profit.
Cyber Punks Are Co-Creators
We are Crypto Punks, and we will build a better world for all of us. For the true price of creation is not in US dollars, but through working together as equals to replace the unequal and corrupt greedy systems of previous generations.
Where they have failed, Crypto Punks will succeed. Not because we want to, but because we have to. The world we were born into is so corrupt and its systems so flawed and unequal we were never given a choice.
We have to be the change we seek.
We are Crypto Punks.
Either help us, or get out of our way.
Are you a Crypto Punk?
More on Web3 & Crypto

Ren & Heinrich
3 years ago
200 DeFi Projects were examined. Here is what I learned.

I analyze the top 200 DeFi crypto projects in this article.
This isn't a study. The findings benefit crypto investors.
Let’s go!
A set of data
I analyzed data from defillama.com. In my analysis, I used the top 200 DeFis by TVL in October 2022.
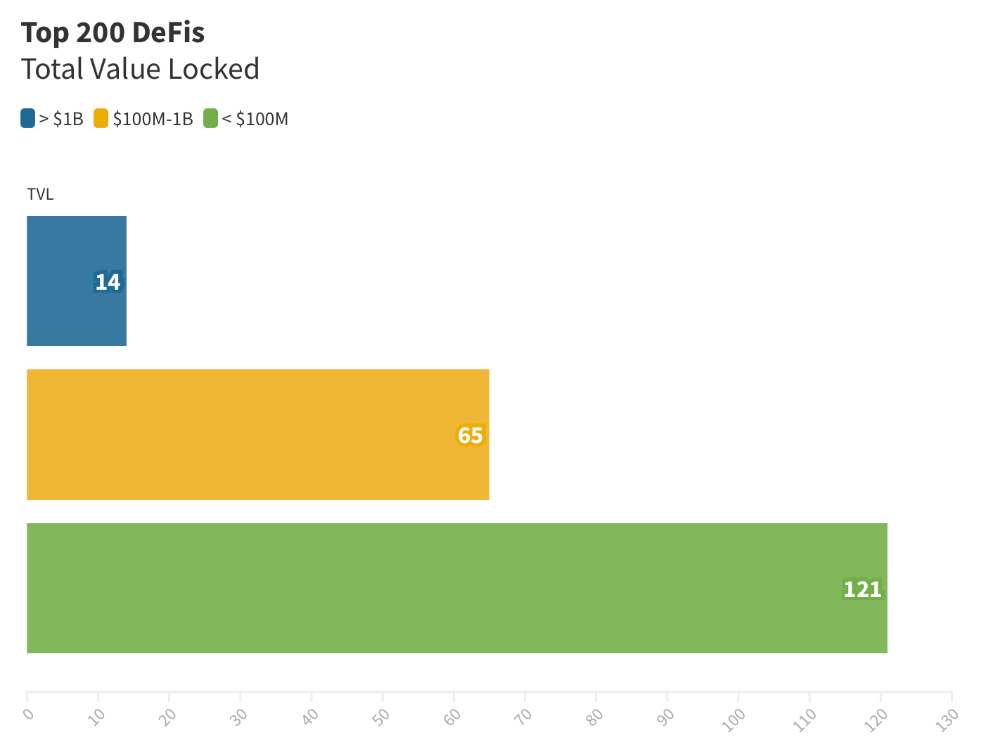
Total Locked Value
The chart below shows platform-specific locked value.
14 platforms had $1B+ TVL. 65 platforms have $100M-$1B TVL. The remaining 121 platforms had TVLs below $100 million, with the lowest being $23 million.
TVLs are distributed Pareto. Top 40% of DeFis account for 80% of TVLs.
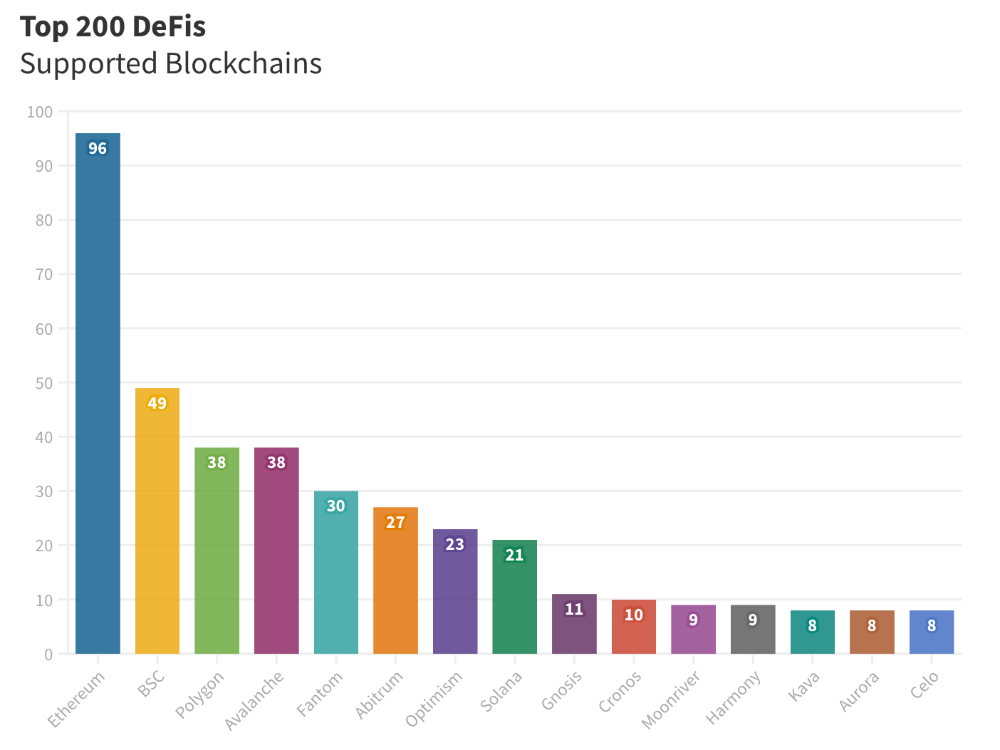
Compliant Blockchains
Ethereum's blockchain leads DeFi. 96 of the examined projects offer services on Ethereum. Behind BSC, Polygon, and Avalanche.
Five platforms used 10+ blockchains. 36 between 2-10 159 used 1 blockchain.
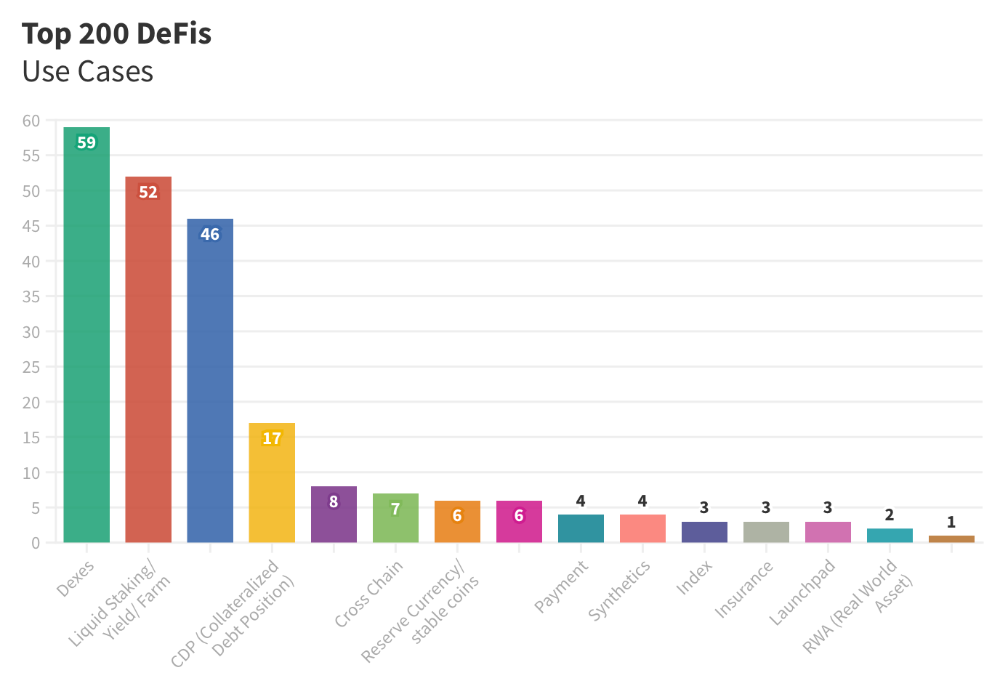
Use Cases for DeFi
The chart below shows platform use cases. Each platform has decentralized exchanges, liquid staking, yield farming, and lending.
These use cases are DefiLlama's main platform features.
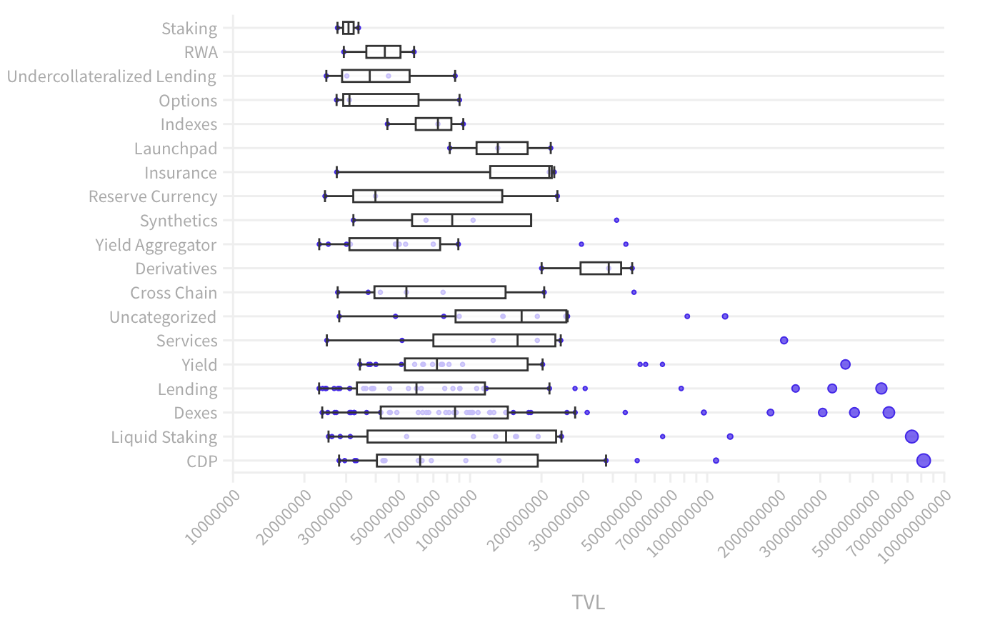
Which use case costs the most? Chart explains. Collateralized debt, liquid staking, dexes, and lending have high TVLs.
The DeFi Industry
I compared three high-TVL platforms (Maker DAO, Balancer, AAVE). The columns show monthly TVL and token price changes. The graph shows monthly Bitcoin price changes.
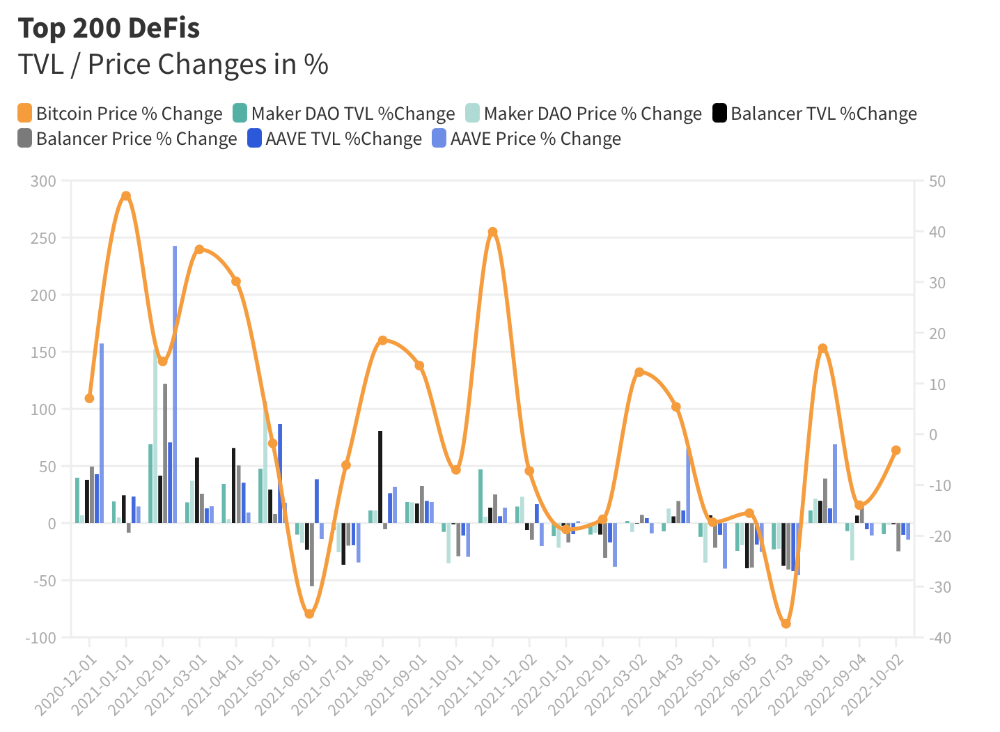
Each platform's market moves similarly.
Probably because most DeFi deposits are cryptocurrencies. Since individual currencies are highly correlated with Bitcoin, it's not surprising that they move in unison.
Takeaways
This analysis shows that the most common DeFi services (decentralized exchanges, liquid staking, yield farming, and lending) also have the highest average locked value.
Some projects run on one or two blockchains, while others use 15 or 20. Our analysis shows that a project's blockchain count has no correlation with its success.
It's hard to tell if certain use cases are rising. Bitcoin's price heavily affects the entire DeFi market.
TVL seems to be a good indicator of a DeFi platform's success and quality. Higher TVL platforms are cheaper. They're a better long-term investment because they gain or lose less value than DeFis with lower TVLs.

Coinbase
4 years ago
10 Predictions for Web3 and the Cryptoeconomy for 2022
By Surojit Chatterjee, Chief Product Officer
2021 proved to be a breakout year for crypto with BTC price gaining almost 70% yoy, Defi hitting $150B in value locked, and NFTs emerging as a new category. Here’s my view through the crystal ball into 2022 and what it holds for our industry:
1. Eth scalability will improve, but newer L1 chains will see substantial growth — As we welcome the next hundred million users to crypto and Web3, scalability challenges for Eth are likely to grow. I am optimistic about improvements in Eth scalability with the emergence of Eth2 and many L2 rollups. Traction of Solana, Avalanche and other L1 chains shows that we’ll live in a multi-chain world in the future. We’re also going to see newer L1 chains emerge that focus on specific use cases such as gaming or social media.
2. There will be significant usability improvements in L1-L2 bridges — As more L1 networks gain traction and L2s become bigger, our industry will desperately seek improvements in speed and usability of cross-L1 and L1-L2 bridges. We’re likely to see interesting developments in usability of bridges in the coming year.
3. Zero knowledge proof technology will get increased traction — 2021 saw protocols like ZkSync and Starknet beginning to get traction. As L1 chains get clogged with increased usage, ZK-rollup technology will attract both investor and user attention. We’ll see new privacy-centric use cases emerge, including privacy-safe applications, and gaming models that have privacy built into the core. This may also bring in more regulator attention to crypto as KYC/AML could be a real challenge in privacy centric networks.
4. Regulated Defi and emergence of on-chain KYC attestation — Many Defi protocols will embrace regulation and will create separate KYC user pools. Decentralized identity and on-chain KYC attestation services will play key roles in connecting users’ real identity with Defi wallet endpoints. We’ll see more acceptance of ENS type addresses, and new systems from cross chain name resolution will emerge.
5. Institutions will play a much bigger role in Defi participation — Institutions are increasingly interested in participating in Defi. For starters, institutions are attracted to higher than average interest-based returns compared to traditional financial products. Also, cost reduction in providing financial services using Defi opens up interesting opportunities for institutions. However, they are still hesitant to participate in Defi. Institutions want to confirm that they are only transacting with known counterparties that have completed a KYC process. Growth of regulated Defi and on-chain KYC attestation will help institutions gain confidence in Defi.
6. Defi insurance will emerge — As Defi proliferates, it also becomes the target of security hacks. According to London-based firm Elliptic, total value lost by Defi exploits in 2021 totaled over $10B. To protect users from hacks, viable insurance protocols guaranteeing users’ funds against security breaches will emerge in 2022.
7. NFT Based Communities will give material competition to Web 2.0 social networks — NFTs will continue to expand in how they are perceived. We’ll see creator tokens or fan tokens take more of a first class seat. NFTs will become the next evolution of users’ digital identity and passport to the metaverse. Users will come together in small and diverse communities based on types of NFTs they own. User created metaverses will be the future of social networks and will start threatening the advertising driven centralized versions of social networks of today.
8. Brands will start actively participating in the metaverse and NFTs — Many brands are realizing that NFTs are great vehicles for brand marketing and establishing brand loyalty. Coca-Cola, Campbell’s, Dolce & Gabbana and Charmin released NFT collectibles in 2021. Adidas recently launched a new metaverse project with Bored Ape Yacht Club. We’re likely to see more interesting brand marketing initiatives using NFTs. NFTs and the metaverse will become the new Instagram for brands. And just like on Instagram, many brands may start as NFT native. We’ll also see many more celebrities jumping in the bandwagon and using NFTs to enhance their personal brand.
9. Web2 companies will wake up and will try to get into Web3 — We’re already seeing this with Facebook trying to recast itself as a Web3 company. We’re likely to see other big Web2 companies dipping their toes into Web3 and metaverse in 2022. However, many of them are likely to create centralized and closed network versions of the metaverse.
10. Time for DAO 2.0 — We’ll see DAOs become more mature and mainstream. More people will join DAOs, prompting a change in definition of employment — never receiving a formal offer letter, accepting tokens instead of or along with fixed salaries, and working in multiple DAO projects at the same time. DAOs will also confront new challenges in terms of figuring out how to do M&A, run payroll and benefits, and coordinate activities in larger and larger organizations. We’ll see a plethora of tools emerge to help DAOs execute with efficiency. Many DAOs will also figure out how to interact with traditional Web2 companies. We’re likely to see regulators taking more interest in DAOs and make an attempt to educate themselves on how DAOs work.
Thanks to our customers and the ecosystem for an incredible 2021. Looking forward to another year of building the foundations for Web3. Wagmi.

Max Parasol
4 years ago
What the hell is Web3 anyway?
"Web 3.0" is a trendy buzzword with a vague definition. Everyone agrees it has to do with a blockchain-based internet evolution, but what is it?
Yet, the meaning and prospects for Web3 have become hot topics in crypto communities. Big corporations use the term to gain a foothold in the space while avoiding the negative connotations of “crypto.”
But it can't be evaluated without a definition.
Among those criticizing Web3's vagueness is Cobie:
“Despite the dominie's deluge of undistinguished think pieces, nobody really agrees on what Web3 is. Web3 is a scam, the future, tokenizing the world, VC exit liquidity, or just another name for crypto, depending on your tribe.
“Even the crypto community is split on whether Bitcoin is Web3,” he adds.
The phrase was coined by an early crypto thinker, and the community has had years to figure out what it means. Many ideologies and commercial realities have driven reverse engineering.
Web3 is becoming clearer as a concept. It contains ideas. It was probably coined by Ethereum co-founder Gavin Wood in 2014. His definition of Web3 included “trustless transactions” as part of its tech stack. Wood founded the Web3 Foundation and the Polkadot network, a Web3 alternative future.
The 2013 Ethereum white paper had previously allowed devotees to imagine a DAO, for example.
Web3 now has concepts like decentralized autonomous organizations, sovereign digital identity, censorship-free data storage, and data divided by multiple servers. They intertwine discussions about the “Web3” movement and its viability.
These ideas are linked by Cobie's initial Web3 definition. A key component of Web3 should be “ownership of value” for one's own content and data.
Noting that “late-stage capitalism greedcorps that make you buy a fractionalized micropayment NFT on Cardano to operate your electric toothbrush” may build the new web, he notes that “crypto founders are too rich to care anymore.”
Very Important
Many critics of Web3 claim it isn't practical or achievable. Web3 critics like Moxie Marlinspike (creator of sslstrip and Signal/TextSecure) can never see people running their own servers. Early in January, he argued that protocols are more difficult to create than platforms.
While this is true, some projects, like the file storage protocol IPFS, allow users to choose which jurisdictions their data is shared between.
But full decentralization is a difficult problem. Suhaza, replying to Moxie, said:
”People don't want to run servers... Companies are now offering API access to an Ethereum node as a service... Almost all DApps interact with the blockchain using Infura or Alchemy. In fact, when a DApp uses a wallet like MetaMask to interact with the blockchain, MetaMask is just calling Infura!
So, here are the questions: Web3: Is it a go? Is it truly decentralized?
Web3 history is shaped by Web2 failure.
This is the story of how the Internet was turned upside down...
Then came the vision. Everyone can create content for free. Decentralized open-source believers like Tim Berners-Lee popularized it.
Real-world data trade-offs for content creation and pricing.
A giant Wikipedia page married to a giant Craig's List. No ads, no logins, and a private web carve-up. For free usage, you give up your privacy and data to the algorithmic targeted advertising of Web 2.
Our data is centralized and savaged by giant corporations. Data localization rules and geopolitical walls like China's Great Firewall further fragment the internet.
The decentralized Web3 reflects Berners-original Lee's vision: "No permission is required from a central authority to post anything... there is no central controlling node and thus no single point of failure." Now he runs Solid, a Web3 data storage startup.
So Web3 starts with decentralized servers and data privacy.
Web3 begins with decentralized storage.
Data decentralization is a key feature of the Web3 tech stack. Web2 has closed databases. Large corporations like Facebook, Google, and others go to great lengths to collect, control, and monetize data. We want to change it.
Amazon, Google, Microsoft, Alibaba, and Huawei, according to Gartner, currently control 80% of the global cloud infrastructure market. Web3 wants to change that.
Decentralization enlarges power structures by giving participants a stake in the network. Users own data on open encrypted networks in Web3. This area has many projects.
Apps like Filecoin and IPFS have led the way. Data is replicated across multiple nodes in Web3 storage providers like Filecoin.
But the new tech stack and ideology raise many questions.
Giving users control over their data
According to Ryan Kris, COO of Verida, his “Web3 vision” is “empowering people to control their own data.”
Verida targets SDKs that address issues in the Web3 stack: identity, messaging, personal storage, and data interoperability.
A big app suite? “Yes, but it's a frontier technology,” he says. They are currently building a credentialing system for decentralized health in Bermuda.
By empowering individuals, how will Web3 create a fairer internet? Kris, who has worked in telecoms, finance, cyber security, and blockchain consulting for decades, admits it is difficult:
“The viability of Web3 raises some good business questions,” he adds. “How can users regain control over centralized personal data? How are startups motivated to build products and tools that support this transition? How are existing Web2 companies encouraged to pivot to a Web3 business model to compete with market leaders?
Kris adds that new technologies have regulatory and practical issues:
"On storage, IPFS is great for redundantly sharing public data, but not designed for securing private personal data. It is not controlled by the users. When data storage in a specific country is not guaranteed, regulatory issues arise."
Each project has varying degrees of decentralization. The diehards say DApps that use centralized storage are no longer “Web3” companies. But fully decentralized technology is hard to build.
Web2.5?
Some argue that we're actually building Web2.5 businesses, which are crypto-native but not fully decentralized. This is vital. For example, the NFT may be on a blockchain, but it is linked to centralized data repositories like OpenSea. A server failure could result in data loss.
However, according to Apollo Capital crypto analyst David Angliss, OpenSea is “not exactly community-led”. Also in 2021, much to the chagrin of crypto enthusiasts, OpenSea tried and failed to list on the Nasdaq.
This is where Web2.5 is defined.
“Web3 isn't a crypto segment. “Anything that uses a blockchain for censorship resistance is Web3,” Angliss tells us.
“Web3 gives users control over their data and identity. This is not possible in Web2.”
“Web2 is like feudalism, with walled-off ecosystems ruled by a few. For example, an honest user owned the Instagram account “Meta,” which Facebook rebranded and then had to make up a reason to suspend. Not anymore with Web3. If I buy ‘Ethereum.ens,' Ethereum cannot take it away from me.”
Angliss uses OpenSea as a Web2.5 business example. Too decentralized, i.e. censorship resistant, can be unprofitable for a large company like OpenSea. For example, OpenSea “enables NFT trading”. But it also stopped the sale of stolen Bored Apes.”
Web3 (or Web2.5, depending on the context) has been described as a new way to privatize internet.
“Being in the crypto ecosystem doesn't make it Web3,” Angliss says. The biggest risk is centralized closed ecosystems rather than a growing Web3.
LooksRare and OpenDAO are two community-led platforms that are more decentralized than OpenSea. LooksRare has even been “vampire attacking” OpenSea, indicating a Web3 competitor to the Web2.5 NFT king could find favor.
The addition of a token gives these new NFT platforms more options for building customer loyalty. For example, OpenSea charges a fee that goes nowhere. Stakeholders of LOOKS tokens earn 100% of the trading fees charged by LooksRare on every basic sale.
Maybe Web3's time has come.
So whose data is it?
Continuing criticisms of Web3 platforms' decentralization may indicate we're too early. Users want to own and store their in-game assets and NFTs on decentralized platforms like the Metaverse and play-to-earn games. Start-ups like Arweave, Sia, and Aleph.im propose an alternative.
To be truly decentralized, Web3 requires new off-chain models that sidestep cloud computing and Web2.5.
“Arweave and Sia emerged as formidable competitors this year,” says the Messari Report. They seek to reduce the risk of an NFT being lost due to a data breach on a centralized server.
Aleph.im, another Web3 cloud competitor, seeks to replace cloud computing with a service network. It is a decentralized computing network that supports multiple blockchains by retrieving and encrypting data.
“The Aleph.im network provides a truly decentralized alternative where it is most needed: storage and computing,” says Johnathan Schemoul, founder of Aleph.im. For reasons of consensus and security, blockchains are not designed for large storage or high-performance computing.
As a result, large data sets are frequently stored off-chain, increasing the risk for centralized databases like OpenSea
Aleph.im enables users to own digital assets using both blockchains and off-chain decentralized cloud technologies.
"We need to go beyond layer 0 and 1 to build a robust decentralized web. The Aleph.im ecosystem is proving that Web3 can be decentralized, and we intend to keep going.”
Aleph.im raised $10 million in mid-January 2022, and Ubisoft uses its network for NFT storage. This is the first time a big-budget gaming studio has given users this much control.
It also suggests Web3 could work as a B2B model, even if consumers aren't concerned about “decentralization.” Starting with gaming is common.
Can Tokenomics help Web3 adoption?
Web3 consumer adoption is another story. The average user may not be interested in all this decentralization talk. Still, how much do people value privacy over convenience? Can tokenomics solve the privacy vs. convenience dilemma?
Holon Global Investments' Jonathan Hooker tells us that human internet behavior will change. “Do you own Bitcoin?” he asks in his Web3 explanation. How does it feel to own and control your own sovereign wealth? Then:
“What if you could own and control your data like Bitcoin?”
“The business model must find what that person values,” he says. Putting their own health records on centralized systems they don't control?
“How vital are those medical records to that person at a critical time anywhere in the world? Filecoin and IPFS can help.”
Web3 adoption depends on NFT storage competition. A free off-chain storage of NFT metadata and assets was launched by Filecoin in April 2021.
Denationalization and blockchain technology have significant implications for data ownership and compensation for lending, staking, and using data.
Tokenomics can change human behavior, but many people simply sign into Web2 apps using a Facebook API without hesitation. Our data is already owned by Google, Baidu, Tencent, and Facebook (and its parent company Meta). Is it too late to recover?
Maybe. “Data is like fruit, it starts out fresh but ages,” he says. "Big Tech's data on us will expire."
Web3 founder Kris agrees with Hooker that “value for data is the issue, not privacy.” People accept losing their data privacy, so tokenize it. People readily give up data, so why not pay for it?
"Personalized data offering is valuable in personalization. “I will sell my social media data but not my health data.”
Purists and mass consumer adoption struggle with key management.
Others question data tokenomics' optimism. While acknowledging its potential, Box founder Aaron Levie questioned the viability of Web3 models in a Tweet thread:
“Why? Because data almost always works in an app. A product and APIs that moved quickly to build value and trust over time.”
Levie contends that tokenomics may complicate matters. In addition to community governance and tokenomics, Web3 ideals likely add a new negotiation vector.
“These are hard problems about human coordination, not software or blockchains,”. Using a Facebook API is simple. The business model and user interface are crucial.
For example, the crypto faithful have a common misconception about logging into Web3. It goes like this: Web 1 had usernames and passwords. Web 2 uses Google, Facebook, or Twitter APIs, while Web 3 uses your wallet. Pay with Ethereum on MetaMask, for example.
But Levie is correct. Blockchain key management is stressed in this meme. Even seasoned crypto enthusiasts have heart attacks, let alone newbies.
Web3 requires a better user experience, according to Kris, the company's founder. “How does a user recover keys?”
And at this point, no solution is likely to be completely decentralized. So Web3 key management can be improved. ”The moment someone loses control of their keys, Web3 ceases to exist.”
That leaves a major issue for Web3 purists. Put this one in the too-hard basket.
Is 2022 the Year of Web3?
Web3 must first solve a number of issues before it can be mainstreamed. It must be better and cheaper than Web2.5, or have other significant advantages.
Web3 aims for scalability without sacrificing decentralization protocols. But decentralization is difficult and centralized services are more convenient.
Ethereum co-founder Vitalik Buterin himself stated recently"
This is why (centralized) Binance to Binance transactions trump Ethereum payments in some places because they don't have to be verified 12 times."
“I do think a lot of people care about decentralization, but they're not going to take decentralization if decentralization costs $8 per transaction,” he continued.
“Blockchains need to be affordable for people to use them in mainstream applications... Not for 2014 whales, but for today's users."
For now, scalability, tokenomics, mainstream adoption, and decentralization believers seem to be holding Web3 hostage.
Much like crypto's past.
But stay tuned.
You might also like

Akshad Singi
3 years ago
Four obnoxious one-minute habits that help me save more than 30 hours each week
These four, when combined, destroy procrastination.

You're not rushed. You waste it on busywork.
You'll accept this eventually.
In 2022, the daily average usage of a user on social media is 2.5 hours.
By 2020, 6 billion hours of video were watched each month by Netflix's customers, who used the service an average of 3.2 hours per day.
When we see these numbers, we think "Wow!" People squander so much time as though they don't contribute. True. These are yours. Likewise.
We don't lack time; we just waste it. Once you realize this, you can change your habits to save time. This article explains. If you adopt ALL 4 of these simple behaviors, you'll see amazing benefits.
Time-blocking
Cal Newport's time-blocking trick takes a minute but improves your day's clarity.
Divide the next day into 30-minute (or 5-minute, if you're Elon Musk) segments and assign responsibilities. As seen.
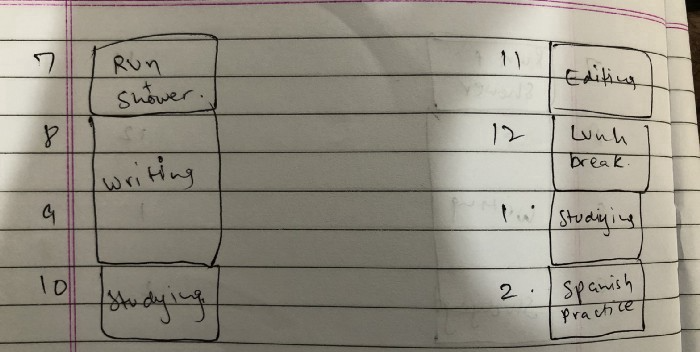
Here's why:
The procrastination that results from attempting to determine when to begin working is eliminated. Procrastination is a given if you choose when to begin working in real-time. Even if you may assume you'll start working in five minutes, it won't take you long to realize that five minutes have turned into an hour. But if you've already determined to start working at 2:00 the next day, your odds of procrastinating are greatly decreased, if not eliminated altogether.
You'll also see that you have a lot of time in a day when you plan your day out on paper and assign chores to each hour. Doing this daily will permanently eliminate the lack of time mindset.
5-4-3-2-1: Have breakfast with the frog!
“If it’s your job to eat a frog, it’s best to do it first thing in the morning. And If it’s your job to eat two frogs, it’s best to eat the biggest one first.”
Eating the frog means accomplishing the day's most difficult chore. It's better to schedule it first thing in the morning when time-blocking the night before. Why?
The day's most difficult task is also the one that causes the most postponement. Because of the stress it causes, the later you schedule it, the more time you risk wasting by procrastinating.
However, if you do it right away in the morning, you'll feel good all day. This is the reason it was set for the morning.
Mel Robbins' 5-second rule can help. Start counting backward 54321 and force yourself to start at 1. If you acquire the urge to work on a goal, you must act within 5 seconds or your brain will destroy it. If you're scheduled to eat your frog at 9, eat it at 8:59. Start working.
Micro-visualisation
You've heard of visualizing to enhance the future. Visualizing a bright future won't do much if you're not prepared to focus on the now and develop the necessary habits. Alexander said:
People don’t decide their futures. They decide their habits and their habits decide their future.
I visualize the next day's schedule every morning. My day looks like this
“I’ll start writing an article at 7:30 AM. Then, I’ll get dressed up and reach the medicine outpatient department by 9:30 AM. After my duty is over, I’ll have lunch at 2 PM, followed by a nap at 3 PM. Then, I’ll go to the gym at 4…”
etc.
This reinforces the day you planned the night before. This makes following your plan easy.
Set the timer.
It's the best iPhone productivity app. A timer is incredible for increasing productivity.
Set a timer for an hour or 40 minutes before starting work. Your call. I don't believe in techniques like the Pomodoro because I can focus for varied amounts of time depending on the time of day, how fatigued I am, and how cognitively demanding the activity is.
I work with a timer. A timer keeps you focused and prevents distractions. Your mind stays concentrated because of the timer. Timers generate accountability.
To pee, I'll pause my timer. When I sit down, I'll continue. Same goes for bottle refills. To use Twitter, I must pause the timer. This creates accountability and focuses work.
Connecting everything
If you do all 4, you won't be disappointed. Here's how:
Plan out your day's schedule the night before.
Next, envision in your mind's eye the same timetable in the morning.
Speak aloud 54321 when it's time to work: Eat the frog! In the morning, devour the largest frog.
Then set a timer to ensure that you remain focused on the task at hand.

Sam Hickmann
4 years ago
What is headline inflation?
Headline inflation is the raw Consumer price index (CPI) reported monthly by the Bureau of labour statistics (BLS). CPI measures inflation by calculating the cost of a fixed basket of goods. The CPI uses a base year to index the current year's prices.
Explaining Inflation
As it includes all aspects of an economy that experience inflation, headline inflation is not adjusted to remove volatile figures. Headline inflation is often linked to cost-of-living changes, which is useful for consumers.
The headline figure doesn't account for seasonality or volatile food and energy prices, which are removed from the core CPI. Headline inflation is usually annualized, so a monthly headline figure of 4% inflation would equal 4% inflation for the year if repeated for 12 months. Top-line inflation is compared year-over-year.
Inflation's downsides
Inflation erodes future dollar values, can stifle economic growth, and can raise interest rates. Core inflation is often considered a better metric than headline inflation. Investors and economists use headline and core results to set growth forecasts and monetary policy.
Core Inflation
Core inflation removes volatile CPI components that can distort the headline number. Food and energy costs are commonly removed. Environmental shifts that affect crop growth can affect food prices outside of the economy. Political dissent can affect energy costs, such as oil production.
From 1957 to 2018, the U.S. averaged 3.64 percent core inflation. In June 1980, the rate reached 13.60%. May 1957 had 0% inflation. The Fed's core inflation target for 2022 is 3%.
Central bank:
A central bank has privileged control over a nation's or group's money and credit. Modern central banks are responsible for monetary policy and bank regulation. Central banks are anti-competitive and non-market-based. Many central banks are not government agencies and are therefore considered politically independent. Even if a central bank isn't government-owned, its privileges are protected by law. A central bank's legal monopoly status gives it the right to issue banknotes and cash. Private commercial banks can only issue demand deposits.
What are living costs?
The cost of living is the amount needed to cover housing, food, taxes, and healthcare in a certain place and time. Cost of living is used to compare the cost of living between cities and is tied to wages. If expenses are higher in a city like New York, salaries must be higher so people can live there.
What's U.S. bureau of labor statistics?
BLS collects and distributes economic and labor market data about the U.S. Its reports include the CPI and PPI, both important inflation measures.

Todd Lewandowski
3 years ago
DWTS: How to Organize Your To-Do List Quickly
Don't overcomplicate to-do lists. DWTS (Done, Waiting, Top 3, Soon) organizes your to-dos.

How Are You Going to Manage Everything?
Modern America is busy. Work involves meetings. Anytime, Slack communications arrive. Many software solutions offer a @-mention notification capability. Emails.
Work obligations continue. At home, there are friends, family, bills, chores, and fun things.
How are you going to keep track of it all? Enter the todo list. It’s been around forever. It’s likely to stay forever in some way, shape, or form.
Everybody has their own system. You probably modified something from middle school. Post-its? Maybe it’s an app? Maybe both, another system, or none.
I suggest a format that has worked for me in 15 years of professional and personal life.
Try it out and see if it works for you. If not, no worries. You do you! Hopefully though you can learn a thing or two, and I from you too.
It is merely a Google Doc, yes.
It's a giant list. One task per line. Indent subtasks on a new line. Add or move new tasks as needed.
I recommend using Google Docs. It's easy to use and flexible for structuring.
Prioritizing these tasks is key. I organize them using DWTS (Done, Waiting, Top 3, Soon). Chronologically is good because it implicitly provides both a priority (high, medium, low) and an ETA (now, soon, later).
Yes, I recognize the similarities to DWTS (Dancing With The Stars) TV Show. Although I'm not a fan, it's entertaining. The acronym is easy to remember and adds fun to something dull.

What each section contains
Done
All tasks' endpoint. Finish here. Don't worry about it again.
Waiting
You're blocked and can't continue. Blocked tasks usually need someone. Write Person Task so you know who's waiting.
Blocking tasks shouldn't last long. After a while, remind them kindly. If people don't help you out of kindness, they will if you're persistent.
Top 3
Mental focus areas. These can be short- to mid-term goals or recent accomplishments. 2 to 5 is a good number to stay focused.
Top 3 reminds us to prioritize. If they don't fit your Top 3 goals, delay them.
Every 1:1 at work is a project update. Another chance to list your top 3. You should know your Top 3 well and be able to discuss them confidently.
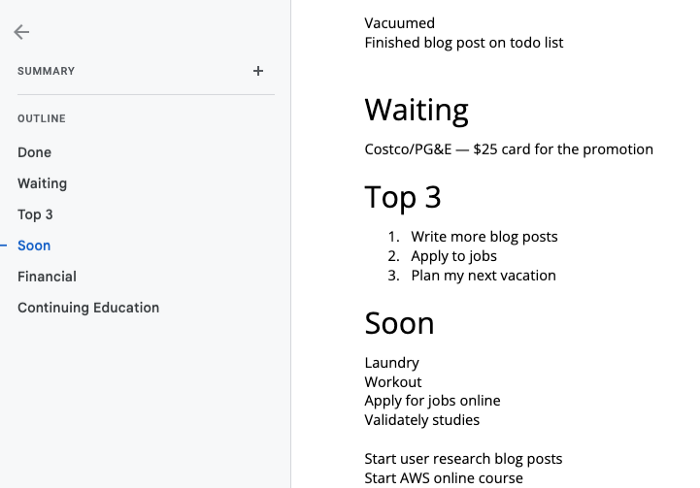
Soon
Here's your short-term to-do list. Rank them from highest to lowest.
I usually subdivide it with empty lines. First is what I have to do today, then week, then month. Subsections can be arranged however you like.
Inventories by Concept
Tasks that aren’t in your short or medium future go into the backlog.
Eventually you’ll complete these tasks, assign them to someone else, or mark them as “wont’ do” (like done but in another sense).
Backlog tasks don't need to be organized chronologically because their timing and priority may change. Theme-organize them. When planning/strategic, you can choose themes to focus on, so future top 3 topics.
More Tips on Todos
Decide Upon a Morning Goal
Morning routines are universal. Coffee and Wordle. My to-do list is next. Two things:
As needed, update the to-do list: based on the events of yesterday and any fresh priorities.
Pick a few jobs to complete today: Pick a few goals that you know you can complete today. Push the remainder below and move them to the top of the Soon section. I typically select a few tasks I am confident I can complete along with one stretch task that might extend into tomorrow.
Finally. By setting and achieving small goals every day, you feel accomplished and make steady progress on medium and long-term goals.
Tech companies call this a daily standup. Everyone shares what they did yesterday, what they're doing today, and any blockers. The name comes from a tradition of holding meetings while standing up to keep them short. Even though it's virtual, everyone still wants a quick meeting.
Your team may or may not need daily standups. Make a daily review a habit with your coffee.
Review Backwards & Forwards on a regular basis
While you're updating your to-do list daily, take time to review it.
Review your Done list. Remember things you're proud of and things that could have gone better. Your Done list can be long. Archive it so your main to-do list isn't overwhelming.
Future-gaze. What you considered important may no longer be. Reorder tasks. Backlog grooming is a workplace term.
Backwards-and-forwards reviews aren't required often. Every 3-6 months is fine. They help you see the forest as often as the trees.
Final Remarks
Keep your list simple. Done, Waiting, Top 3, Soon. These are the necessary sections. If you like, add more subsections; otherwise, keep it simple.
I recommend a morning review. By having clear goals and an action-oriented attitude, you'll be successful.