


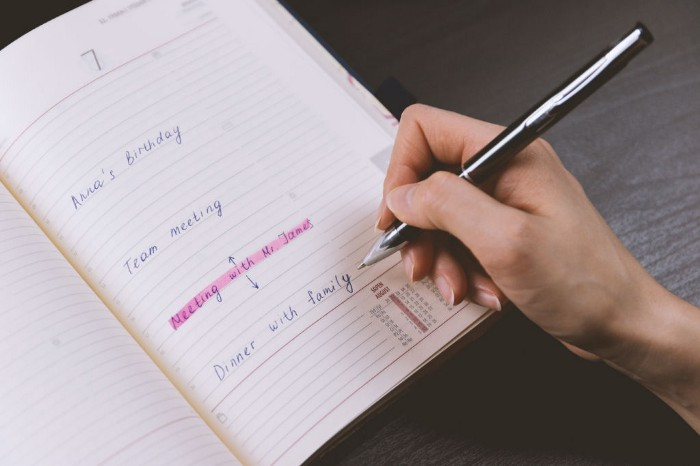
Improving collaboration with the Six Thinking Hats
Six Thinking Hats was written by Dr. Edward de Bono. "Six Thinking Hats" and parallel thinking allow groups to plan thinking processes in a detailed and cohesive way, improving collaboration.
Fundamental ideas
In order to develop strategies for thinking about specific issues, the method assumes that the human brain thinks in a variety of ways that can be intentionally challenged. De Bono identifies six brain-challenging directions. In each direction, the brain brings certain issues into conscious thought (e.g. gut instinct, pessimistic judgement, neutral facts). Some may find wearing hats unnatural, uncomfortable, or counterproductive.
The example of "mismatch" sensitivity is compelling. In the natural world, something out of the ordinary may be dangerous. This mode causes negative judgment and critical thinking.
Colored hats represent each direction. Putting on a colored hat symbolizes changing direction, either literally or metaphorically. De Bono first used this metaphor in his 1971 book "Lateral Thinking for Management" to describe a brainstorming framework. These metaphors allow more complete and elaborate thought separation. Six thinking hats indicate ideas' problems and solutions.
Similarly, his CoRT Thinking Programme introduced "The Five Stages of Thinking" method in 1973.
| HAT | OVERVIEW | TECHNIQUE |
|---|---|---|
| BLUE | "The Big Picture" & Managing | CAF (Consider All Factors); FIP (First Important Priorities) |
| WHITE | "Facts & Information" | Information |
| RED | "Feelings & Emotions" | Emotions and Ego |
| BLACK | "Negative" | PMI (Plus, Minus, Interesting); Evaluation |
| YELLOW | "Positive" | PMI |
| GREEN | "New Ideas" | Concept Challenge; Yes, No, Po |
Strategies and programs
After identifying the six thinking modes, programs can be created. These are groups of hats that encompass and structure the thinking process. Several of these are included in the materials for franchised six hats training, but they must often be adapted. Programs are often "emergent," meaning the group plans the first few hats and the facilitator decides what to do next.
The group agrees on how to think, then thinks, then evaluates the results and decides what to do next. Individuals or groups can use sequences (and indeed hats). Each hat is typically used for 2 minutes at a time, although an extended white hat session is common at the start of a process to get everyone on the same page. The red hat is recommended to be used for a very short period to get a visceral gut reaction – about 30 seconds, and in practice often takes the form of dot-voting.
| ACTIVITY | HAT SEQUENCE |
|---|---|
| Initial Ideas | Blue, White, Green, Blue |
| Choosing between alternatives | Blue, White, (Green), Yellow, Black, Red, Blue |
| Identifying Solutions | Blue, White, Black, Green, Blue |
| Quick Feedback | Blue, Black, Green, Blue |
| Strategic Planning | Blue, Yellow, Black, White, Blue, Green, Blue |
| Process Improvement | Blue, White, White (Other People's Views), Yellow, Black, Green, Red, Blue |
| Solving Problems | Blue, White, Green, Red, Yellow, Black, Green, Blue |
| Performance Review | Blue, Red, White, Yellow, Black, Green, Blue |
Use
Speedo's swimsuit designers reportedly used the six thinking hats. "They used the "Six Thinking Hats" method to brainstorm, with a green hat for creative ideas and a black one for feasibility.
Typically, a project begins with extensive white hat research. Each hat is used for a few minutes at a time, except the red hat, which is limited to 30 seconds to ensure an instinctive gut reaction, not judgement. According to Malcolm Gladwell's "blink" theory, this pace improves thinking.
De Bono believed that the key to a successful Six Thinking Hats session was focusing the discussion on a particular approach. A meeting may be called to review and solve a problem. The Six Thinking Hats method can be used in sequence to explore the problem, develop a set of solutions, and choose a solution through critical examination.
Everyone may don the Blue hat to discuss the meeting's goals and objectives. The discussion may then shift to Red hat thinking to gather opinions and reactions. This phase may also be used to determine who will be affected by the problem and/or solutions. The discussion may then shift to the (Yellow then) Green hat to generate solutions and ideas. The discussion may move from White hat thinking to Black hat thinking to develop solution set criticisms.
Because everyone is focused on one approach at a time, the group is more collaborative than if one person is reacting emotionally (Red hat), another is trying to be objective (White hat), and another is critical of the points which emerge from the discussion (Black hat). The hats help people approach problems from different angles and highlight problem-solving flaws.
(Edited)
More on Leadership

Will Lockett
3 years ago
Tesla recently disclosed its greatest secret.

The VP has revealed a secret that should frighten the rest of the EV world.
Tesla led the EV revolution. Elon Musk's invention offers a viable alternative to gas-guzzlers. Tesla has lost ground in recent years. VW, BMW, Mercedes, and Ford offer EVs with similar ranges, charging speeds, performance, and cost. Tesla's next-generation 4680 battery pack, Roadster, Cybertruck, and Semi were all delayed. CATL offers superior batteries than the 4680. Martin Viecha, Tesla's Vice President, recently told Business Insider something that startled the EV world and will establish Tesla as the EV king.
Viecha mentioned that Tesla's production costs have dropped 57% since 2017. This isn't due to cheaper batteries or devices like Model 3. No, this is due to amazing factory efficiency gains.
Musk wasn't crazy to want a nearly 100% automated production line, and Tesla's strategy of sticking with one model and improving it has paid off. Others change models every several years. This implies they must spend on new R&D, set up factories, and modernize service and parts systems. All of this costs a ton of money and prevents them from refining production to cut expenses.
Meanwhile, Tesla updates its vehicles progressively. Everything from the backseats to the screen has been enhanced in a 2022 Model 3. Tesla can refine, standardize, and cheaply produce every part without changing the production line.
In 2017, Tesla's automobile production averaged $84,000. In 2022, it'll be $36,000.
Mr. Viecha also claimed that new factories in Shanghai and Berlin will be significantly cheaper to operate once fully operating.
Tesla's hand is visible. Tesla selling $36,000 cars for $60,000 This barely beats the competition. Model Y long-range costs just over $60,000. Tesla makes $24,000+ every sale, giving it a 40% profit margin, one of the best in the auto business.
VW I.D4 costs about the same but makes no profit. Tesla's rivals face similar challenges. Their EVs make little or no profit.
Tesla costs the same as other EVs, but they're in a different league.
But don't forget that the battery pack accounts for 40% of an EV's cost. Tesla may soon fully utilize its 4680 battery pack.
The 4680 battery pack has larger cells and a unique internal design. This means fewer cells are needed for a car, making it cheaper to assemble and produce (per kWh). Energy density and charge speeds increase slightly.
Tesla underestimated the difficulty of making this revolutionary new cell. Each time they try to scale up production, quality drops and rejected cells rise.
Tesla recently installed this battery pack in Model Ys and is scaling production. If they succeed, Tesla battery prices will plummet.
Tesla's Model Ys 2170 battery costs $11,000. The same size pack with 4680 cells costs $3,400 less. Once scaled, it could be $5,500 (50%) less. The 4680 battery pack could reduce Tesla production costs by 20%.
With these cost savings, Tesla could sell Model Ys for $40,000 while still making a profit. They could offer a $25,000 car.
Even with new battery technology, it seems like other manufacturers will struggle to make EVs profitable.
Teslas cost about the same as competitors, so don't be fooled. Behind the scenes, they're still years ahead, and the 4680 battery pack and new factories will only increase that lead. Musk faces a first. He could sell Teslas at current prices and make billions while other manufacturers struggle. Or, he could massively undercut everyone and crush the competition once and for all. Tesla and Elon win.

Sammy Abdullah
3 years ago
Payouts to founders at IPO
How much do startup founders make after an IPO? We looked at 2018's major tech IPOs. Paydays aren't what founders took home at the IPO (shares are normally locked up for 6 months), but what they were worth at the IPO price on the day the firm went public. It's not cash, but it's nice. Here's the data.
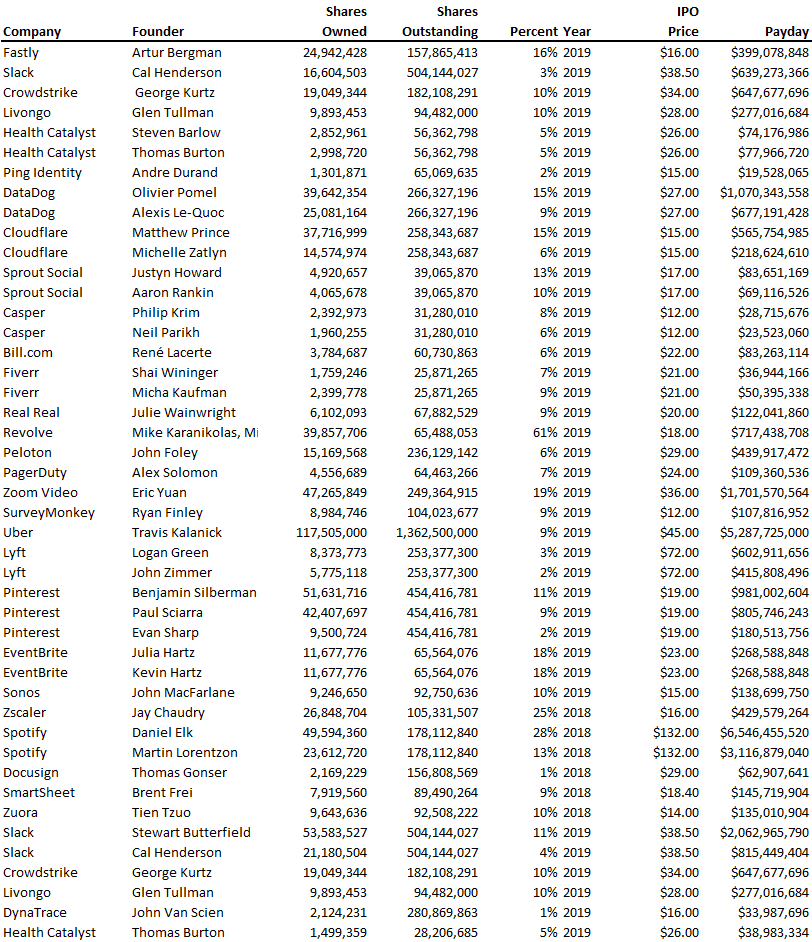
Several points are noteworthy.
Huge payoffs. Median and average pay were $399m and $918m. Average and median homeownership were 9% and 12%.
Coinbase, Uber, UI Path. Uber, Zoom, Spotify, UI Path, and Coinbase founders raised billions. Zoom's founder owned 19% and Spotify's 28% and 13%. Brian Armstrong controlled 20% of Coinbase at IPO and was worth $15bn. Preserving as much equity as possible by staying cash-efficient or raising at high valuations also helps.
The smallest was Ping. Ping's compensation was the smallest. Andre Duand owned 2% but was worth $20m at IPO. That's less than some billion-dollar paydays, but still good.
IPOs can be lucrative, as you can see. Preserving equity could be the difference between a $20mm and $15bln payday (Coinbase).

Trevor Stark
3 years ago
Peter Thiels's Multi-Billion Dollar Net Worth's Unknown Philosopher
Peter Thiel studied philosophy as an undergraduate.
Peter Thiel has $7.36 billion.
Peter is a world-ranked chess player, has a legal degree, and has written profitable novels.
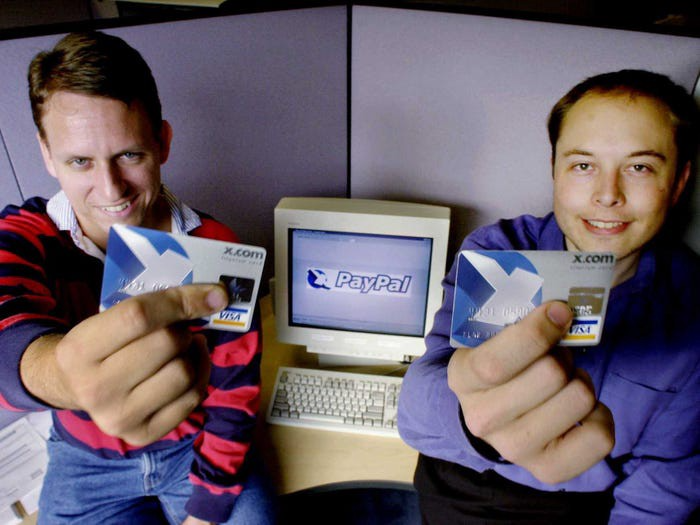
In 1999, he co-founded PayPal with Max Levchin, which merged with X.com.
Peter Thiel made $55 million after selling the company to eBay for $1.5 billion in 2002.
You may be wondering…
How did Peter turn $55 million into his now multi-billion dollar net worth?
One amazing investment?
Facebook.
Thiel was Facebook's first external investor. He bought 10% of the company for $500,000 in 2004.
This investment returned 159% annually, 200x in 8 years.
By 2012, Thiel sold almost all his Facebook shares, becoming a billionaire.
What was the investment thesis of Peter?
This investment appeared ridiculous. Facebook was an innovative startup.
Thiel's $500,000 contribution transformed Facebook.
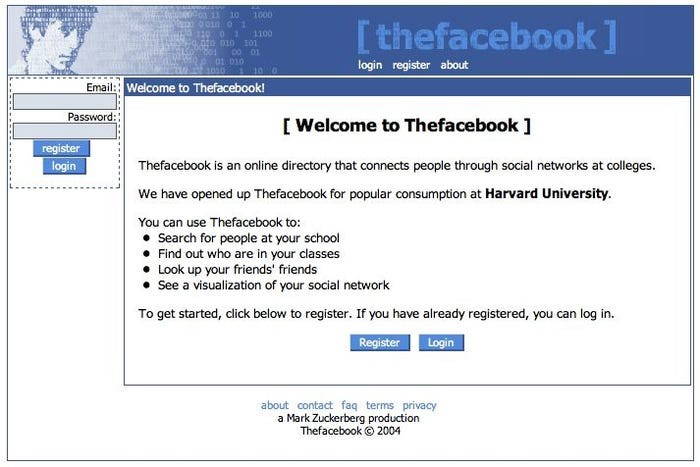
Harvard students have access to Facebook's 8 features and 1 photo per profile.
How did Peter determine that this would be a wise investment, then?
Facebook is a mimetic desire machine.
Social media's popularity is odd. Why peek at strangers' images on a computer?
Peter Thiel studied under French thinker Rene Girard at Stanford.
Mimetic Desire explains social media's success.
Mimetic Desire is the idea that humans desire things simply because other people do.
If nobody wanted it, would you?
Would you desire a family, a luxury car, or expensive clothes if no one else did? Girard says no.
People we admire affect our aspirations because we're social animals. Every person has a role model.
Our nonreligious culture implies role models are increasingly other humans, not God.
The idea explains why social media influencers are so powerful.
Why would Andrew Tate or Kim Kardashian matter if people weren't mimetic?
Humanity is fundamentally motivated by social comparison.
Facebook takes advantage of this need for social comparison, and puts it on a global scale.
It aggregates photographs and updates from millions of individuals.
Facebook mobile allows 24/7 social comparison.
Thiel studied mimetic desire with Girard and realized Facebook exploits the urge for social comparison to gain money.
Social media is more significant and influential than ever, despite Facebook's decline.
Thiel and Girard show that applied philosophy (particularly in business) can be immensely profitable.
You might also like

Todd Lewandowski
3 years ago
DWTS: How to Organize Your To-Do List Quickly
Don't overcomplicate to-do lists. DWTS (Done, Waiting, Top 3, Soon) organizes your to-dos.
How Are You Going to Manage Everything?
Modern America is busy. Work involves meetings. Anytime, Slack communications arrive. Many software solutions offer a @-mention notification capability. Emails.
Work obligations continue. At home, there are friends, family, bills, chores, and fun things.
How are you going to keep track of it all? Enter the todo list. It’s been around forever. It’s likely to stay forever in some way, shape, or form.
Everybody has their own system. You probably modified something from middle school. Post-its? Maybe it’s an app? Maybe both, another system, or none.
I suggest a format that has worked for me in 15 years of professional and personal life.
Try it out and see if it works for you. If not, no worries. You do you! Hopefully though you can learn a thing or two, and I from you too.
It is merely a Google Doc, yes.
It's a giant list. One task per line. Indent subtasks on a new line. Add or move new tasks as needed.
I recommend using Google Docs. It's easy to use and flexible for structuring.
Prioritizing these tasks is key. I organize them using DWTS (Done, Waiting, Top 3, Soon). Chronologically is good because it implicitly provides both a priority (high, medium, low) and an ETA (now, soon, later).
Yes, I recognize the similarities to DWTS (Dancing With The Stars) TV Show. Although I'm not a fan, it's entertaining. The acronym is easy to remember and adds fun to something dull.

What each section contains
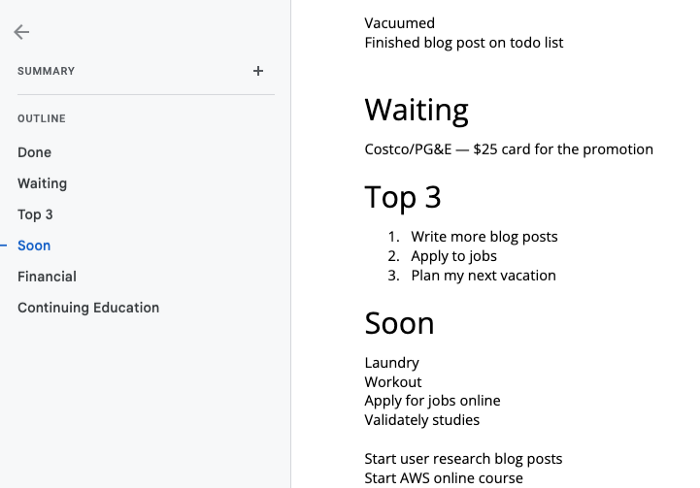
Done
All tasks' endpoint. Finish here. Don't worry about it again.
Waiting
You're blocked and can't continue. Blocked tasks usually need someone. Write Person Task so you know who's waiting.
Blocking tasks shouldn't last long. After a while, remind them kindly. If people don't help you out of kindness, they will if you're persistent.
Top 3
Mental focus areas. These can be short- to mid-term goals or recent accomplishments. 2 to 5 is a good number to stay focused.
Top 3 reminds us to prioritize. If they don't fit your Top 3 goals, delay them.
Every 1:1 at work is a project update. Another chance to list your top 3. You should know your Top 3 well and be able to discuss them confidently.
Soon
Here's your short-term to-do list. Rank them from highest to lowest.
I usually subdivide it with empty lines. First is what I have to do today, then week, then month. Subsections can be arranged however you like.
Inventories by Concept
Tasks that aren’t in your short or medium future go into the backlog.
Eventually you’ll complete these tasks, assign them to someone else, or mark them as “wont’ do” (like done but in another sense).
Backlog tasks don't need to be organized chronologically because their timing and priority may change. Theme-organize them. When planning/strategic, you can choose themes to focus on, so future top 3 topics.
More Tips on Todos
Decide Upon a Morning Goal
Morning routines are universal. Coffee and Wordle. My to-do list is next. Two things:
As needed, update the to-do list: based on the events of yesterday and any fresh priorities.
Pick a few jobs to complete today: Pick a few goals that you know you can complete today. Push the remainder below and move them to the top of the Soon section. I typically select a few tasks I am confident I can complete along with one stretch task that might extend into tomorrow.
Finally. By setting and achieving small goals every day, you feel accomplished and make steady progress on medium and long-term goals.
Tech companies call this a daily standup. Everyone shares what they did yesterday, what they're doing today, and any blockers. The name comes from a tradition of holding meetings while standing up to keep them short. Even though it's virtual, everyone still wants a quick meeting.
Your team may or may not need daily standups. Make a daily review a habit with your coffee.
Review Backwards & Forwards on a regular basis
While you're updating your to-do list daily, take time to review it.
Review your Done list. Remember things you're proud of and things that could have gone better. Your Done list can be long. Archive it so your main to-do list isn't overwhelming.
Future-gaze. What you considered important may no longer be. Reorder tasks. Backlog grooming is a workplace term.
Backwards-and-forwards reviews aren't required often. Every 3-6 months is fine. They help you see the forest as often as the trees.
Final Remarks
Keep your list simple. Done, Waiting, Top 3, Soon. These are the necessary sections. If you like, add more subsections; otherwise, keep it simple.
I recommend a morning review. By having clear goals and an action-oriented attitude, you'll be successful.

Cammi Pham
3 years ago
7 Scientifically Proven Things You Must Stop Doing To Be More Productive
Smarter work yields better results.

17-year-old me worked and studied 20 hours a day. During school breaks, I did coursework and ran a nonprofit at night. Long hours earned me national campaigns, A-list opportunities, and a great career. As I aged, my thoughts changed. Working harder isn't necessarily the key to success.
In some cases, doing less work might lead to better outcomes.
Consider a hard-working small business owner. He can't beat his corporate rivals by working hard. Time's limited. An entrepreneur can work 24 hours a day, 7 days a week, but a rival can invest more money, create a staff, and put in more man hours. Why have small startups done what larger companies couldn't? Facebook paid $1 billion for 13-person Instagram. Snapchat, a 30-person startup, rejected Facebook and Google bids. Luck and efficiency each contributed to their achievement.
The key to success is not working hard. It’s working smart.
Being busy and productive are different. Busy doesn't always equal productive. Productivity is less about time management and more about energy management. Life's work. It's using less energy to obtain more rewards. I cut my work week from 80 to 40 hours and got more done. I value simplicity.
Here are seven activities I gave up in order to be more productive.
1. Give up working extra hours and boost productivity instead.
When did the five-day, 40-hour work week start? Henry Ford, Ford Motor Company founder, experimented with his workers in 1926.
He decreased their daily hours from 10 to 8, and shortened the work week from 6 days to 5. As a result, he saw his workers’ productivity increase.
According to a 1980 Business Roundtable report, Scheduled Overtime Effect on Construction Projects, the more you work, the less effective and productive you become.
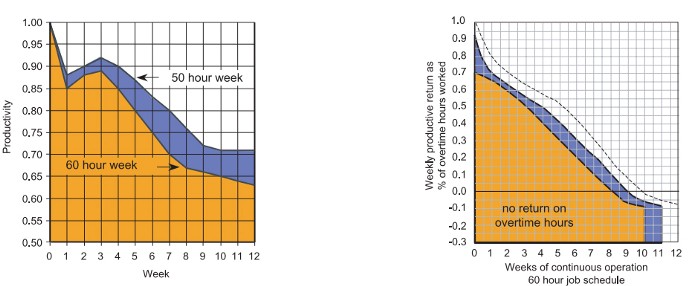
“Where a work schedule of 60 or more hours per week is continued longer than about two months, the cumulative effect of decreased productivity will cause a delay in the completion date beyond that which could have been realized with the same crew size on a 40-hour week.” Source: Calculating Loss of Productivity Due to Overtime Using Published Charts — Fact or Fiction
AlterNet editor Sara Robinson cited US military research showing that losing one hour of sleep per night for a week causes cognitive impairment equivalent to a.10 blood alcohol level. You can get fired for showing up drunk, but an all-nighter is fine.
Irrespective of how well you were able to get on with your day after that most recent night without sleep, it is unlikely that you felt especially upbeat and joyous about the world. Your more-negative-than-usual perspective will have resulted from a generalized low mood, which is a normal consequence of being overtired. More important than just the mood, this mind-set is often accompanied by decreases in willingness to think and act proactively, control impulses, feel positive about yourself, empathize with others, and generally use emotional intelligence. Source: The Secret World of Sleep: The Surprising Science of the Mind at Rest
To be productive, don't overwork and get enough sleep. If you're not productive, lack of sleep may be to blame. James Maas, a sleep researcher and expert, said 7/10 Americans don't get enough sleep.
Did you know?
Leonardo da Vinci slept little at night and frequently took naps.
Napoleon, the French emperor, had no qualms about napping. He splurged every day.
Even though Thomas Edison felt self-conscious about his napping behavior, he regularly engaged in this ritual.
President Franklin D. Roosevelt's wife Eleanor used to take naps before speeches to increase her energy.
The Singing Cowboy, Gene Autry, was known for taking regular naps in his dressing area in between shows.
Every day, President John F. Kennedy took a siesta after eating his lunch in bed.
Every afternoon, oil businessman and philanthropist John D. Rockefeller took a nap in his office.
It was unavoidable for Winston Churchill to take an afternoon snooze. He thought it enabled him to accomplish twice as much each day.
Every afternoon around 3:30, President Lyndon B. Johnson took a nap to divide his day into two segments.
Ronald Reagan, the 40th president, was well known for taking naps as well.
Source: 5 Reasons Why You Should Take a Nap Every Day — Michael Hyatt
Since I started getting 7 to 8 hours of sleep a night, I've been more productive and completed more work than when I worked 16 hours a day. Who knew marketers could use sleep?
2. Refrain from accepting too frequently
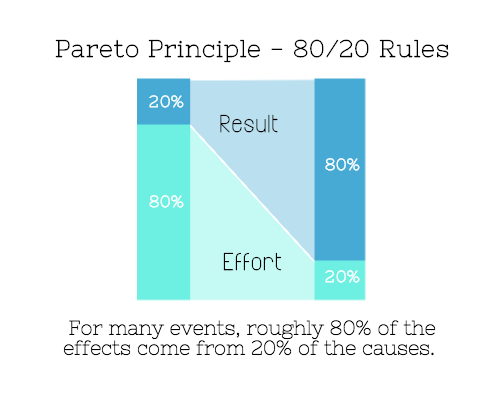
Pareto's principle states that 20% of effort produces 80% of results, but 20% of results takes 80% of effort. Instead of working harder, we should prioritize the initiatives that produce the most outcomes. So we can focus on crucial tasks. Stop accepting unproductive tasks.
“The difference between successful people and very successful people is that very successful people say “no” to almost everything.” — Warren Buffett
What should you accept? Why say no? Consider doing a split test to determine if anything is worth your attention. Track what you do, how long it takes, and the consequences. Then, evaluate your list to discover what worked (or didn't) to optimize future chores.
Most of us say yes more often than we should, out of guilt, overextension, and because it's simpler than no. Nobody likes being awful.
Researchers separated 120 students into two groups for a 2012 Journal of Consumer Research study. One group was educated to say “I can't” while discussing choices, while the other used “I don't”.
The students who told themselves “I can’t eat X” chose to eat the chocolate candy bar 61% of the time. Meanwhile, the students who told themselves “I don’t eat X” chose to eat the chocolate candy bars only 36% of the time. This simple change in terminology significantly improved the odds that each person would make a more healthy food choice.
Next time you need to say no, utilize I don't to encourage saying no to unimportant things.
The 20-second rule is another wonderful way to avoid pursuits with little value. Add a 20-second roadblock to things you shouldn't do or bad habits you want to break. Delete social media apps from your phone so it takes you 20 seconds to find your laptop to access them. You'll be less likely to engage in a draining hobby or habit if you add an inconvenience.
Lower the activation energy for habits you want to adopt and raise it for habits you want to avoid. The more we can lower or even eliminate the activation energy for our desired actions, the more we enhance our ability to jump-start positive change. Source: The Happiness Advantage: The Seven Principles of Positive Psychology That Fuel Success and Performance at Work
3. Stop doing everything yourself and start letting people help you
I once managed a large community and couldn't do it alone. The community took over once I burned out. Members did better than I could have alone. I learned about community and user-generated content.
Consumers know what they want better than marketers. Octoly says user-generated videos on YouTube are viewed 10 times more than brand-generated videos. 51% of Americans trust user-generated material more than a brand's official website (16%) or media coverage (22%). (14 percent). Marketers should seek help from the brand community.
Being a successful content marketer isn't about generating the best content, but cultivating a wonderful community.
We should seek aid when needed. We can't do everything. It's best to delegate work so you may focus on the most critical things. Instead of overworking or doing things alone, let others help.
Having friends or coworkers around can boost your productivity even if they can't help.
Just having friends nearby can push you toward productivity. “There’s a concept in ADHD treatment called the ‘body double,’ ” says David Nowell, Ph.D., a clinical neuropsychologist from Worcester, Massachusetts. “Distractable people get more done when there is someone else there, even if he isn’t coaching or assisting them.” If you’re facing a task that is dull or difficult, such as cleaning out your closets or pulling together your receipts for tax time, get a friend to be your body double. Source: Friendfluence: The Surprising Ways Friends Make Us Who We Are
4. Give up striving for perfection
Perfectionism hinders professors' research output. Dr. Simon Sherry, a psychology professor at Dalhousie University, did a study on perfectionism and productivity. Dr. Sherry established a link between perfectionism and productivity.
Perfectionism has its drawbacks.
They work on a task longer than necessary.
They delay and wait for the ideal opportunity. If the time is right in business, you are already past the point.
They pay too much attention to the details and miss the big picture.
Marketers await the right time. They miss out.
The perfect moment is NOW.
5. Automate monotonous chores instead of continuing to do them.
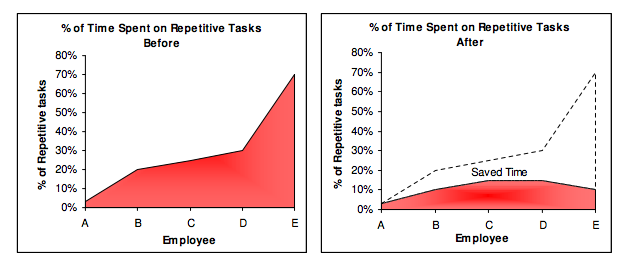
A team of five workers who spent 3%, 20%, 25%, 30%, and 70% of their time on repetitive tasks reduced their time spent to 3%, 10%, 15%, 15%, and 10% after two months of working to improve their productivity.
Last week, I wrote a 15-minute Python program. I wanted to generate content utilizing Twitter API data and Hootsuite to bulk schedule it. Automation has cut this task from a day to five minutes. Whenever I do something more than five times, I try to automate it.
Automate monotonous chores without coding. Skills and resources are nice, but not required. If you cannot build it, buy it.
People forget time equals money. Manual work is easy and requires little investigation. You can moderate 30 Instagram photographs for your UGC campaign. You need digital asset management software to manage 30,000 photographs and movies from five platforms. Filemobile helps individuals develop more user-generated content. You may buy software to manage rich media and address most internet difficulties.
Hire an expert if you can't find a solution. Spend money to make money, and time is your most precious asset.
Visit GitHub or Google Apps Script library, marketers. You may often find free, easy-to-use open source code.
6. Stop relying on intuition and start supporting your choices with data.
You may optimize your life by optimizing webpages for search engines.
Numerous studies might help you boost your productivity. Did you know individuals are most distracted from midday to 4 p.m.? This is what a Penn State psychology professor found. Even if you can't find data on a particular question, it's easy to run a split test and review your own results.
7. Stop working and spend some time doing absolutely nothing.
Most people don't know that being too focused can be destructive to our work or achievements. The Boston Globe's The Power of Lonely says solo time is excellent for the brain and spirit.
One ongoing Harvard study indicates that people form more lasting and accurate memories if they believe they’re experiencing something alone. Another indicates that a certain amount of solitude can make a person more capable of empathy towards others. And while no one would dispute that too much isolation early in life can be unhealthy, a certain amount of solitude has been shown to help teenagers improve their moods and earn good grades in school. Source: The Power of Lonely
Reflection is vital. We find solutions when we're not looking.
We don't become more productive overnight. It demands effort and practice. Waiting for change doesn't work. Instead, learn about your body and identify ways to optimize your energy and time for a happy existence.

The woman
3 years ago
I received a $2k bribe to replace another developer in an interview
I can't believe they’d even think it works!
Developers are usually interviewed before being hired, right? Every organization wants candidates who meet their needs. But they also want to avoid fraud.
There are cheaters in every field. Only two come to mind for the hiring process:
Lying on a resume.
Cheating on an online test.
Recently, I observed another one. One of my coworkers invited me to replace another developer during an online interview! I was astonished, but it’s not new.
The specifics
My ex-colleague recently texted me. No one from your former office will ever approach you after a year unless they need something.
Which was the case. My coworker said his wife needed help as a programmer. I was glad someone asked for my help, but I'm still a junior programmer.
Then he informed me his wife was selected for a fantastic job interview. He said he could help her with the online test, but he needed someone to help with the online interview.
Okay, I guess. Preparing for an online interview is beneficial. But then he said she didn't need to be ready. She needed someone to take her place.
I told him it wouldn't work. Every remote online interview I've ever seen required an open camera.
What followed surprised me. She'd ask to turn off the camera, he said.
I asked why.
He told me if an applicant is unwell, the interviewer may consider an off-camera interview. His wife will say she's sick and prefers no camera.
The plan left me speechless. I declined politely. He insisted and promised $2k if she got the job.
I felt insulted and told him if he persisted, I'd inform his office. I was furious. Later, I apologized and told him to stop.
I'm not sure what they did after that
I'm not sure if they found someone or listened to me. They probably didn't. How would she do the job if she even got it?
It's an internship, he said. With great pay, though. What should an intern do?
I suggested she do the interview alone. Even if she failed, she'd gain confidence and valuable experience.
Conclusion
Many interviewees cheat. My profession is vital to me, thus I'd rather improve my abilities and apply honestly. It's part of my identity.
Am I truthful? Most professionals are not. They fabricate their CVs. Often.
When you support interview cheating, you encourage more cheating! When someone cheats, another qualified candidate may not obtain the job.
One day, that could be you or me.