


How to make a >800 million dollars in crypto attacking the once 3rd largest stablecoin, Soros style
Everyone is talking about the $UST attack right now, including Janet Yellen. But no one is talking about how much money the attacker made (or how brilliant it was). Lets dig in.
Our story starts in late March, when the Luna Foundation Guard (or LFG) starts buying BTC to help back $UST. LFG started accumulating BTC on 3/22, and by March 26th had a $1bn+ BTC position. This is leg #1 that made this trade (or attack) brilliant.
The second leg comes in the form of the 4pool Frax announcement for $UST on April 1st. This added the second leg needed to help execute the strategy in a capital efficient way (liquidity will be lower and then the attack is on).
We don't know when the attacker borrowed 100k BTC to start the position, other than that it was sold into Kwon's buying (still speculation). LFG bought 15k BTC between March 27th and April 11th, so lets just take the average price between these dates ($42k).
So you have a ~$4.2bn short position built. Over the same time, the attacker builds a $1bn OTC position in $UST. The stage is now set to create a run on the bank and get paid on your BTC short. In anticipation of the 4pool, LFG initially removes $150mm from 3pool liquidity.
The liquidity was pulled on 5/8 and then the attacker uses $350mm of UST to drain curve liquidity (and LFG pulls another $100mm of liquidity).
But this only starts the de-pegging (down to 0.972 at the lows). LFG begins selling $BTC to defend the peg, causing downward pressure on BTC while the run on $UST was just getting started.
With the Curve liquidity drained, the attacker used the remainder of their $1b OTC $UST position ($650mm or so) to start offloading on Binance. As withdrawals from Anchor turned from concern into panic, this caused a real de-peg as people fled for the exits
So LFG is selling $BTC to restore the peg while the attacker is selling $UST on Binance. Eventually the chain gets congested and the CEXs suspend withdrawals of $UST, fueling the bank run panic. $UST de-pegs to 60c at the bottom, while $BTC bleeds out.
The crypto community panics as they wonder how much $BTC will be sold to keep the peg. There are liquidations across the board and LUNA pukes because of its redemption mechanism (the attacker very well could have shorted LUNA as well). BTC fell 25% from $42k on 4/11 to $31.3k
So how much did our attacker make? There aren't details on where they covered obviously, but if they are able to cover (or buy back) the entire position at ~$32k, that means they made $952mm on the short.
On the $350mm of $UST curve dumps I don't think they took much of a loss, lets assume 3% or just $11m. And lets assume that all the Binance dumps were done at 80c, thats another $125mm cost of doing business. For a grand total profit of $815mm (bf borrow cost).
BTC was the perfect playground for the trade, as the liquidity was there to pull it off. While having LFG involved in BTC, and foreseeing they would sell to keep the peg (and prevent LUNA from dying) was the kicker.
Lastly, the liquidity being low on 3pool in advance of 4pool allowed the attacker to drain it with only $350mm, causing the broader panic in both BTC and $UST. Any shorts on LUNA would've added a lot of P&L here as well, with it falling -65% since 5/7.
And for the reply guys, yes I know a lot of this involves some speculation & assumptions. But a lot of money was made here either way, and I thought it would be cool to dive into how they did it.
More on Web3 & Crypto

Franz Schrepf
3 years ago
What I Wish I'd Known About Web3 Before Building
Cryptoland rollercoaster

I've lost money in crypto.
Unimportant.
The real issue: I didn’t understand how.
I'm surrounded with winners. To learn more, I created my own NFTs, currency, and DAO.
Web3 is a hilltop castle. Everything is valuable, decentralized, and on-chain.
The castle is Disneyland: beautiful in images, but chaotic with lengthy lines and kids spending too much money on dressed-up animals.
When the throng and businesses are gone, Disneyland still has enchantment.

The Real Story of Web3
NFTs
Scarcity. Scarce NFTs. That's their worth.
Skull. Rare-looking!
Nonsense.
Bored Ape Yacht Club vs. my NFTs?
Marketing.
BAYC is amazing, but not for the reasons people believe. Apecoin and Otherside's art, celebrity following, and innovation? Stunning.
No other endeavor captured the zeitgeist better. Yet how long did you think it took to actually mint the NFTs?
1 hour? Maybe a week for the website?
Minting NFTs is incredibly easy. Kid-friendly. Developers are rare. Think about that next time somebody posts “DevS dO SMt!?”
NFTs will remain popular. These projects are like our Van Goghs and Monets. Still, be wary. It still uses exclusivity and wash selling like the OG art market.
Not all NFTs are art-related.
Soulbound and anonymous NFTs could offer up new use cases. Property rights, privacy-focused ID, open-source project verification. Everything.
NFTs build online trust through ownership.
We just need to evolve from the apes first.
NFTs' superpower is marketing until then.
Crypto currency
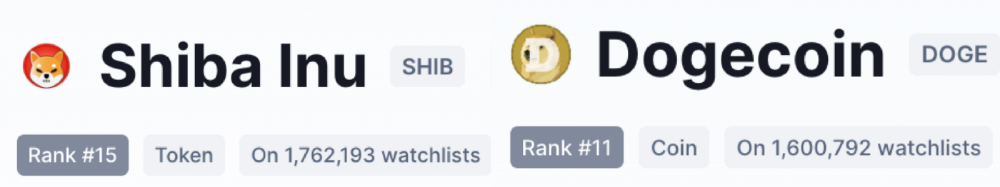
What the hell is a token?
99% of people are clueless.
So I invested in both coins and tokens. Same same. Only that they are not.
Coins have their own blockchain and developer/validator community. It's hard.
Creating a token on top of a blockchain? Five minutes.
Most consumers don’t understand the difference, creating an arbitrage opportunity: pretend you’re a serious project without having developers on your payroll.
Few market sites help. Take a look. See any tokens?
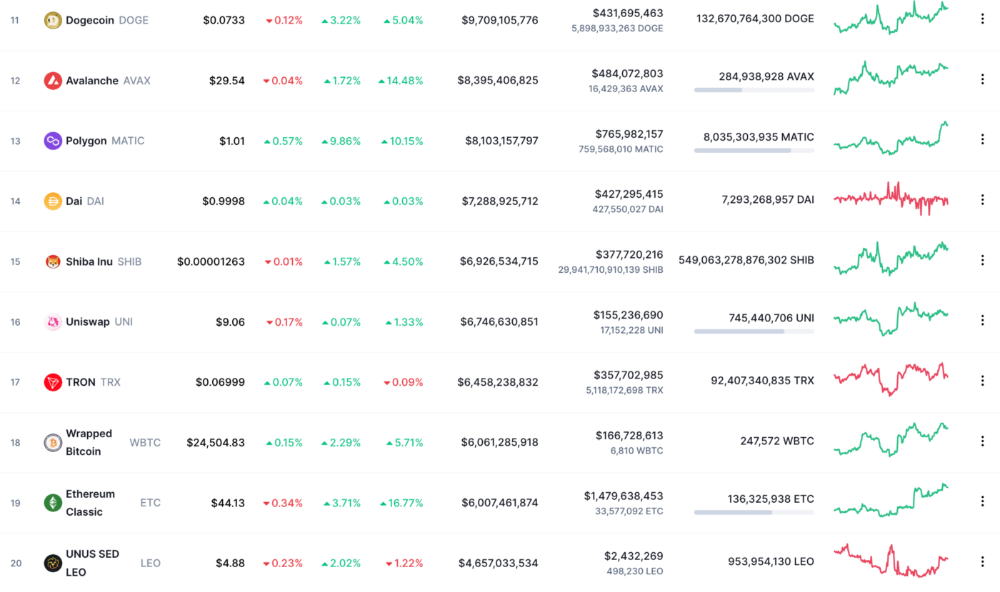
There's a hint one click deeper.
Some tokens are legitimate. Some coins are bad investments.
Tokens are utilized for DAO governance and DApp payments. Still, know who's behind a token. They might be 12 years old.
Coins take time and money. The recent LUNA meltdown indicates that currency investing requires research.
DAOs
Decentralized Autonomous Organizations (DAOs) don't work as you assume.
Yes, members can vote.
A productive organization requires more.
I've observed two types of DAOs.
Total decentralization total dysfunction
Centralized just partially. Community-driven.
A core team executes the DAO's strategy and roadmap in successful DAOs. The community owns part of the organization, votes on decisions, and holds the team accountable.
DAOs are public companies.
Amazing.
A shareholder meeting's logistics are staggering. DAOs may hold anonymous, secure voting quickly. No need for intermediaries like banks to chase up every shareholder.
Successful DAOs aren't totally decentralized. Large-scale voting and collaboration have never been easier.
And that’s all that matters.
Scale, speed.
My Web3 learnings
Disneyland is enchanting. Web3 too.
In a few cycles, NFTs may be used to build trust, not clout. Not speculating with coins. DAOs run organizations, not themselves.
Finally, some final thoughts:
NFTs will be a very helpful tool for building trust online. NFTs are successful now because of excellent marketing.
Tokens are not the same as coins. Look into any project before making a purchase. Make sure it isn't run by three 9-year-olds piled on top of one another in a trench coat, at the very least.
Not entirely decentralized, DAOs. We shall see a future where community ownership becomes the rule rather than the exception once we acknowledge this fact.
Crypto Disneyland is a rollercoaster with loops that make you sick.
Always buckle up.
Have fun!

Vitalik
4 years ago
An approximate introduction to how zk-SNARKs are possible (part 1)
You can make a proof for the statement "I know a secret number such that if you take the word ‘cow', add the number to the end, and SHA256 hash it 100 million times, the output starts with 0x57d00485aa". The verifier can verify the proof far more quickly than it would take for them to run 100 million hashes themselves, and the proof would also not reveal what the secret number is.
In the context of blockchains, this has 2 very powerful applications: Perhaps the most powerful cryptographic technology to come out of the last decade is general-purpose succinct zero knowledge proofs, usually called zk-SNARKs ("zero knowledge succinct arguments of knowledge"). A zk-SNARK allows you to generate a proof that some computation has some particular output, in such a way that the proof can be verified extremely quickly even if the underlying computation takes a very long time to run. The "ZK" part adds an additional feature: the proof can keep some of the inputs to the computation hidden.
You can make a proof for the statement "I know a secret number such that if you take the word ‘cow', add the number to the end, and SHA256 hash it 100 million times, the output starts with 0x57d00485aa". The verifier can verify the proof far more quickly than it would take for them to run 100 million hashes themselves, and the proof would also not reveal what the secret number is.
In the context of blockchains, this has two very powerful applications:
- Scalability: if a block takes a long time to verify, one person can verify it and generate a proof, and everyone else can just quickly verify the proof instead
- Privacy: you can prove that you have the right to transfer some asset (you received it, and you didn't already transfer it) without revealing the link to which asset you received. This ensures security without unduly leaking information about who is transacting with whom to the public.
But zk-SNARKs are quite complex; indeed, as recently as in 2014-17 they were still frequently called "moon math". The good news is that since then, the protocols have become simpler and our understanding of them has become much better. This post will try to explain how ZK-SNARKs work, in a way that should be understandable to someone with a medium level of understanding of mathematics.
Why ZK-SNARKs "should" be hard
Let us take the example that we started with: we have a number (we can encode "cow" followed by the secret input as an integer), we take the SHA256 hash of that number, then we do that again another 99,999,999 times, we get the output, and we check what its starting digits are. This is a huge computation.
A "succinct" proof is one where both the size of the proof and the time required to verify it grow much more slowly than the computation to be verified. If we want a "succinct" proof, we cannot require the verifier to do some work per round of hashing (because then the verification time would be proportional to the computation). Instead, the verifier must somehow check the whole computation without peeking into each individual piece of the computation.
One natural technique is random sampling: how about we just have the verifier peek into the computation in 500 different places, check that those parts are correct, and if all 500 checks pass then assume that the rest of the computation must with high probability be fine, too?
Such a procedure could even be turned into a non-interactive proof using the Fiat-Shamir heuristic: the prover computes a Merkle root of the computation, uses the Merkle root to pseudorandomly choose 500 indices, and provides the 500 corresponding Merkle branches of the data. The key idea is that the prover does not know which branches they will need to reveal until they have already "committed to" the data. If a malicious prover tries to fudge the data after learning which indices are going to be checked, that would change the Merkle root, which would result in a new set of random indices, which would require fudging the data again... trapping the malicious prover in an endless cycle.
But unfortunately there is a fatal flaw in naively applying random sampling to spot-check a computation in this way: computation is inherently fragile. If a malicious prover flips one bit somewhere in the middle of a computation, they can make it give a completely different result, and a random sampling verifier would almost never find out.
It only takes one deliberately inserted error, that a random check would almost never catch, to make a computation give a completely incorrect result.
If tasked with the problem of coming up with a zk-SNARK protocol, many people would make their way to this point and then get stuck and give up. How can a verifier possibly check every single piece of the computation, without looking at each piece of the computation individually? There is a clever solution.
see part 2

Faisal Khan
2 years ago
4 typical methods of crypto market manipulation

Market fraud
Due to its decentralized and fragmented character, the crypto market has integrity difficulties.
Cryptocurrencies are an immature sector, therefore market manipulation becomes a bigger issue. Many research have attempted to uncover these abuses. CryptoCompare's newest one highlights some of the industry's most typical scams.
Why are these concerns so common in the crypto market? First, even the largest centralized exchanges remain unregulated due to industry immaturity. A low-liquidity market segment makes an attack more harmful. Finally, market surveillance solutions not implemented reduce transparency.
In CryptoCompare's latest exchange benchmark, 62.4% of assessed exchanges had a market surveillance system, although only 18.1% utilised an external solution. To address market integrity, this measure must improve dramatically. Before discussing the report's malpractices, note that this is not a full list of attacks and hacks.
Clean Trading
An investor buys and sells concurrently to increase the asset's price. Centralized and decentralized exchanges show this misconduct. 23 exchanges have a volume-volatility correlation < 0.1 during the previous 100 days, according to CryptoCompares. In August 2022, Exchange A reported $2.5 trillion in artificial and/or erroneous volume, up from $33.8 billion the month before.
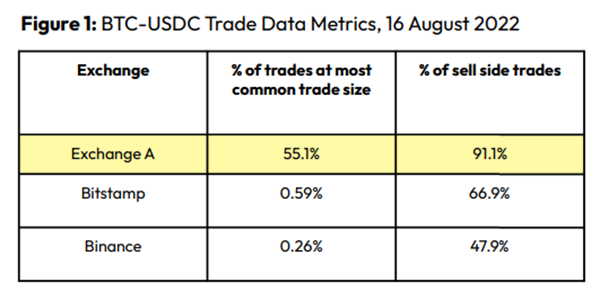
Spoofing
Criminals create and cancel fake orders before they can be filled. Since manipulators can hide in larger trading volumes, larger exchanges have more spoofing. A trader placed a 20.8 BTC ask order at $19,036 when BTC was trading at $19,043. BTC declined 0.13% to $19,018 in a minute. At 18:48, the trader canceled the ask order without filling it.

Front-Running
Most cryptocurrency front-running involves inside trading. Traditional stock markets forbid this. Since most digital asset information is public, this is harder. Retailers could utilize bots to front-run.
CryptoCompare found digital wallets of people who traded like insiders on exchange listings. The figure below shows excess cumulative anomalous returns (CAR) before a coin listing on an exchange.
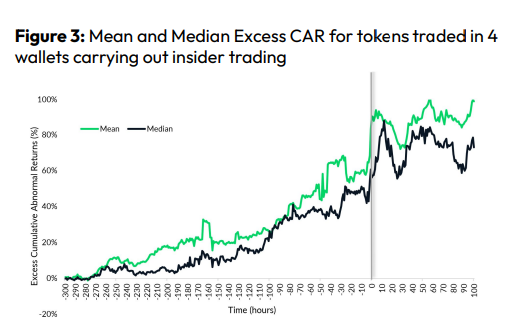
Finally, LAYERING is a sequence of spoofs in which successive orders are put along a ladder of greater (layering offers) or lower (layering bids) values. The paper concludes with recommendations to mitigate market manipulation. Exchange data transparency, market surveillance, and regulatory oversight could reduce manipulative tactics.
You might also like

B Kean
3 years ago
To prove his point, Putin is prepared to add 200,000 more dead soldiers.
What does Ukraine's murderous craziness mean?

Vladimir Putin expressed his patience to Israeli Prime Minister Naftali Bennet. Thousands, even hundreds of thousands of young and middle-aged males in his country have no meaning to him.
During a meeting in March with Prime Minister Naftali Bennett of Israel, Mr. Putin admitted that the Ukrainians were tougher “than I was told,” according to two people familiar with the exchange. “This will probably be much more difficult than we thought. But the war is on their territory, not ours. We are a big country and we have patience (The Inside Story of a Catastrophe).”
Putin should explain to Russian mothers how patient he is with his invasion of Ukraine.
Putin is rich. Even while sanctions have certainly limited Putin's access to his fortune, he has access to everything in Russia. Unlimited wealth.
The Russian leader's infrastructure was designed with his whims in mind. Vladimir Putin is one of the wealthiest and most catered-to people alive. He's also all-powerful, as his lack of opposition shows. His incredible wealth and power have isolated him from average people so much that he doesn't mind turning lives upside down to prove a point.
For many, losing a Russian spouse or son is painful. Whether the soldier was a big breadwinner or unemployed, the loss of a male figure leaves many families bewildered and anxious. Putin, Russia's revered president, seems unfazed.
People who know Mr. Putin say he is ready to sacrifice untold lives and treasure for as long as it takes, and in a rare face-to-face meeting with the Americans last month the Russians wanted to deliver a stark message to President Biden: No matter how many Russian soldiers are killed or wounded on the battlefield, Russia will not give up (The Inside Story of a Catastrophe).
Imagine a country's leader publicly admitting a mistake he's made. Imagine getting Putin's undivided attention.
So, I underestimated Ukrainians. I can't allow them make me appear terrible, so I'll utilize as many drunken dopes as possible to cover up my error. They'll die fulfilled and heroic.
Russia's human resources are limited, but its willingness to cause suffering is not. How many Russian families must die before the curse is broken? If mass protests started tomorrow, Russia's authorities couldn't stop them.
When Moscovites faced down tanks in August 1991, the Gorbachev coup ended in three days. Even though few city residents showed up, everything collapsed. This wicked disaster won't require many Russians.
One NATO member is warning allies that Mr. Putin is ready to accept the deaths or injuries of as many as 300,000 Russian troops — roughly three times his estimated losses so far.
If 100,000 Russians have died in Ukraine and Putin doesn't mind another 200,000 dying, why don't these 200,000 ghosts stand up and save themselves? Putin plays the role of concerned and benevolent leader effectively, but things aren't going well for Russia.
What would 300,000 or more missing men signify for Russia's future? How many kids will have broken homes? How many families won't form, and what will the economy do?
Putin reportedly cared about his legacy. His place in Russian history Putin's invasion of Ukraine settled his legacy. He has single-handedly weakened and despaired Russia since the 1980s.
Putin will be viewed by sensible people as one of Russia's worst adversaries, but Russians will think he was fantastic despite Ukraine.
The more setbacks Mr. Putin endures on the battlefield, the more fears grow over how far he is willing to go. He has killed tens of thousands in Ukraine, leveled cities, and targeted civilians for maximum pain — obliterating hospitals, schools, and apartment buildings while cutting off power and water to millions before winter. Each time Ukrainian forces score a major blow against Russia, the bombing of their country intensifies. And Mr. Putin has repeatedly reminded the world that he can use anything at his disposal, including nuclear arms, to pursue his notion of victory.
How much death and damage will there be in Ukraine if Putin sends 200,000 more Russians to the front? It's scary, sad, and sick.
Monster.

Rachel Greenberg
3 years ago
The Unsettling Fact VC-Backed Entrepreneurs Don't Want You to Know
What they'll do is scarier.

My acquaintance recently joined a VC-funded startup. Money, equity, and upside possibilities were nice, but he had a nagging dread.
They just secured a $40M round and are hiring like crazy to prepare for their IPO in two years. All signals pointed to this startup's (a B2B IT business in a stable industry) success, and its equity-holding workers wouldn't pass that up.
Five months after starting the work, my friend struggled with leaving. We might overlook the awful culture and long hours at the proper price. This price plus the company's fate and survival abilities sent my friend departing in an unpleasant unplanned resignation before jumping on yet another sinking ship.
This affects founders. This affects VC-backed companies (and all businesses). This affects anyone starting, buying, or running a business.
Here's the under-the-table approach that's draining VC capital, leaving staff terrified (or jobless), founders rattled, and investors upset. How to recognize, solve, and avoid it
The unsettling reality behind door #1
You can't raise money off just your looks, right? If "looks" means your founding team's expertise, then maybe. In my friend's case, the founding team's strong qualifications and track records won over investors before talking figures.
They're hardly the only startup to raise money without a profitable customer acquisition strategy. Another firm raised money for an expensive sleep product because it's eco-friendly. They were off to the races with a few keywords and key players.
Both companies, along with numerous others, elected to invest on product development first. Company A employed all the tech, then courted half their market (they’re a tech marketplace that connects two parties). Company B spent millions on R&D to create a palatable product, then flooded the world with marketing.
My friend is on Company B's financial team, and he's seen where they've gone wrong. It's terrible.
Company A (tech market): Growing? Not quite. To achieve the ambitious expansion they (and their investors) demand, they've poured much of their little capital into salespeople: Cold-calling commission and salary salesmen. Is it working? Considering attrition and companies' dwindling capital, I don't think so.
Company B (green sleep) has been hiring, digital marketing, and opening new stores like crazy. Growing expenses should result in growing revenues and a favorable return on investment; if you grow too rapidly, you may neglect to check that ROI.
Once Company A cut headcount and Company B declared “going concerned”, my friend realized both startups had the same ailment and didn't recognize it.
I shouldn't have to ask a friend to verify a company's cash reserves and profitability to spot a financial problem. It happened anyhow.
The frightening part isn't that investors were willing to invest millions without product-market fit, CAC, or LTV estimates. That's alarming, but not as scary as the fact that startups aren't understanding the problem until VC rounds have dried up.
When they question consultants if their company will be around in 6 months. It’s a red flag. How will they stretch $20M through a 2-year recession with a $3M/month burn rate and no profitability? Alarms go off.
Who's in danger?
In a word, everyone who raised money without a profitable client acquisition strategy or enough resources to ride out dry spells.
Money mismanagement and poor priorities affect every industry (like sinking all your capital into your product, team, or tech, at the expense of probing what customer acquisition really takes and looks like).
This isn't about tech, real estate, or recession-proof luxury products. Fast, cheap, easy money flows into flashy-looking teams with buzzwords, trending industries, and attractive credentials.
If these companies can't show progress or get a profitable CAC, they can't raise more money. They die if they can't raise more money (or slash headcount and find shoestring budget solutions until they solve the real problem).
The kiss of death (and how to avoid it)
If you're running a startup and think raising VC is the answer, pause and evaluate. Do you need the money now?
I'm not saying VC is terrible or has no role. Founders have used it as a Band-Aid for larger, pervasive problems. Venture cash isn't a crutch for recruiting consumers profitably; it's rocket fuel to get you what and who you need.
Pay-to-play isn't a way to throw money at the wall and hope for a return. Pay-to-play works until you run out of money, and if you haven't mastered client acquisition, your cash will diminish quickly.
How can you avoid this bottomless pit? Tips:
Understand your burn rate
Keep an eye on your growth or profitability.
Analyze each and every marketing channel and initiative.
Make lucrative customer acquisition strategies and satisfied customers your top two priorities. not brand-new products. not stellar hires. avoid the fundraising rollercoaster to save time. If you succeed in these two tasks, investors will approach you with their thirsty offers rather than the other way around, and your cash reserves won't diminish as a result.
Not as much as your grandfather
My family friend always justified expensive, impractical expenditures by saying it was only monopoly money. In business, startups, and especially with money from investors expecting a return, that's not true.
More founders could understand that there isn't always another round if they viewed VC money as their own limited pool. When the well runs dry, you must refill it or save the day.
Venture financing isn't your grandpa's money. A discerning investor has entrusted you with dry powder in the hope that you'll use it wisely, strategically, and thoughtfully. Use it well.

Jari Roomer
3 years ago
Successful people have this one skill.
Without self-control, you'll waste time chasing dopamine fixes.
I found a powerful quote in Tony Robbins' Awaken The Giant Within:
“Most of the challenges that we have in our personal lives come from a short-term focus” — Tony Robbins
Most people are short-term oriented, but highly successful people are long-term oriented.
Successful people act in line with their long-term goals and values, while the rest are distracted by short-term pleasures and dopamine fixes.
Instant gratification wrecks lives
Instant pleasure is fleeting. Quickly fading effects leave you craving more stimulation.
Before you know it, you're in a cycle of quick fixes. This explains binging on food, social media, and Netflix.
These things cause a dopamine spike, which is entertaining. This dopamine spike crashes quickly, leaving you craving more stimulation.
It's fine to watch TV or play video games occasionally. Problems arise when brain impulses aren't controlled. You waste hours chasing dopamine fixes.
Instant gratification becomes problematic when it interferes with long-term goals, happiness, and life fulfillment.
Most rewarding things require delay
Life's greatest rewards require patience and delayed gratification. They must be earned through patience, consistency, and effort.
Ex:
A fit, healthy body
A deep connection with your spouse
A thriving career/business
A healthy financial situation
These are some of life's most rewarding things, but they take work and patience. They all require the ability to delay gratification.
To have a healthy bank account, you must save (and invest) a large portion of your monthly income. This means no new tech or clothes.
If you want a fit, healthy body, you must eat better and exercise three times a week. So no fast food and Netflix.
It's a battle between what you want now and what you want most.
Successful people choose what they want most over what they want now. It's a major difference.
Instant vs. delayed gratification
Most people subconsciously prefer instant rewards over future rewards, even if the future rewards are more significant.
We humans aren't logical. Emotions and instincts drive us. So we act against our goals and values.
Fortunately, instant gratification bias can be overridden. This is a modern superpower. Effective methods include:
#1: Train your brain to handle overstimulation
Training your brain to function without constant stimulation is a powerful change. Boredom can lead to long-term rewards.
Unlike impulsive shopping, saving money is boring. Having lots of cash is amazing.
Compared to video games, deep work is boring. A successful online business is rewarding.
Reading books is boring compared to scrolling through funny videos on social media. Knowledge is invaluable.
You can't do these things if your brain is overstimulated. Your impulses will control you. To reduce overstimulation addiction, try:
Daily meditation (10 minutes is enough)
Daily study/work for 90 minutes (no distractions allowed)
First hour of the day without phone, social media, and Netflix
Nature walks, journaling, reading, sports, etc.
#2: Make Important Activities Less Intimidating
Instant gratification helps us cope with stress. Starting a book or business can be intimidating. Video games and social media offer a quick escape in such situations.
Make intimidating tasks less so. Break them down into small tasks. Start a new business/side-hustle by:
Get domain name
Design website
Write out a business plan
Research competition/peers
Approach first potential client
Instead of one big mountain, divide it into smaller sub-tasks. This makes a task easier and less intimidating.
#3: Plan ahead for important activities
Distractions will invade unplanned time. Your time is dictated by your impulses, which are usually Netflix, social media, fast food, and video games. It wants quick rewards and dopamine fixes.
Plan your days and be proactive with your time. Studies show that scheduling activities makes you 3x more likely to do them.
To achieve big goals, you must plan. Don't gamble.
Want to get fit? Schedule next week's workouts. Want a side-job? Schedule your work time.