


How to make a >800 million dollars in crypto attacking the once 3rd largest stablecoin, Soros style
Everyone is talking about the $UST attack right now, including Janet Yellen. But no one is talking about how much money the attacker made (or how brilliant it was). Lets dig in.
Our story starts in late March, when the Luna Foundation Guard (or LFG) starts buying BTC to help back $UST. LFG started accumulating BTC on 3/22, and by March 26th had a $1bn+ BTC position. This is leg #1 that made this trade (or attack) brilliant.
The second leg comes in the form of the 4pool Frax announcement for $UST on April 1st. This added the second leg needed to help execute the strategy in a capital efficient way (liquidity will be lower and then the attack is on).
We don't know when the attacker borrowed 100k BTC to start the position, other than that it was sold into Kwon's buying (still speculation). LFG bought 15k BTC between March 27th and April 11th, so lets just take the average price between these dates ($42k).
So you have a ~$4.2bn short position built. Over the same time, the attacker builds a $1bn OTC position in $UST. The stage is now set to create a run on the bank and get paid on your BTC short. In anticipation of the 4pool, LFG initially removes $150mm from 3pool liquidity.
The liquidity was pulled on 5/8 and then the attacker uses $350mm of UST to drain curve liquidity (and LFG pulls another $100mm of liquidity).
But this only starts the de-pegging (down to 0.972 at the lows). LFG begins selling $BTC to defend the peg, causing downward pressure on BTC while the run on $UST was just getting started.
With the Curve liquidity drained, the attacker used the remainder of their $1b OTC $UST position ($650mm or so) to start offloading on Binance. As withdrawals from Anchor turned from concern into panic, this caused a real de-peg as people fled for the exits
So LFG is selling $BTC to restore the peg while the attacker is selling $UST on Binance. Eventually the chain gets congested and the CEXs suspend withdrawals of $UST, fueling the bank run panic. $UST de-pegs to 60c at the bottom, while $BTC bleeds out.
The crypto community panics as they wonder how much $BTC will be sold to keep the peg. There are liquidations across the board and LUNA pukes because of its redemption mechanism (the attacker very well could have shorted LUNA as well). BTC fell 25% from $42k on 4/11 to $31.3k
So how much did our attacker make? There aren't details on where they covered obviously, but if they are able to cover (or buy back) the entire position at ~$32k, that means they made $952mm on the short.
On the $350mm of $UST curve dumps I don't think they took much of a loss, lets assume 3% or just $11m. And lets assume that all the Binance dumps were done at 80c, thats another $125mm cost of doing business. For a grand total profit of $815mm (bf borrow cost).
BTC was the perfect playground for the trade, as the liquidity was there to pull it off. While having LFG involved in BTC, and foreseeing they would sell to keep the peg (and prevent LUNA from dying) was the kicker.
Lastly, the liquidity being low on 3pool in advance of 4pool allowed the attacker to drain it with only $350mm, causing the broader panic in both BTC and $UST. Any shorts on LUNA would've added a lot of P&L here as well, with it falling -65% since 5/7.
And for the reply guys, yes I know a lot of this involves some speculation & assumptions. But a lot of money was made here either way, and I thought it would be cool to dive into how they did it.
More on Web3 & Crypto

Henrique Centieiro
4 years ago
DAO 101: Everything you need to know
Maybe you'll work for a DAO next! Over $1 Billion in NFTs in the Flamingo DAO Another DAO tried to buy the NFL team Denver Broncos. The UkraineDAO raised over $7 Million for Ukraine. The PleasrDAO paid $4m for a Wu-Tang Clan album that belonged to the “pharma bro.”
DAOs move billions and employ thousands. So learn what a DAO is, how it works, and how to create one!
DAO? So, what? Why is it better?
A Decentralized Autonomous Organization (DAO). Some people like to also refer to it as Digital Autonomous Organization, but I prefer the former.
They are virtual organizations. In the real world, you have organizations or companies right? These firms have shareholders and a board. Usually, anyone with authority makes decisions. It could be the CEO, the Board, or the HIPPO. If you own stock in that company, you may also be able to influence decisions. It's now possible to do something similar but much better and more equitable in the cryptocurrency world.
This article informs you:
DAOs- What are the most common DAOs, their advantages and disadvantages over traditional companies? What are they if any?
Is a DAO legally recognized?
How secure is a DAO?
I’m ready whenever you are!
A DAO is a type of company that is operated by smart contracts on the blockchain. Smart contracts are computer code that self-executes our commands. Those contracts can be any. Most second-generation blockchains support smart contracts. Examples are Ethereum, Solana, Polygon, Binance Smart Chain, EOS, etc. I think I've gone off topic. Back on track. Now let's go!
Unlike traditional corporations, DAOs are governed by smart contracts. Unlike traditional company governance, DAO governance is fully transparent and auditable. That's one of the things that sets it apart. The clarity!
A DAO, like a traditional company, has one major difference. In other words, it is decentralized. DAOs are more ‘democratic' than traditional companies because anyone can vote on decisions. Anyone! In a DAO, we (you and I) make the decisions, not the top-shots. We are the CEO and investors. A DAO gives its community members power. We get to decide.
As long as you are a stakeholder, i.e. own a portion of the DAO tokens, you can participate in the DAO. Tokens are open to all. It's just a matter of exchanging it. Ownership of DAO tokens entitles you to exclusive benefits such as governance, voting, and so on. You can vote for a move, a plan, or the DAO's next investment. You can even pitch for funding. Any ‘big' decision in a DAO requires a vote from all stakeholders. In this case, ‘token-holders'! In other words, they function like stock.
What are the 5 DAO types?
Different DAOs exist. We will categorize decentralized autonomous organizations based on their mode of operation, structure, and even technology. Here are a few. You've probably heard of them:
1. DeFi DAO
These DAOs offer DeFi (decentralized financial) services via smart contract protocols. They use tokens to vote protocol and financial changes. Uniswap, Aave, Maker DAO, and Olympus DAO are some examples. Most DAOs manage billions.
Maker DAO was one of the first protocols ever created. It is a decentralized organization on the Ethereum blockchain that allows cryptocurrency lending and borrowing without a middleman.
Maker DAO issues DAI, a stable coin. DAI is a top-rated USD-pegged stable coin.
Maker DAO has an MKR token. These token holders are in charge of adjusting the Dai stable coin policy. Simply put, MKR tokens represent DAO “shares”.
2. Investment DAO
Investors pool their funds and make investment decisions. Investing in new businesses or art is one example. Investment DAOs help DeFi operations pool capital. The Meta Cartel DAO is a community of people who want to invest in new projects built on the Ethereum blockchain. Instead of investing one by one, they want to pool their resources and share ideas on how to make better financial decisions.
Other investment DAOs include the LAO and Friends with Benefits.
3. DAO Grant/Launchpad
In a grant DAO, community members contribute funds to a grant pool and vote on how to allocate and distribute them. These DAOs fund new DeFi projects. Those in need only need to apply. The Moloch DAO is a great Grant DAO. The tokens are used to allocate capital. Also see Gitcoin and Seedify.
4. DAO Collector
I debated whether to put it under ‘Investment DAO' or leave it alone. It's a subset of investment DAOs. This group buys non-fungible tokens, artwork, and collectibles. The market for NFTs has recently exploded, and it's time to investigate. The Pleasr DAO is a collector DAO. One copy of Wu-Tang Clan's "Once Upon a Time in Shaolin" cost the Pleasr DAO $4 million. Pleasr DAO is known for buying Doge meme NFT. Collector DAOs include the Flamingo, Mutant Cats DAO, and Constitution DAOs. Don't underestimate their websites' "childish" style. They have millions.
5. Social DAO
These are social networking and interaction platforms. For example, Decentraland DAO and Friends With Benefits DAO.
What are the DAO Benefits?
Here are some of the benefits of a decentralized autonomous organization:
- They are trustless. You don’t need to trust a CEO or management team
- It can’t be shut down unless a majority of the token holders agree. The government can't shut - It down because it isn't centralized.
- It's fully democratic
- It is open-source and fully transparent.
What about DAO drawbacks?
We've been saying DAOs are the bomb? But are they really the shit? What could go wrong with DAO?
DAOs may contain bugs. If they are hacked, the results can be catastrophic.
No trade secrets exist. Because the smart contract is transparent and coded on the blockchain, it can be copied. It may be used by another organization without credit. Maybe DAOs should use Secret, Oasis, or Horizen blockchain networks.
Are DAOs legally recognized??
In most counties, DAO regulation is inexistent. It's unclear. Most DAOs don’t have a legal personality. The Howey Test and the Securities Act of 1933 determine whether DAO tokens are securities. Although most countries follow the US, this is only considered for the US. Wyoming became the first state to recognize DAOs as legal entities in July 2021 after passing a DAO bill. DAOs registered in Wyoming are thus legally recognized as business entities in the US and thus receive the same legal protections as a Limited Liability Company.
In terms of cyber-security, how secure is a DAO?
Blockchains are secure. However, smart contracts may have security flaws or bugs. This can be avoided by third-party smart contract reviews, testing, and auditing
Finally, Decentralized Autonomous Organizations are timeless. Let us examine the current situation: Ukraine's invasion. A DAO was formed to help Ukrainian troops fighting the Russians. It was named Ukraine DAO. Pleasr DAO, NFT studio Trippy Labs, and Russian art collective Pussy Riot organized this fundraiser. Coindesk reports that over $3 million has been raised in Ethereum-based tokens. AidForUkraine, a DAO aimed at supporting Ukraine's defense efforts, has launched. Accepting Solana token donations. They are fully transparent, uncensorable, and can’t be shut down or sanctioned.
DAOs are undeniably the future of blockchain. Everyone is paying attention. Personally, I believe traditional companies will soon have to choose between adapting or being left behind.
Long version of this post: https://medium.datadriveninvestor.com/dao-101-all-you-need-to-know-about-daos-275060016663

Jeff John Roberts
4 years ago
Jack Dorsey and Jay-Z Launch 'Bitcoin Academy' in Brooklyn rapper's home
The new Bitcoin Academy will teach Jay-Marcy Z's Houses neighbors "What is Cryptocurrency."
Jay-Z grew up in Brooklyn's Marcy Houses. The rapper and Block CEO Jack Dorsey are giving back to his hometown by creating the Bitcoin Academy.
The Bitcoin Academy will offer online and in-person classes, including "What is Money?" and "What is Blockchain?"
The program will provide participants with a mobile hotspot and a small amount of Bitcoin for hands-on learning.
Students will receive dinner and two evenings of instruction until early September. The Shawn Carter Foundation will help with on-the-ground instruction.
Jay-Z and Dorsey announced the program Thursday morning. It will begin at Marcy Houses but may be expanded.
Crypto Blockchain Plug and Black Bitcoin Billionaire, which has received a grant from Block, will teach the classes.
Jay-Z, Dorsey reunite
Jay-Z and Dorsey have previously worked together to promote a Bitcoin and crypto-based future.
In 2021, Dorsey's Block (then Square) acquired the rapper's streaming music service Tidal, which they propose using for NFT distribution.
Dorsey and Jay-Z launched an endowment in 2021 to fund Bitcoin development in Africa and India.
Dorsey is funding the new Bitcoin Academy out of his own pocket (as is Jay-Z), but he's also pushed crypto-related charitable endeavors at Block, including a $5 million fund backed by corporate Bitcoin interest.
This post is a summary. Read full article here

Stephen Moore
3 years ago
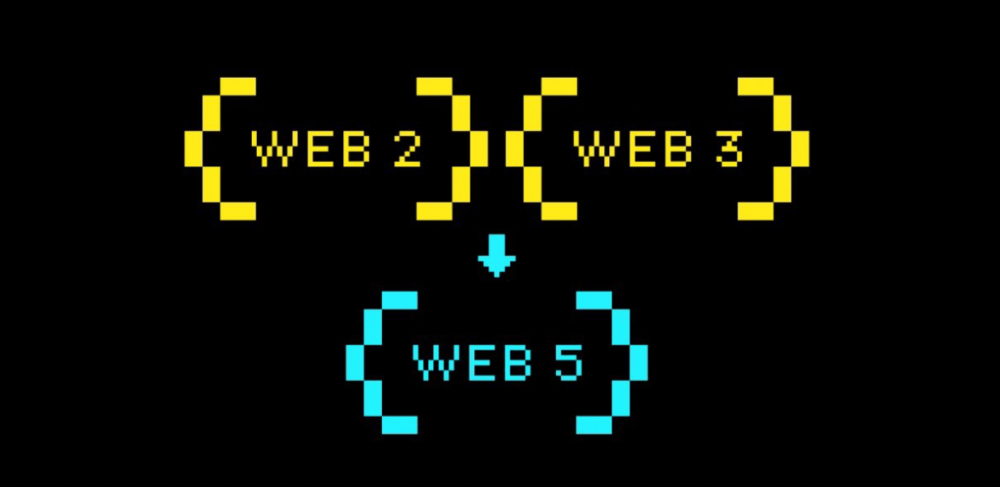
Web 2 + Web 3 = Web 5.
Monkey jpegs and shitcoins have tarnished Web3's reputation. Let’s move on.
Web3 was called "the internet's future."
Well, 'crypto bros' shouted about it loudly.
As quickly as it arrived to be the next internet, it appears to be dead. It's had scandals, turbulence, and crashes galore:
Web 3.0's cryptocurrencies have crashed. Bitcoin's all-time high was $66,935. This month, Ethereum fell from $2130 to $1117. Six months ago, the cryptocurrency market peaked at $3 trillion. Worst is likely ahead.
Gas fees make even the simplest Web3 blockchain transactions unsustainable.
Terra, Luna, and other dollar pegs collapsed, hurting crypto markets. Celsius, a crypto lender backed by VCs and Canada's second-largest pension fund, and Binance, a crypto marketplace, have withheld money and coins. They're near collapse.
NFT sales are falling rapidly and losing public interest.
Web3 has few real-world uses, like most crypto/blockchain technologies. Web3's image has been tarnished by monkey profile pictures and shitcoins while failing to become decentralized (the whole concept is controlled by VCs).
The damage seems irreparable, leaving Web3 in the gutter.
Step forward our new saviour — Web5
Fear not though, as hero awaits to drag us out of the Web3 hellscape. Jack Dorsey revealed his plan to save the internet quickly.
Dorsey has long criticized Web3, believing that VC capital and silicon valley insiders have created a centralized platform. In a tweet that upset believers and VCs (he was promptly blocked by Marc Andreessen), Dorsey argued, "You don't own "Web3." VCs and LPs do. Their incentives prevent it. It's a centralized organization with a new name.
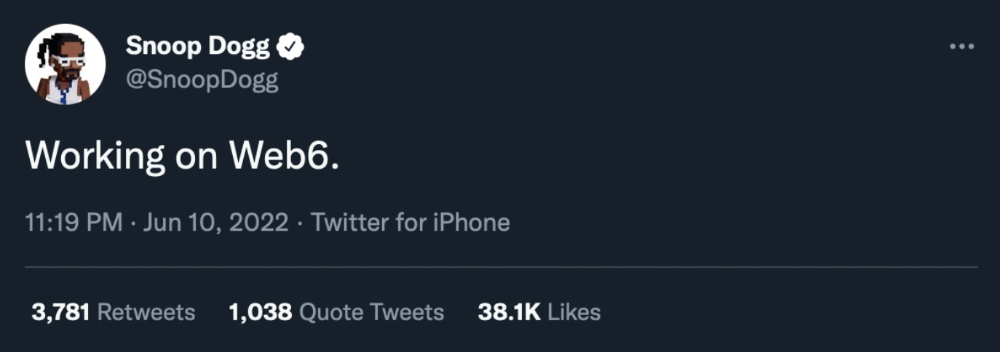
Dorsey announced Web5 on June 10 in a very Elon-like manner. Block's TBD unit will work on the project (formerly Square).
Web5's pitch is that users will control their own data and identity. Bitcoin-based. Sound familiar? The presentation pack's official definition emphasizes decentralization. Web5 is a decentralized web platform that enables developers to write decentralized web apps using decentralized identifiers, verifiable credentials, and decentralized web nodes, returning ownership and control over identity and data to individuals.
Web5 would be permission-less, open, and token-less. What that means for Earth is anyone's guess. Identity. Ownership. Blockchains. Bitcoin. Different.
Web4 appears to have been skipped, forever destined to wish it could have shown the world what it could have been. (It was probably crap.) As this iteration combines Web2 and Web3, simple math and common sense add up to 5. Or something.
Dorsey and his team have had this idea simmering for a while. Daniel Buchner, a member of Block's Decentralized Identity team, said, "We're finishing up Web5's technical components."
Web5 could be the project that decentralizes the internet. It must be useful to users and convince everyone to drop the countless Web3 projects, products, services, coins, blockchains, and websites being developed as I write this.
Web5 may be too late for Dorsey and the incoming flood of creators.
Web6 is planned!
The next months and years will be hectic and less stable than the transition from Web 1.0 to Web 2.0.
Web1 was around 1991-2004.
Web2 ran from 2004 to 2021. (though the Web3 term was first used in 2014, it only really gained traction years later.)
Web3 lasted a year.
Web4 is dead.
Silicon Valley billionaires are turning it into a startup-style race, each disrupting the next iteration until they crack it. Or destroy it completely.
Web5 won't last either.
You might also like

Sammy Abdullah
24 years ago
How to properly price SaaS
Price Intelligently put out amazing content on pricing your SaaS product. This blog's link to the whole report is worth reading. Our key takeaways are below.

Don't base prices on the competition. Competitor-based pricing has clear drawbacks. Their pricing approach is yours. Your company offers customers something unique. Otherwise, you wouldn't create it. This strategy is static, therefore you can't add value by raising prices without outpricing competitors. Look, but don't touch is the competitor-based moral. You want to know your competitors' prices so you're in the same ballpark, but they shouldn't guide your selections. Competitor-based pricing also drives down prices.
Value-based pricing wins. This is customer-based pricing. Value-based pricing looks outward, not inward or laterally at competitors. Your clients are the best source of pricing information. By valuing customer comments, you're focusing on buyers. They'll decide if your pricing and packaging are right. In addition to asking consumers about cost savings or revenue increases, look at data like number of users, usage per user, etc.
Value-based pricing increases prices. As you learn more about the client and your worth, you'll know when and how much to boost rates. Every 6 months, examine pricing.
Cloning top customers. You clone your consumers by learning as much as you can about them and then reaching out to comparable people or organizations. You can't accomplish this without knowing your customers. Segmenting and reproducing them requires as much detail as feasible. Offer pricing plans and feature packages for 4 personas. The top plan should state Contact Us. Your highest-value customers want more advice and support.
Question your 4 personas. What's the one item you can't live without? Which integrations matter most? Do you do analytics? Is support important or does your company self-solve? What's too cheap? What's too expensive?
Not everyone likes per-user pricing. SaaS organizations often default to per-user analytics. About 80% of companies utilizing per-user pricing should use an alternative value metric because their goods don't give more value with more users, so charging for them doesn't make sense.
At least 3:1 LTV/CAC. Break even on the customer within 2 years, and LTV to CAC is greater than 3:1. Because customer acquisition costs are paid upfront but SaaS revenues accrue over time, SaaS companies face an early financial shortfall while paying back the CAC.
ROI should be >20:1. Indeed. Ensure the customer's ROI is 20x the product's cost. Microsoft Office costs $80 a year, but consumers would pay much more to maintain it.
A/B Testing. A/B testing is guessing. When your pricing page varies based on assumptions, you'll upset customers. You don't have enough customers anyway. A/B testing optimizes landing pages, design decisions, and other site features when you know the problem but not pricing.
Don't discount. It cheapens the product, makes it permanent, and increases churn. By discounting, you're ruining your pricing analysis.

Tim Denning
3 years ago
Read These Books on Personal Finance to Boost Your Net Worth
And retire sooner.

Books can make you filthy rich.
If you apply what you learn. In 2011, I was broke and had broken dreams.
Someone suggested I read finance books. One Up On Wall Street was his first recommendation.
Finance books were my crack.
I've read every money book since then. Some are good, but most stink.
These books will make you rich.
The Almanack of Naval Ravikant by Eric Jorgenson
This isn't a cliche book.
This book was inspired by a How to Get Rich tweet thread.
It’s one of the best tweets I’ve ever read.
Naval thinks differently. He nukes ordinary ideas. I've never heard better money advice.
Eric Jorgenson wrote a book about this tweet thread with Navals permission. A must-read, easy-to-digest book.
Best quote
Seek wealth, not money or status. Wealth is having assets that earn while you sleep. Money is how we transfer time and wealth. Status is your place in the social hierarchy — Naval
Morgan Housel's The Psychology of Money
Many finance books advise investing like a dunce.
They almost all peddle the buy an index fund BS. Different book.
It's about money-making psychology. Because any fool can get rich and drunk on their ego. Few can consistently make money.
Each chapter is short. A single-page chapter breaks all book publishing rules.
Best quote
Spending money to show people how much money you have is the fastest way to have less money — Morgan Housel
J.L. Collins' The Simple Path to Wealth
Most of the best money books were written by bloggers.
JL Collins blogs. This easy-to-read book was written for his daughter.
This book popularized the phrase F You Money. With enough money in your bank account and investment portfolio, you can say F You more.
A bad boss is an example. You can leave instead of enduring his wrath.
You can then sit at home and look for another job while financially secure. JL says its mind-freedom is powerful.
Best phrasing
You own the things you own and they in turn own you — J.L. Collins
Tony Robbins' Unshakeable
I like Tony. This book makes me sweaty.
Tony interviews the world's top financiers. He interviews people who rarely do so.
This book taught me all-weather portfolio. It's a way to invest in different asset classes in good, bad, recession, or depression times.
Look at it:
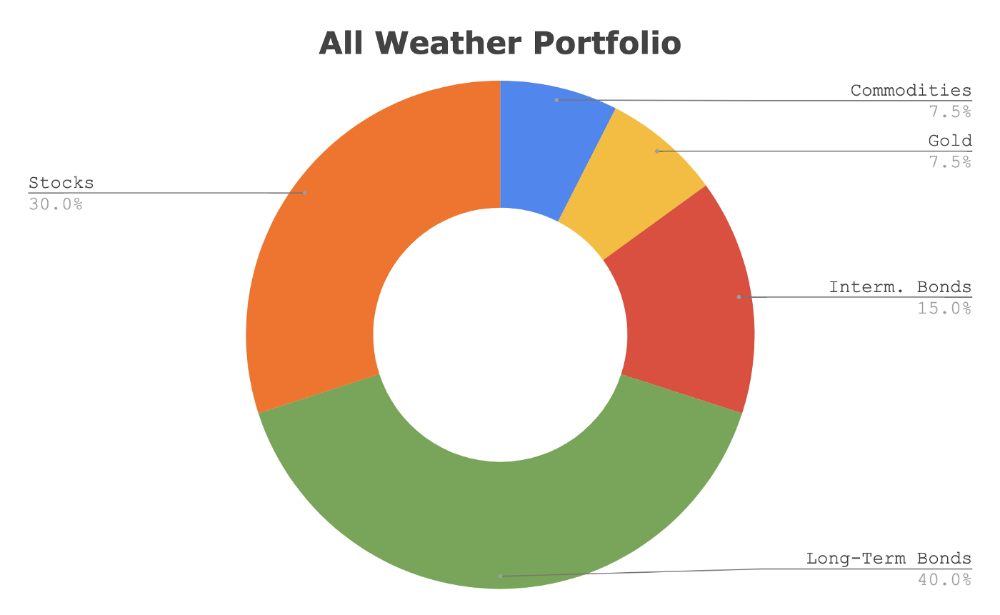
Investing isn’t about buying one big winner — that’s gambling. It’s about investing in a diversified portfolio of assets.
Best phrasing
The best opportunities come in times of maximum pessimism — Tony Robbins
Ben Graham's The Intelligent Investor
This book helped me distinguish between a spectator and an investor.
Spectators are those who shout that crypto, NFTs, or XYZ platform will die.
Tourists. They want attention and to say "I told you so." They make short-term and long-term predictions like fortunetellers. LOL. Idiots.
Benjamin Graham teaches smart investing. You'll buy a long-term asset. To be confident in recessions, use dollar-cost averaging.
Best phrasing
Those who do not remember the past are condemned to repeat it. — Benjamin Graham
The Napoleon Hill book Think and Grow Rich
This classic book introduced positive thinking to modern self-help.
Lazy pessimists can't become rich. No way.
Napoleon said, "Thoughts create reality."
No surprise that he discusses obsession and focus in this book. They are the fastest ways to make more money to invest in time and wealth-protecting assets.
Best phrasing
The starting point of all achievement is DESIRE. Keep this constantly in mind. Weak desire brings weak results, just as a small fire makes a small amount of heat — Napoleon Hill
Ramit Sethi's book I Will Teach You To Be Rich
This book is mostly good. The part about credit cards is trash.
Avoid credit card temptations. I don't care about their airline points.
This book teaches you to master money basics (that many people mess up) then automate it so your monkey brain doesn't ruin your financial future.
The book includes great negotiation tactics to help you make more money in less time.
Best quote
The 85 Percent Solution: Getting started is more important than becoming an expert — Ramit Sethi
David Bach's The Automatic Millionaire
You've probably met a six- or seven-figure earner who's broke. All their money goes to useless things like cars.
Money isn't as essential as what you do with it. David teaches how to automate your earnings for more money.
Compounding works once investing is automated. So you get rich.
His strategy eliminates luck and (almost) guarantees millionaire status.
Best phrasing
Every time you earn one dollar, make sure to pay yourself first — David Bach
Thomas J. Stanley's The Millionaire Next Door
Thomas defies the definition of rich.
He spends much of the book highlighting millionaire traits he's studied.
Rich people are quiet, so you wouldn't know they're wealthy. They don't earn much money or drive a BMW.
Thomas will give you the math to get started.
Best phrasing
I am not impressed with what people own. But I’m impressed with what they achieve. I’m proud to be a physician. Always strive to be the best in your field…. Don’t chase money. If you are the best in your field, money will find you. — Thomas J. Stanley
by Bill Perkins "Die With Zero"
Let’s end with one last book.
Bill's book angered many people. He says we spend too much time saving for retirement and die rich. That bank money is lost time.
Your grandkids could use the money. When children inherit money, they become lazy, entitled a-holes.
Bill wants us to spend our money on life-enhancing experiences. Stop saving money like monopoly monkeys.
Best phrasing
You should be focusing on maximizing your life enjoyment rather than on maximizing your wealth. Those are two very different goals. Money is just a means to an end: Having money helps you to achieve the more important goal of enjoying your life. But trying to maximize money actually gets in the way of achieving the more important goal — Bill Perkins

Theresa W. Carey
4 years ago
How Payment for Order Flow (PFOF) Works
What is PFOF?
PFOF is a brokerage firm's compensation for directing orders to different parties for trade execution. The brokerage firm receives fractions of a penny per share for directing the order to a market maker.
Each optionable stock could have thousands of contracts, so market makers dominate options trades. Order flow payments average less than $0.50 per option contract.
Order Flow Payments (PFOF) Explained
The proliferation of exchanges and electronic communication networks has complicated equity and options trading (ECNs) Ironically, Bernard Madoff, the Ponzi schemer, pioneered pay-for-order-flow.
In a December 2000 study on PFOF, the SEC said, "Payment for order flow is a method of transferring trading profits from market making to brokers who route customer orders to specialists for execution."
Given the complexity of trading thousands of stocks on multiple exchanges, market making has grown. Market makers are large firms that specialize in a set of stocks and options, maintaining an inventory of shares and contracts for buyers and sellers. Market makers are paid the bid-ask spread. Spreads have narrowed since 2001, when exchanges switched to decimals. A market maker's ability to play both sides of trades is key to profitability.
Benefits, requirements
A broker receives fees from a third party for order flow, sometimes without a client's knowledge. This invites conflicts of interest and criticism. Regulation NMS from 2005 requires brokers to disclose their policies and financial relationships with market makers.
Your broker must tell you if it's paid to send your orders to specific parties. This must be done at account opening and annually. The firm must disclose whether it participates in payment-for-order-flow and, upon request, every paid order. Brokerage clients can request payment data on specific transactions, but the response takes weeks.
Order flow payments save money. Smaller brokerage firms can benefit from routing orders through market makers and getting paid. This allows brokerage firms to send their orders to another firm to be executed with other orders, reducing costs. The market maker or exchange benefits from additional share volume, so it pays brokerage firms to direct traffic.
Retail investors, who lack bargaining power, may benefit from order-filling competition. Arrangements to steer the business in one direction invite wrongdoing, which can erode investor confidence in financial markets and their players.
Pay-for-order-flow criticism
It has always been controversial. Several firms offering zero-commission trades in the late 1990s routed orders to untrustworthy market makers. During the end of fractional pricing, the smallest stock spread was $0.125. Options spreads widened. Traders found that some of their "free" trades cost them a lot because they weren't getting the best price.
The SEC then studied the issue, focusing on options trades, and nearly decided to ban PFOF. The proliferation of options exchanges narrowed spreads because there was more competition for executing orders. Options market makers said their services provided liquidity. In its conclusion, the report said, "While increased multiple-listing produced immediate economic benefits to investors in the form of narrower quotes and effective spreads, these improvements have been muted with the spread of payment for order flow and internalization."
The SEC allowed payment for order flow to continue to prevent exchanges from gaining monopoly power. What would happen to trades if the practice was outlawed was also unclear. SEC requires brokers to disclose financial arrangements with market makers. Since then, the SEC has watched closely.
2020 Order Flow Payment
Rule 605 and Rule 606 show execution quality and order flow payment statistics on a broker's website. Despite being required by the SEC, these reports can be hard to find. The SEC mandated these reports in 2005, but the format and reporting requirements have changed over the years, most recently in 2018.
Brokers and market makers formed a working group with the Financial Information Forum (FIF) to standardize order execution quality reporting. Only one retail brokerage (Fidelity) and one market maker remain (Two Sigma Securities). FIF notes that the 605/606 reports "do not provide the level of information that allows a retail investor to gauge how well a broker-dealer fills a retail order compared to the NBBO (national best bid or offer’) at the time the order was received by the executing broker-dealer."
In the first quarter of 2020, Rule 606 reporting changed to require brokers to report net payments from market makers for S&P 500 and non-S&P 500 equity trades and options trades. Brokers must disclose payment rates per 100 shares by order type (market orders, marketable limit orders, non-marketable limit orders, and other orders).
Richard Repetto, Managing Director of New York-based Piper Sandler & Co., publishes a report on Rule 606 broker reports. Repetto focused on Charles Schwab, TD Ameritrade, E-TRADE, and Robinhood in Q2 2020. Repetto reported that payment for order flow was higher in the second quarter than the first due to increased trading activity, and that options paid more than equities.
Repetto says PFOF contributions rose overall. Schwab has the lowest options rates, while TD Ameritrade and Robinhood have the highest. Robinhood had the highest equity rating. Repetto assumes Robinhood's ability to charge higher PFOF reflects their order flow profitability and that they receive a fixed rate per spread (vs. a fixed rate per share by the other brokers).
Robinhood's PFOF in equities and options grew the most quarter-over-quarter of the four brokers Piper Sandler analyzed, as did their implied volumes. All four brokers saw higher PFOF rates.
TD Ameritrade took the biggest income hit when cutting trading commissions in fall 2019, and this report shows they're trying to make up the shortfall by routing orders for additional PFOF. Robinhood refuses to disclose trading statistics using the same metrics as the rest of the industry, offering only a vague explanation on their website.
Summary
Payment for order flow has become a major source of revenue as brokers offer no-commission equity (stock and ETF) orders. For retail investors, payment for order flow poses a problem because the brokerage may route orders to a market maker for its own benefit, not the investor's.
Infrequent or small-volume traders may not notice their broker's PFOF practices. Frequent traders and those who trade larger quantities should learn about their broker's order routing system to ensure they're not losing out on price improvement due to a broker prioritizing payment for order flow.
This post is a summary. Read full article here