


More on Personal Growth

Theo Seeds
3 years ago
The nine novels that have fundamentally altered the way I view the world
I read 53 novels last year and hope to do so again.
Books are best if you love learning. You get a range of perspectives, unlike podcasts and YouTube channels where you get the same ones.
Book quality varies. I've read useless books. Most books teach me something.

These 9 novels have changed my outlook in recent years. They've made me rethink what I believed or introduced me to a fresh perspective that changed my worldview.
You can order these books yourself. Or, read my summaries to learn what I've synthesized.
Enjoy!
Fooled By Randomness
Nassim Taleb worked as a Wall Street analyst. He used options trading to bet on unlikely events like stock market crashes.
Using financial models, investors predict stock prices. The models assume constant, predictable company growth.
These models base their assumptions on historical data, so they assume the future will be like the past.
Fooled By Randomness argues that the future won't be like the past. We often see impossible market crashes like 2008's housing market collapse. The world changes too quickly to use historical data: by the time we understand how it works, it's changed.
Most people don't live to see history unfold. We think our childhood world will last forever. That goes double for stable societies like the U.S., which hasn't seen major turbulence in anyone's lifetime.
Fooled By Randomness taught me to expect the unexpected. The world is deceptive and rarely works as we expect. You can't always trust your past successes or what you've learned.
Antifragile
More Taleb. Some things, like the restaurant industry and the human body, improve under conditions of volatility and turbulence.
We didn't have a word for this counterintuitive concept until Taleb wrote Antifragile. The human body (which responds to some stressors, like exercise, by getting stronger) and the restaurant industry both benefit long-term from disorder (when economic turbulence happens, bad restaurants go out of business, improving the industry as a whole).
Many human systems are designed to minimize short-term variance because humans don't understand it. By eliminating short-term variation, we increase the likelihood of a major disaster.
Once, we put out every forest fire we found. Then, dead wood piled up in forests, causing catastrophic fires.
We don't like price changes, so politicians prop up markets with stimulus packages and printing money. This leads to a bigger crash later. Two years ago, we printed a ton of money for stimulus checks, and now we have double-digit inflation.
Antifragile taught me how important Plan B is. A system with one or two major weaknesses will fail. Make large systems redundant, foolproof, and change-responsive.
Reality is broken
We dread work. Work is tedious. Right?
Wrong. Work gives many people purpose. People are happiest when working. (That's why some are workaholics.)
Factory work saps your soul, office work is boring, and working for a large company you don't believe in and that operates unethically isn't satisfying.
Jane McGonigal says in Reality Is Broken that meaningful work makes us happy. People love games because they simulate good work. McGonigal says work should be more fun.
Some think they'd be happy on a private island sipping cocktails all day. That's not true. Without anything to do, most people would be bored. Unemployed people are miserable. Many retirees die within 2 years, much more than expected.
Instead of complaining, find meaningful work. If you don't like your job, it's because you're in the wrong environment. Find the right setting.
The Lean Startup
Before the airplane was invented, Harvard scientists researched flying machines. Who knew two North Carolina weirdos would beat them?
The Wright Brothers' plane design was key. Harvard researchers were mostly theoretical, designing an airplane on paper and trying to make it fly in theory. They'd build it, test it, and it wouldn't fly.
The Wright Brothers were different. They'd build a cheap plane, test it, and it'd crash. Then they'd learn from their mistakes, build another plane, and it'd crash.
They repeated this until they fixed all the problems and one of their planes stayed aloft.
Mistakes are considered bad. On the African savannah, one mistake meant death. Even today, if you make a costly mistake at work, you'll be fired as a scapegoat. Most people avoid failing.
In reality, making mistakes is the best way to learn.
Eric Reis offers an unintuitive recipe in The Lean Startup: come up with a hypothesis, test it, and fail. Then, try again with a new hypothesis. Keep trying, learning from each failure.
This is a great startup strategy. Startups are new businesses. Startups face uncertainty. Run lots of low-cost experiments to fail, learn, and succeed.
Don't fear failing. Low-cost failure is good because you learn more from it than you lose. As long as your worst-case scenario is acceptable, risk-taking is good.
The Sovereign Individual
Today, nation-states rule the world. The UN recognizes 195 countries, and they claim almost all land outside of Antarctica.
We agree. For the past 2,000 years, much of the world's territory was ungoverned.
Why today? Because technology has created incentives for nation-states for most of the past 500 years. The logic of violence favors nation-states, according to James Dale Davidson, author of the Sovereign Individual. Governments have a lot to gain by conquering as much territory as possible, so they do.
Not always. During the Dark Ages, Europe was fragmented and had few central governments. Partly because of armor. With armor, a sword, and a horse, you couldn't be stopped. Large states were hard to form because they rely on the threat of violence.
When gunpowder became popular in Europe, violence changed. In a world with guns, assembling large armies and conquest are cheaper.
James Dale Davidson says the internet will make nation-states obsolete. Most of the world's wealth will be online and in people's heads, making capital mobile.
Nation-states rely on predatory taxation of the rich to fund large militaries and welfare programs.
When capital is mobile, people can live anywhere in the world, Davidson says, making predatory taxation impossible. They're not bound by their job, land, or factory location. Wherever they're treated best.
Davidson says that over the next century, nation-states will collapse because they won't have enough money to operate as they do now. He imagines a world of small city-states, like Italy before 1900. (or Singapore today).
We've already seen some movement toward a more Sovereign Individual-like world. The pandemic proved large-scale remote work is possible, freeing workers from their location. Many cities and countries offer remote workers incentives to relocate.
Many Western businesspeople live in tax havens, and more people are renouncing their US citizenship due to high taxes. Increasing globalization has led to poor economic conditions and resentment among average people in the West, which is why politicians like Trump and Sanders rose to popularity with angry rhetoric, even though Obama rose to popularity with a more hopeful message.
The Sovereign Individual convinced me that the future will be different than Nassim Taleb's. Large countries like the U.S. will likely lose influence in the coming decades, while Portugal, Singapore, and Turkey will rise. If the trend toward less freedom continues, people may flee the West en masse.
So a traditional life of college, a big firm job, hard work, and corporate advancement may not be wise. Young people should learn as much as possible and develop flexible skills to adapt to the future.
Sapiens
Sapiens is a history of humanity, from proto-humans in Ethiopia to our internet society today, with some future speculation.
Sapiens views humans (and Homo sapiens) as a unique species on Earth. We were animals 100,000 years ago. We're slowly becoming gods, able to affect the climate, travel to every corner of the Earth (and the Moon), build weapons that can kill us all, and wipe out thousands of species.
Sapiens examines what makes Homo sapiens unique. Humans can believe in myths like religion, money, and human-made entities like countries and LLCs.
These myths facilitate large-scale cooperation. Ants from the same colony can cooperate. Any two humans can trade, though. Even if they're not genetically related, large groups can bond over religion and nationality.
Combine that with intelligence, and you have a species capable of amazing feats.
Sapiens may make your head explode because it looks at the world without presupposing values, unlike most books. It questions things that aren't usually questioned and says provocative things.
It also shows how human history works. It may help you understand and predict the world. Maybe.
The 4-hour Workweek
Things can be done better.
Tradition, laziness, bad bosses, or incentive structures cause complacency. If you're willing to make changes and not settle for the status quo, you can do whatever you do better and achieve more in less time.
The Four-Hour Work Week advocates this. Tim Ferriss explains how he made more sales in 2 hours than his 8-hour-a-day colleagues.
By firing 2 of his most annoying customers and empowering his customer service reps to make more decisions, he was able to leave his business and travel to Europe.
Ferriss shows how to escape your 9-to-5, outsource your life, develop a business that feeds you with little time, and go on mini-retirement adventures abroad.
Don't accept the status quo. Instead, level up. Find a way to improve your results. And try new things.
Why Nations Fail
Nogales, Arizona and Mexico were once one town. The US/Mexico border was arbitrarily drawn.
Both towns have similar cultures and populations. Nogales, Arizona is well-developed and has a high standard of living. Nogales, Mexico is underdeveloped and has a low standard of living. Whoa!
Why Nations Fail explains how government-created institutions affect country development. Strong property rights, capitalism, and non-corrupt governments promote development. Countries without capitalism, strong property rights, or corrupt governments don't develop.
Successful countries must also embrace creative destruction. They must offer ordinary citizens a way to improve their lot by creating value for others, not reducing them to slaves, serfs, or peasants. Authors say that ordinary people could get rich on trading expeditions in 11th-century Venice.
East and West Germany and North and South Korea have different economies because their citizens are motivated differently. It explains why Chile, China, and Singapore grow so quickly after becoming market economies.
People have spent a lot of money on third-world poverty. According to Why Nations Fail, education and infrastructure aren't the answer. Developing nations must adopt free-market economic policies.
Elon Musk
Elon Musk is the world's richest man, but that’s not a good way to describe him. Elon Musk is the world's richest man, which is like calling Steve Jobs a turtleneck-wearer or Benjamin Franklin a printer.
Elon Musk does cool sci-fi stuff to help humanity avoid existential threats.
Oil will run out. We've delayed this by developing better extraction methods. We only have so much nonrenewable oil.
Our society is doomed if it depends on oil. Elon Musk invested heavily in Tesla and SolarCity to speed the shift to renewable energy.
Musk worries about AI: we'll build machines smarter than us. We won't be able to stop these machines if something goes wrong, just like cows can't fight humans. Neuralink: we need to be smarter to compete with AI when the time comes.
If Earth becomes uninhabitable, we need a backup plan. Asteroid or nuclear war could strike Earth at any moment. We may not have much time to react if it happens in a few days. We must build a new civilization while times are good and resources are plentiful.
Short-term problems dominate our politics, but long-term issues are more important. Long-term problems can cause mass casualties and homelessness. Musk demonstrates how to think long-term.
The main reason people are impressed by Elon Musk, and why Ashlee Vances' biography influenced me so much, is that he does impossible things.
Electric cars were once considered unprofitable, but Tesla has made them mainstream. SpaceX is the world's largest private space company.
People lack imagination and dismiss ununderstood ideas as impossible. Humanity is about pushing limits. Don't worry if your dreams seem impossible. Try it.
Thanks for reading.

Andy Murphy
3 years ago
Activating Your Vagus Nerve
11 science-backed ways to improve health, happiness, healing, relaxation, and mental clarity.

Vagus nerve is the main parasympathetic nervous system component.
It helps us rest and digest by slowing and stabilizing a resting heart rate, slowing and stabilizing the breath, promoting digestion, improving recovery and healing times, producing saliva, releasing endorphins and hormones like dopamine, oxytocin, and serotonin, and boosting the immune, digestive, and cardiovascular systems.
The vagus nerve sends anti-inflammatory signals to other parts of the body and is located behind the tongue, in the throat, neck, heart, lungs, abdomen, and brainstem.
Vagus means wandering in Latin. So, it's bold.
Here are 11 proven ways to boost health, happiness, and the vagus nerve.
1. Extend
“Yoga stimulates different nerves in your body, especially the vagus nerve that carries information from the brain to most of the body’s major organs, slows everything down and allows self-regulation. It’s the nerve that is associated with the parasympathetic system and emotions like love, joy, and compassion.” — Deepak Chopra
Stretching doesn't require a yoga background.
Listen to your body and ease into simple poses. This connects the mind and body.
If you're new to yoga or don't have access to an in-person class, try Yoga with Adrienne. Over 600 YouTube videos give her plenty of material.
2. Inhale
Because inhaling and exhaling activate the autonomic nervous system, we can breathe to relax.
Exhaling activates the parasympathetic nervous system (rest and digest). One inhales stress, the other exhales it.
So, faster or more intense breathing increases stress. Slower breathing relaxes us.
Breathe slowly, smoothly, and less.
Rhythmic breathing helps me relax.
What to do is as follows:
1. Take 4 smooth, forceless nose breaths.
2. Exhale smoothly and forcefully for 4 seconds
3. Don't pause at the inhale or exhale.
4. Continue for 5 minutes/40 breaths
5. Hold your breath as long as comfortable.
6. Breathe normally.
If four seconds is too long, try breathing in and out for two seconds, or in and out for three seconds, until your breath naturally relaxes. Once calmer, extend your breath.
Any consistent rhythm without force is good. Your heart will follow your lead and become coherent.
3. Chant/Hum
Singing, chanting, or humming activate the vagus nerve through the back of the throat.
Humming emits nitric oxide.
Nitric oxide improves blood circulation, blood flow, heart health, and blood pressure.
Antiviral, antibacterial, anti-inflammatory, antioxidant, and antimicrobial properties kill viruses and bacteria in the nose and throat.
Gargling water stimulates the vagus nerve.
Simple ways to heal, boost energy, and boost mood are often the healthiest. They're free and can be done anywhere.
4. Have more fun
Laughing stimulates the throat muscles, activating the vagus nerve. What's not to like? It releases dopamine.
Take time to enjoy life. Maybe it's a book, podcast, movie, socializing with friends, or laughing yoga.
Follow your bliss, as Joseph Campbell says.
Laugh at yourself
Actually. Really.
Gagging activates vagus nerve-connected muscles. Some doctors use the gag reflex to test the vagus nerve.
Grossness isn't required. While brushing, gag quickly. My girlfriend's brother always does it.
I'm done brushing when I gag, he says.
6. Take in the outdoors
Nature relaxes body and mind. Better if you can walk barefoot.
Earthing is associated with hippies dancing in daisies.
Science now supports hippies.
7. Enter some chilly water.
The diving reflex activates the vagus nerve when exposed to cold water.
The diving reflex involves holding your breath in cold water. Cold showers work best.
Within minutes of being in cold water, parasympathetic nervous system activity, which calms the body, increases.
8. Workout
Exercise increases dopamine, blood circulation, and breathing. So we feel energized, calm, and well-rested.
After resting, the parasympathetic nervous system engages.
It's worth waiting for, though.
9. Play music with brainwaves
Brainwave music harmonizes brainwave activity, boosts productivity and mental clarity, and promotes peace and relaxation by stimulating the vagus nerve.
Simply play a song.
My favorite.
10. Make gentle eyes
Eyes, like breath, often reflect inner state. Sharp, dilated, focused eyes indicate alertness.
Soft, open eyes reflect relaxation and ease. Soft eyes relax the nervous system.
This practice reduces stress, anxiety, and body tension. It's a quick and effective way to enter a calm, peaceful state.
Wild animals can be hunted one minute and graze the next.
Put it into action:
Relax while seated.
Gaze at a distant object
Use peripheral vision while looking straight ahead
Without moving your eyes, look up and down. Connect side spaces to your vision.
Focus on everything as your eyes soften.
Keep breathing
Stay as long as you like
11. Be intimate
We kiss, moan, and breathe deeper during love. We get dopamine, oxytocin, serotonin, and vagus nerve stimulation.
Why not?
To sum up
Here are 11 vagus nerve resets:
Stretch
Breathe
Hum/Chant
More humor
Amuse yourself
Spend time outdoors
Leap into chilly water
Exercise
Play music with brainwaves.
Make gentle eyes.
Be intimate
If these words have inspired you, try my favorite breathwork technique. Combining breathing, chanting, and brainwave music. Win-win-win :)

Neeramitra Reddy
3 years ago
The best life advice I've ever heard could very well come from 50 Cent.
He built a $40M hip-hop empire from street drug dealing.
50 Cent was nearly killed by 9mm bullets.
Before 50 Cent, Curtis Jackson sold drugs.
He sold coke to worried addicts after being orphaned at 8.
Pursuing police. Murderous hustlers and gangs. Unwitting informers.
Despite his hard life, his hip-hop career was a success.
An assassination attempt ended his career at the start.
What sane producer would want to deal with a man entrenched in crime?
Most would have drowned in self-pity and drank themselves to death.
But 50 Cent isn't most people. Life on the streets had given him fearlessness.
“Having a brush with death, or being reminded in a dramatic way of the shortness of our lives, can have a positive, therapeutic effect. So it is best to make every moment count, to have a sense of urgency about life.” ― 50 Cent, The 50th Law
50 released a series of mixtapes that caught Eminem's attention and earned him a $50 million deal!
50 Cents turned death into life.
Things happen; that is life.
We want problems solved.
Every human has problems, whether it's Jeff Bezos swimming in his billions, Obama in his comfortable retirement home, or Dan Bilzerian with his hired bikini models.
All problems.
Problems churn through life. solve one, another appears.
It's harsh. Life's unfair. We can face reality or run from it.
The latter will worsen your issues.
“The firmer your grasp on reality, the more power you will have to alter it for your purposes.” — 50 Cent, The 50th Law
In a fantasy-obsessed world, 50 Cent loves reality.
Wish for better problem-solving skills rather than problem-free living.
Don't wish, work.
We All Have the True Power of Alchemy
Humans are arrogant enough to think the universe cares about them.
That things happen as if the universe notices our nanosecond existences.
Things simply happen. Period.
By changing our perspective, we can turn good things bad.
The alchemists' search for the philosopher's stone may have symbolized the ability to turn our lead-like perceptions into gold.
Negativity bias tints our perceptions.
Normal sparring broke your elbow? Rest and rethink your training. Fired? You can improve your skills and get a better job.
Consider Curtis if he had fallen into despair.
The legend we call 50 Cent wouldn’t have existed.
The Best Lesson in Life Ever?
Neither avoid nor fear your reality.
That simple sentence contains every self-help tip and life lesson on Earth.
When reality is all there is, why fear it? avoidance?
Or worse, fleeing?
To accept reality, we must eliminate the words should be, could be, wish it were, and hope it will be.
It is. Period.
Only by accepting reality's chaos can you shape your life.
“Behind me is infinite power. Before me is endless possibility, around me is boundless opportunity. My strength is mental, physical and spiritual.” — 50 Cent
You might also like

Jennifer Tieu
3 years ago
Why I Love Azuki
Azuki Banner (www.azuki.com)
Disclaimer: This is my personal viewpoint. I'm not on the Azuki team. Please keep in mind that I am merely a fan, community member, and holder. Please do your own research and pardon my grammar. Thanks!
Azuki has changed my view of NFTs.
When I first entered the NFT world, I had no idea what to expect. I liked the idea. So I invested in some projects, fought for whitelists, and discovered some cool NFTs projects (shout-out to CATC). I lost more money than I earned at one point, but I hadn't invested excessively (only put in what you can afford to lose). Despite my losses, I kept looking. I almost waited for the “ah-ha” moment. A NFT project that changed my perspective on NFTs. What makes an NFT project more than a work of art?
Answer: Azuki.
The Art
The Azuki art drew me in as an anime fan. It looked like something out of an anime, and I'd never seen it before in NFT.
The project was still new. The first two animated teasers were released with little fanfare, but I was impressed with their quality. You can find them on Instagram or in their earlier Tweets.
The teasers hinted that this project could be big and that the team could deliver. It was amazing to see Shao cut the Azuki posters with her katana. Especially at the end when she sheaths her sword and the music cues. Then the live action video of the young boy arranging the Azuki posters seemed movie-like. I felt like I was entering the Azuki story, brand, and dope theme.
The team did not disappoint with the Azuki NFTs. The level of detail in the art is stunning. There were Azukis of all genders, skin and hair types, and more. These 10,000 Azukis have so much representation that almost anyone can find something that resonates. Rather than me rambling on, I suggest you visit the Azuki gallery
The Team
If the art is meant to draw you in and be the project's face, the team makes it more. The NFT would be a JPEG without a good team leader. Not that community isn't important, but no community would rally around a bad team.
Because I've been rugged before, I'm very focused on the team when considering a project. While many project teams are anonymous, I try to find ones that are doxxed (public) or at least appear to be established. Unlike Azuki, where most of the Azuki team is anonymous, Steamboy is public. He is (or was) Overwatch's character art director and co-creator of Azuki. I felt reassured and could trust the project after seeing someone from a major game series on the team.
Then I tried to learn as much as I could about the team. Following everyone on Twitter, reading their tweets, and listening to recorded AMAs. I was impressed by the team's professionalism and dedication to their vision for Azuki, led by ZZZAGABOND.
I believe the phrase “actions speak louder than words” applies to Azuki. I can think of a few examples of what the Azuki team has done, but my favorite is ERC721A.
With ERC721A, Azuki has created a new algorithm that allows minting multiple NFTs for essentially the same cost as minting one NFT.
I was ecstatic when the dev team announced it. This fascinates me as a self-taught developer. Azuki released a product that saves people money, improves the NFT space, and is open source. It showed their love for Azuki and the NFT community.
The Community
Community, community, community. It's almost a chant in the NFT space now. A community, like a team, can make or break a project. We are the project's consumers, shareholders, core, and lifeblood. The team builds the house, and we fill it. We stay for the community.
When I first entered the Azuki Discord, I was surprised by the calm atmosphere. There was no news about the project. No release date, no whitelisting requirements. No grinding or spamming either. People just wanted to hangout, get to know each other, and talk. It was nice. So the team could pick genuine people for their mintlist (aka whitelist).
But nothing fundamental has changed since the release. It has remained an authentic, fun, and helpful community. I'm constantly logging into Discord to chat with others or follow conversations. I see the community's openness to newcomers. Everyone respects each other (barring a few bad apples) and the variety of people passing through is fascinating. This human connection and interaction is what I enjoy about this place. Being a part of a group that supports a cause.
Finally, I want to thank the amazing Azuki mod team and the kissaten channel for their contributions.
The Brand
So, what sets Azuki apart from other projects? They are shaping a brand or identity. The Azuki website, I believe, best captures their vision. (This is me gushing over the site.)
If you go to the website, turn on the dope playlist in the bottom left. The playlist features a mix of Asian and non-Asian hip-hop and rap artists, with some lo-fi thrown in. The songs on the playlist change, but I think you get the vibe Azuki embodies just by turning on the music.
The Garden is our next stop where we are introduced to Azuki.
A brand.
We're creating a new brand together.
A metaverse brand. By the people.
A collection of 10,000 avatars that grant Garden membership. It starts with exclusive streetwear collabs, NFT drops, live events, and more. Azuki allows for a new media genre that the world has yet to discover. Let's build together an Azuki, your metaverse identity.
The Garden is a magical internet corner where art, community, and culture collide. The boundaries between the physical and digital worlds are blurring.
Try a Red Bean.
The text begins with Azuki's intention in the space. It's a community-made metaverse brand. Then it goes into more detail about Azuki's plans. Initiation of a story or journey. "Would you like to take the red bean and jump down the rabbit hole with us?" I love the Matrix red pill or blue pill play they used. (Azuki in Japanese means red bean.)
Morpheus, the rebel leader, offers Neo the choice of a red or blue pill in The Matrix. “You take the blue pill... After the story, you go back to bed and believe whatever you want. Your red pill... Let me show you how deep the rabbit hole goes.” Aware that the red pill will free him from the enslaving control of the machine-generated dream world and allow him to escape into the real world, he takes it. However, living the “truth of reality” is harsher and more difficult.
It's intriguing and draws you in. Taking the red bean causes what? Where am I going? I think they did well in piqueing a newcomer's interest.
Not convinced by the Garden? Read the Manifesto. It reinforces Azuki's role.
Here comes a new wave…
And surfing here is different.
Breaking down barriers.
Building open communities.
Creating magic internet money with our friends.
To those who don’t get it, we tell them: gm.
They’ll come around eventually.
Here’s to the ones with the courage to jump down a peculiar rabbit hole.
One that pulls you away from a world that’s created by many and owned by few…
To a world that’s created by more and owned by all.
From The Garden come the human beans that sprout into your family.
We rise together.
We build together.
We grow together.
Ready to take the red bean?
Not to mention the Mindmap, it sets Azuki apart from other projects and overused Roadmaps. I like how the team recognizes that the NFT space is not linear. So many of us are still trying to figure it out. It is Azuki's vision to adapt to changing environments while maintaining their values. I admire their commitment to long-term growth.
Conclusion
To be honest, I have no idea what the future holds. Azuki is still new and could fail. But I'm a long-term Azuki fan. I don't care about quick gains. The future looks bright for Azuki. I believe in the team's output. I love being an Azuki.
Thank you! IKUZO!
Full post here

Luke Plunkett
3 years ago
Gran Turismo 7 Update Eases Up On The Grind After Fan Outrage
Polyphony Digital has changed the game after apologizing in March.
To make amends for some disastrous downtime, Gran Turismo 7 director Kazunori Yamauchi announced a credits handout and promised to “dramatically change GT7's car economy to help make amends” last month. The first of these has arrived.
The game's 1.11 update includes the following concessions to players frustrated by the economy and its subsequent grind:
-
The last half of the World Circuits events have increased in-game credit rewards.
-
Modified Arcade and Custom Race rewards
-
Clearing all circuit layouts with Gold or Bronze now rewards In-game Credits. Exiting the Sector selection screen with the Exit button will award Credits if an event has already been cleared.
-
Increased Credits Rewards in Lobby and Daily Races
-
Increased the free in-game Credits cap from 20,000,000 to 100,000,000.
Additionally, “The Human Comedy” missions are one-hour endurance races that award “up to 1,200,000” credits per event.
This isn't everything Yamauchi promised last month; he said it would take several patches and updates to fully implement the changes. Here's a list of everything he said would happen, some of which have already happened (like the World Cup rewards and credit cap):
- Increase rewards in the latter half of the World Circuits by roughly 100%.
- Added high rewards for all Gold/Bronze results clearing the Circuit Experience.
- Online Races rewards increase.
- Add 8 new 1-hour Endurance Race events to Missions. So expect higher rewards.
- Increase the non-paid credit limit in player wallets from 20M to 100M.
- Expand the number of Used and Legend cars available at any time.
- With time, we will increase the payout value of limited time rewards.
- New World Circuit events.
- Missions now include 24-hour endurance races.
- Online Time Trials added, with rewards based on the player's time difference from the leader.
- Make cars sellable.
The full list of updates and changes can be found here.
Read the original post.

Jon Brosio
3 years ago
You can learn more about marketing from these 8 copywriting frameworks than from a college education.
Email, landing pages, and digital content

Today's most significant skill:
Copywriting.
Unfortunately, most people don't know how to write successful copy because they weren't taught in school.
I've been obsessed with copywriting for two years. I've read 15 books, completed 3 courses, and studied internet's best digital entrepreneurs.
Here are 8 copywriting frameworks that educate more than a four-year degree.
1. Feature — Advantage — Benefit (F.A.B)
This is the most basic copywriting foundation. Email marketing, landing page copy, and digital video ads can use it.
F.A.B says:
How it works (feature)
which is helpful (advantage)
What's at stake (benefit)
The Hustle uses this framework on their landing page to convince people to sign up:
2. P. A. S. T. O. R.
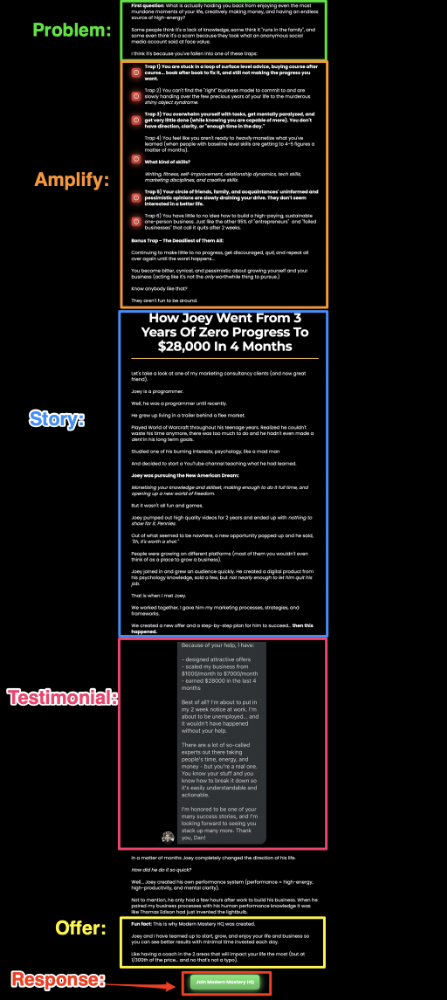
This framework is for longer-form copywriting. PASTOR uses stories to engage with prospects. It explains why people should buy this offer.
PASTOR means:
Problem
Amplify
Story
Testimonial
Offer
Response
Dan Koe's landing page is a great example. It shows PASTOR frame-by-frame.
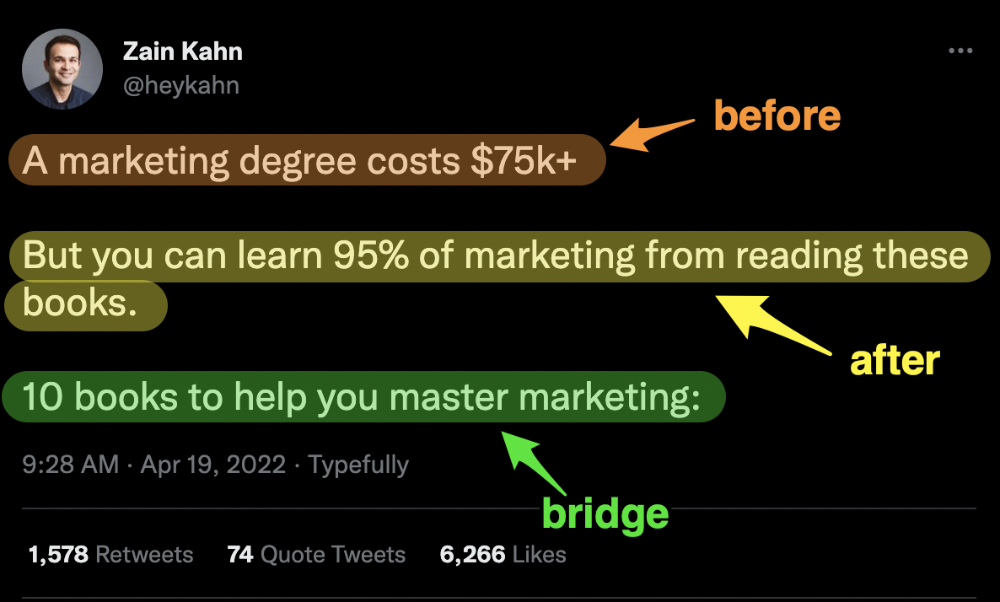
3. Before — After — Bridge
Before-after-bridge is a copywriting framework that draws attention and shows value quickly.
This framework highlights:
where you are
where you want to be
how to get there
Works great for: Email threads/landing pages
Zain Kahn utilizes this framework to write viral threads.
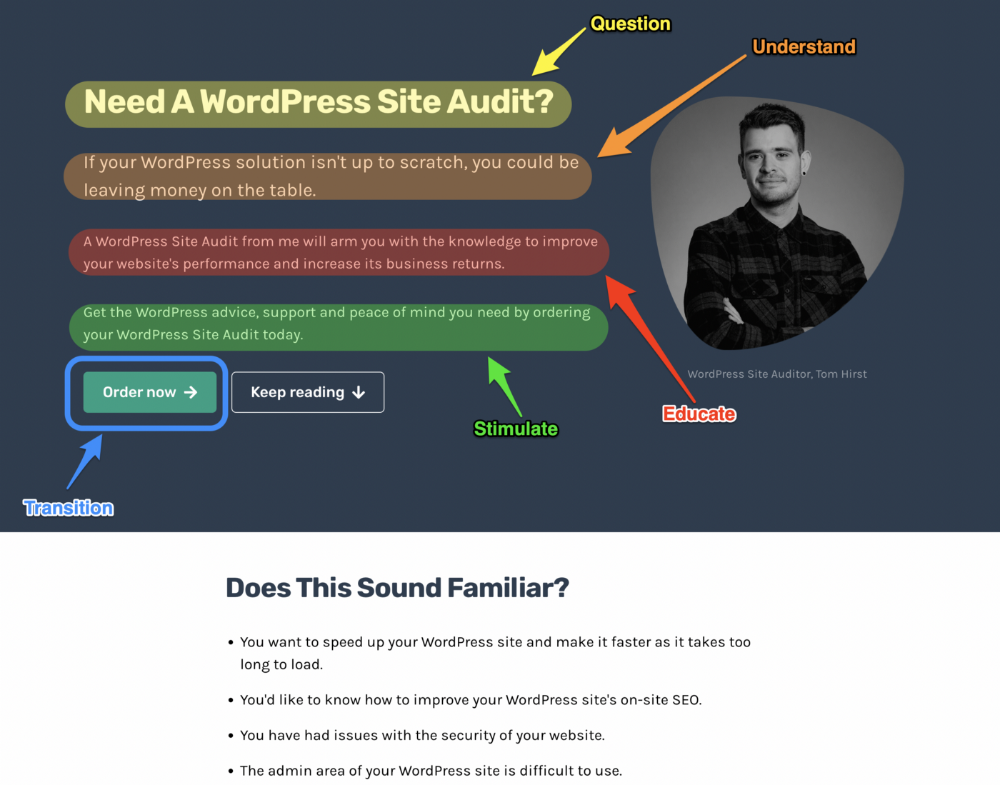
4. Q.U.E.S.T
QUEST is about empathetic writing. You know their issues, obstacles, and headaches. This allows coverups.
QUEST:
Qualifies
Understands
Educates
Stimulates
Transitions
Tom Hirst's landing page uses the QUEST framework.
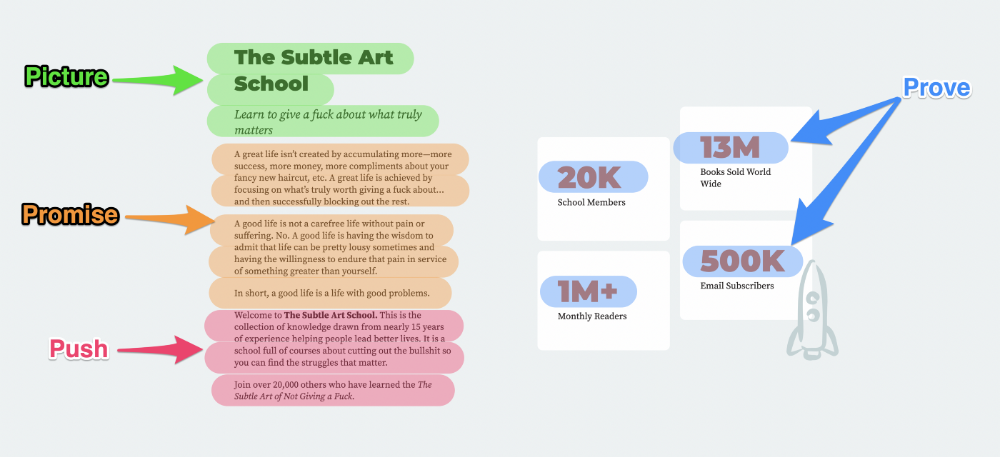
5. The 4P’s model
The 4P’s approach pushes your prospect to action. It educates and persuades quickly.
4Ps:
The problem the visitor is dealing with
The promise that will help them
The proof the promise works
A push towards action
Mark Manson is a bestselling author, digital creator, and pop-philosopher. He's also a great copywriter, and his membership offer uses the 4P’s framework.
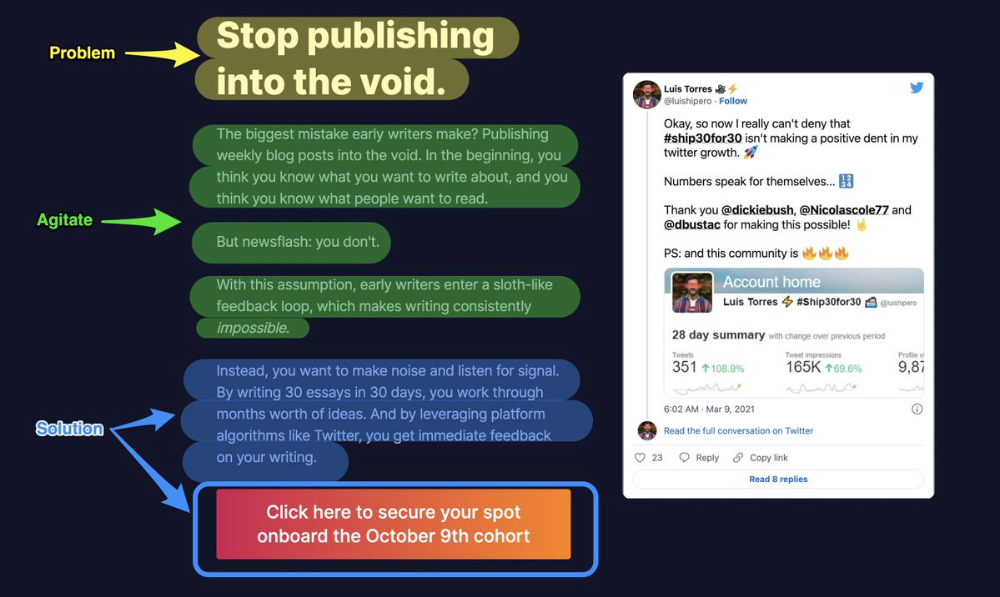
6. Problem — Agitate — Solution (P.A.S)
Up-and-coming marketers should understand problem-agitate-solution copywriting. Once you understand one structure, others are easier. It drives passion and presents a clear solution.
PAS outlines:
The issue the visitor is having
It then intensifies this issue through emotion.
finally offers an answer to that issue (the offer)
The customer's story loops. Nicolas Cole and Dickie Bush use PAS to promote Ship 30 for 30.
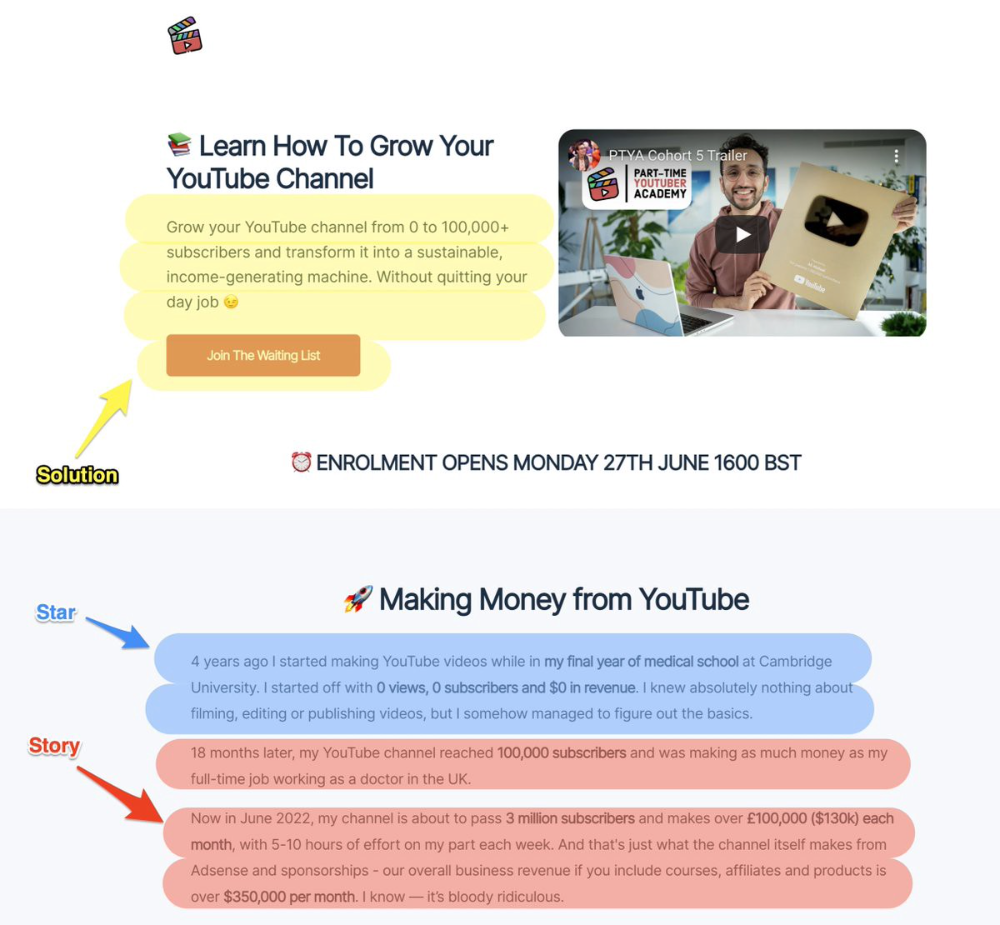
7. Star — Story — Solution (S.S.S)
PASTOR + PAS = star-solution-story. Like PAS, it employs stories to persuade.
S.S.S. is effective storytelling:
Star: (Person had a problem)
Story: (until they had a breakthrough)
Solution: (That created a transformation)
Ali Abdaal is a YouTuber with a great S.S.S copy.
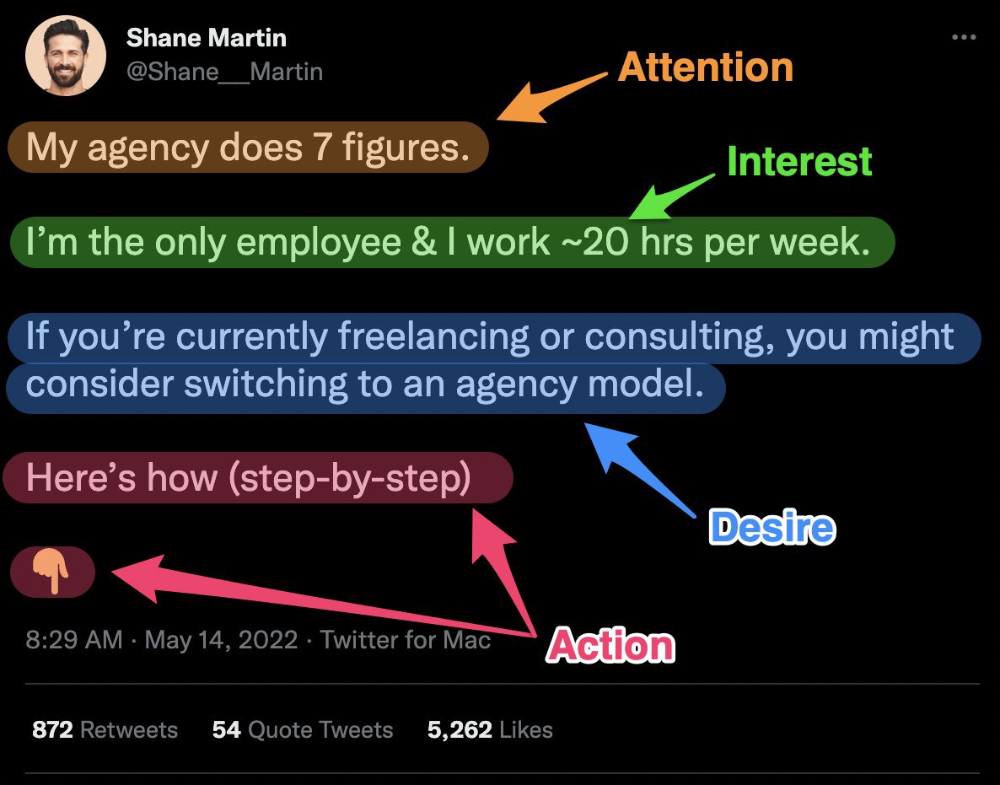
8. Attention — Interest — Desire — Action
AIDA is another classic. This copywriting framework is great for fast-paced environments (think all digital content on Linkedin, Twitter, Medium, etc.).
It works with:
Page landings
writing on thread
Email
It's a good structure since it's concise, attention-grabbing, and action-oriented.
Shane Martin, Twitter's creator, uses this approach to create viral content.
TL;DR
8 copywriting frameworks that teach marketing better than a four-year degree
Feature-advantage-benefit
Before-after-bridge
Star-story-solution
P.A.S.T.O.R
Q.U.E.S.T
A.I.D.A
P.A.S
4P’s