


More on Society & Culture

Max Chafkin
3 years ago
Elon Musk Bets $44 Billion on Free Speech's Future
Musk’s purchase of Twitter has sealed his bond with the American right—whether the platform’s left-leaning employees and users like it or not.
Elon Musk's pursuit of Twitter Inc. began earlier this month as a joke. It started slowly, then spiraled out of control, culminating on April 25 with the world's richest man agreeing to spend $44 billion on one of the most politically significant technology companies ever. There have been bigger financial acquisitions, but Twitter's significance has always outpaced its balance sheet. This is a unique Silicon Valley deal.
To recap: Musk announced in early April that he had bought a stake in Twitter, citing the company's alleged suppression of free speech. His complaints were vague, relying heavily on the dog whistles of the ultra-right. A week later, he announced he'd buy the company for $54.20 per share, four days after initially pledging to join Twitter's board. Twitter's directors noticed the 420 reference as well, and responded with a “shareholder rights” plan (i.e., a poison pill) that included a 420 joke.
Musk - Patrick Pleul/Getty Images
No one knew if the bid was genuine. Musk's Twitter plans seemed implausible or insincere. In a tweet, he referred to automated accounts that use his name to promote cryptocurrency. He enraged his prospective employees by suggesting that Twitter's San Francisco headquarters be turned into a homeless shelter, renaming the company Titter, and expressing solidarity with his growing conservative fan base. “The woke mind virus is making Netflix unwatchable,” he tweeted on April 19.
But Musk got funding, and after a frantic weekend of negotiations, Twitter said yes. Unlike most buyouts, Musk will personally fund the deal, putting up up to $21 billion in cash and borrowing another $12.5 billion against his Tesla stock.
Free Speech and Partisanship
Percentage of respondents who agree with the following
The deal is expected to replatform accounts that were banned by Twitter for harassing others, spreading misinformation, or inciting violence, such as former President Donald Trump's account. As a result, Musk is at odds with his own left-leaning employees, users, and advertisers, who would prefer more content moderation rather than less.
Dorsey - Photographer: Joe Raedle/Getty Images
Previously, the company's leadership had similar issues. Founder Jack Dorsey stepped down last year amid concerns about slowing growth and product development, as well as his dual role as CEO of payments processor Block Inc. Compared to Musk, a father of seven who already runs four companies (besides Tesla and SpaceX), Dorsey is laser-focused.
Musk's motivation to buy Twitter may be political. Affirming the American far right with $44 billion spent on “free speech” Right-wing activists have promoted a series of competing upstart Twitter competitors—Parler, Gettr, and Trump's own effort, Truth Social—since Trump was banned from major social media platforms for encouraging rioters at the US Capitol on Jan. 6, 2021. But Musk can give them a social network with lax content moderation and a real user base. Trump said he wouldn't return to Twitter after the deal was announced, but he wouldn't be the first to do so.
Trump - Eli Hiller/Bloomberg
Conservative activists and lawmakers are already ecstatic. “A great day for free speech in America,” said Missouri Republican Josh Hawley. The day the deal was announced, Tucker Carlson opened his nightly Fox show with a 10-minute laudatory monologue. “The single biggest political development since Donald Trump's election in 2016,” he gushed over Musk.
But Musk's supporters and detractors misunderstand how much his business interests influence his political ideology. He marketed Tesla's cars as carbon-saving machines that were faster and cooler than gas-powered luxury cars during George W. Bush's presidency. Musk gained a huge following among wealthy environmentalists who reserved hundreds of thousands of Tesla sedans years before they were made during Barack Obama's presidency. Musk in the Trump era advocated for a carbon tax, but he also fought local officials (and his own workers) over Covid rules that slowed the reopening of his Bay Area factory.
Teslas at the Las Vegas Convention Center Loop Central Station in April 2021. The Las Vegas Convention Center Loop was Musk's first commercial project. Ethan Miller/Getty Images
Musk's rightward shift matched the rise of the nationalist-populist right and the desire to serve a growing EV market. In 2019, he unveiled the Cybertruck, a Tesla pickup, and in 2018, he announced plans to manufacture it at a new plant outside Austin. In 2021, he decided to move Tesla's headquarters there, citing California's "land of over-regulation." After Ford and General Motors beat him to the electric truck market, Musk reframed Tesla as a company for pickup-driving dudes.
Similarly, his purchase of Twitter will be entwined with his other business interests. Tesla has a factory in China and is friendly with Beijing. This could be seen as a conflict of interest when Musk's Twitter decides how to treat Chinese-backed disinformation, as Amazon.com Inc. founder Jeff Bezos noted.
Musk has focused on Twitter's product and social impact, but the company's biggest challenges are financial: Either increase cash flow or cut costs to comfortably service his new debt. Even if Musk can't do that, he can still benefit from the deal. He has recently used the increased attention to promote other business interests: Boring has hyperloops and Neuralink brain implants on the way, Musk tweeted. Remember Tesla's long-promised robotaxis!
Musk may be comfortable saying he has no expectation of profit because it benefits his other businesses. At the TED conference on April 14, Musk insisted that his interest in Twitter was solely charitable. “I don't care about money.”
The rockets and weed jokes make it easy to see Musk as unique—and his crazy buyout will undoubtedly add to that narrative. However, he is a megabillionaire who is risking a small amount of money (approximately 13% of his net worth) to gain potentially enormous influence. Musk makes everything seem new, but this is a rehash of an old media story.

Charlie Brown
3 years ago
What Happens When You Sell Your House, Never Buying It Again, Reverse the American Dream
Homeownership isn't the only life pattern.

Want to irritate people?
My party trick is to say I used to own a house but no longer do.
I no longer wish to own a home, not because I lost it or because I'm moving.
It was a long-term plan. It was more deliberate than buying a home. Many people are committed for this reason.
Poppycock.
Anyone who told me that owning a house (or striving to do so) is a must is wrong.
Because, URGH.
One pattern for life is to own a home, but there are millions of others.
You can afford to buy a home? Go, buddy.
You think you need 1,000 square feet (or more)? You think it's non-negotiable in life?
Nope.
It's insane that society forces everyone to own real estate, regardless of income, wants, requirements, or situation. As if this trade brings happiness, stability, and contentment.
Take it from someone who thought this for years: drywall isn't happy. Living your way brings contentment.
That's in real estate. It may also be renting a small apartment in a city that makes your soul sing, but you can't afford the downpayment or mortgage payments.
Living or traveling abroad is difficult when your life savings are connected to something that eats your money the moment you sign.
#vanlife, which seems like torment to me, makes some people feel alive.
I've seen co-living, vacation rental after holiday rental, living with family, and more work.
Insisting that home ownership is the only path in life is foolish and reduces alternative options.
How little we question homeownership is a disgrace.
No one challenges a homebuyer's motives. We congratulate them, then that's it.
When you offload one, you must answer every question, even if you have a loose screw.
Why do you want to sell?
Do you have any concerns about leaving the market?
Why would you want to renounce what everyone strives for?
Why would you want to abandon a beautiful place like that?
Why would you mismanage your cash in such a way?
But surely it's only temporary? RIGHT??
Incorrect questions. Buying a property requires several inquiries.
The typical American has $4500 saved up. When something goes wrong with the house (not if, it’s never if), can you actually afford the repairs?
Are you certain that you can examine a home in less than 15 minutes before committing to buying it outright and promising to pay more than twice the asking price on a 30-year 7% mortgage?
Are you certain you're ready to leave behind friends, family, and the services you depend on in order to acquire something?
Have you thought about the connotation that moving to a suburb, which more than half of Americans do, means you will be dependent on a car for the rest of your life?
Plus:
Are you sure you want to prioritize home ownership over debt, employment, travel, raising kids, and daily routines?
Homeownership entails that. This ex-homeowner says it will rule your life from the time you put the key in the door.
This isn't questioned. We don't question enough. The holy home-ownership grail was set long ago, and we don't challenge it.
Many people question after signing the deeds. 70% of homeowners had at least one regret about buying a property, including the expense.
Exactly. Tragic.
Homes are different from houses
We've been fooled into thinking home ownership will make us happy.
Some may agree. No one.
Bricks and brick hindered me from living the version of my life that made me most comfortable, happy, and steady.
I'm spending the next month in a modest apartment in southern Spain. Even though it's late November, today will be 68 degrees. My spouse and I will soon meet his visiting parents. We'll visit a Sherry store. We'll eat, nap, walk, and drink Sherry. Writing. Jerez means flamenco.
That's my home. This is such a privilege. Living a fulfilling life brings me the contentment that buying a home never did.
I'm happy and comfortable knowing I can make almost all of my days good. Rejecting home ownership is partly to blame.
I'm broke like most folks. I had to choose between home ownership and comfort. I said, I didn't find them together.
Feeling at home trumps owning brick-and-mortar every day.
The following is the reality of what it's like to turn the American Dream around.
Leaving the housing market.
Sometimes I wish I owned a home.
I miss having my own yard and bed. My kitchen, cookbooks, and pizza oven are missed.
But I rarely do.
Someone else's life plan pushed home ownership on me. I'm grateful I figured it out at 35. Many take much longer, and some never understand homeownership stinks (for them).
It's confusing. People will think you're dumb or suicidal.
If you read what I write, you'll know. You'll realize that all you've done is choose to live intentionally. Find a home beyond four walls and a picket fence.
Miss? As I said, they're not home. If it were, a pizza oven, a good mattress, and a well-stocked kitchen would bring happiness.
No.
If you can afford a house and desire one, more power to you.
There are other ways to discover home. Find calm and happiness. For fun.
For it, look deeper than your home's foundation.

Liz Martin
3 years ago
What Motivated Amazon to Spend $1 Billion for The Rings of Power?
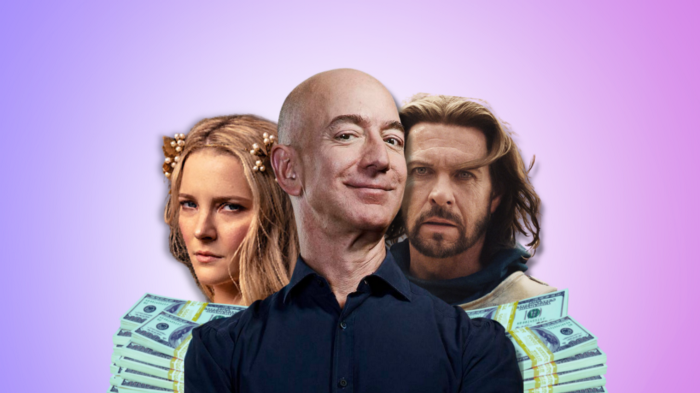
Amazon's Rings of Power is the most costly TV series ever made. This is merely a down payment towards Amazon's grand goal.
Here's a video:
Amazon bought J.R.R. Tolkien's fantasy novels for $250 million in 2017. This agreement allows Amazon to create a Tolkien series for Prime Video.
The business spent years developing and constructing a Lord of the Rings prequel. Rings of Power premiered on September 2, 2022.
It drew 25 million global viewers in 24 hours. Prime Video's biggest debut.
An Exorbitant Budget
The most expensive. First season cost $750 million to $1 billion, making it the most costly TV show ever.
Jeff Bezos has spent years looking for the next Game of Thrones, a critically and commercially successful original series. Rings of Power could help.
Why would Amazon bet $1 billion on one series?
It's Not Just About the Streaming War
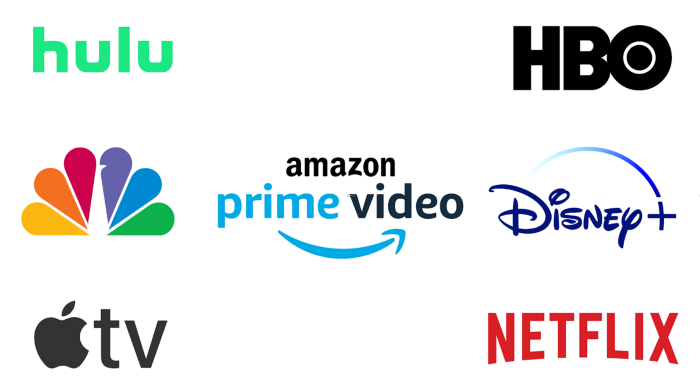
It's simple to assume Amazon just wants to win. Since 2018, the corporation has been fighting Hulu, Netflix, HBO, Apple, Disney, and NBC. Each wants your money, talent, and attention. Amazon's investment goes beyond rivalry.
Subscriptions Are the Bait
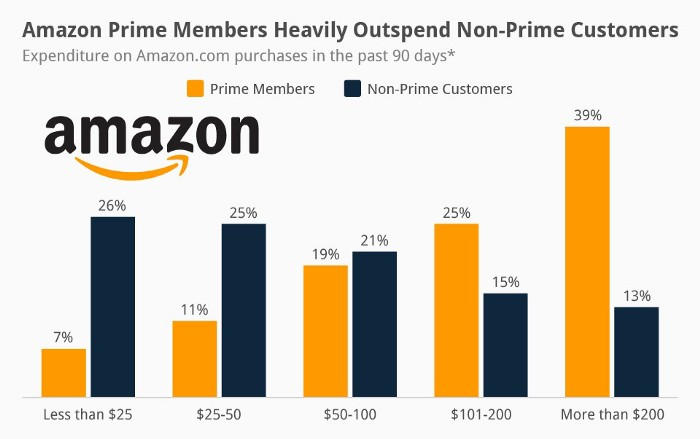
Audible, Amazon Music, and Prime Video are subscription services, although the company's fundamental business is retail. Amazon's online stores contribute over 50% of company revenue. Subscription services contribute 6.8%. The company's master plan depends on these subscriptions.
Streaming videos on Prime increases membership renewals. Free trial participants are more likely to join. Members buy twice as much as non-members.
Amazon Studios doesn't generate original programming to earn from Prime Video subscriptions. It aims to retain and attract clients.
Amazon can track what you watch and buy. Its algorithm recommends items and services. Mckinsey says you'll use more Amazon products, shop at Amazon stores, and watch Amazon entertainment.
In 2015, the firm launched the first season of The Man in the High Castle, a dystopian alternate history TV series depicting a world ruled by Nazi Germany and Japan after World War II.

This $72 million production earned two Emmys. It garnered 1.15 million new Prime users globally.
When asked about his Hollywood investment, Bezos said, "A Golden Globe helps us sell more shoes."
Selling more footwear
Amazon secured a deal with DirecTV to air Thursday Night Football in restaurants and bars. First streaming service to have exclusive NFL games.
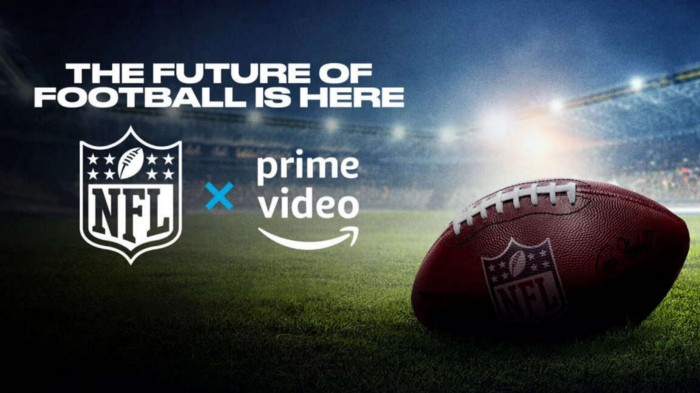
This isn't just about Thursday night football, says media analyst Ritchie Greenfield. This sells t-shirts. This may be a ticket. Amazon does more than stream games.
The Rings of Power isn't merely a production showcase, either. This sells Tolkien's fantasy novels such Lord of the Rings, The Hobbit, and The Silmarillion.
This tiny commitment keeps you in Amazon's ecosystem.
You might also like

William Anderson
3 years ago
When My Remote Leadership Skills Took Off
4 Ways To Manage Remote Teams & Employees
The wheels hit the ground as I landed in Rochester.
Our six-person satellite office was now part of my team.
Their manager only reported to me the day before, but I had my ticket booked ahead of time.
I had managed remote employees before but this was different. Engineers dialed into headquarters for every meeting.
So when I learned about the org chart change, I knew a strong first impression would set the tone for everything else.
I was either their boss, or their boss's boss, and I needed them to know I was committed.
Managing a fleet of satellite freelancers or multiple offices requires treating others as more than just a face behind a screen.
You must comprehend each remote team member's perspective and daily interactions.
The good news is that you can start using these techniques right now to better understand and elevate virtual team members.
1. Make Visits To Other Offices
If budgeted, visit and work from offices where teams and employees report to you. Only by living alongside them can one truly comprehend their problems with communication and other aspects of modern life.
2. Have Others Come to You
• Having remote, distributed, or satellite employees and teams visit headquarters every quarter or semi-quarterly allows the main office culture to rub off on them.
When remote team members visit, more people get to meet them, which builds empathy.
If you can't afford to fly everyone, at least bring remote managers or leaders. Hopefully they can resurrect some culture.
3. Weekly Work From Home
No home office policy?
Make one.
WFH is a team-building, problem-solving, and office-viewing opportunity.
For dial-in meetings, I started working from home on occasion.
It also taught me which teams “forget” or “skip” calls.
As a remote team member, you experience all the issues first hand.
This isn't as accurate for understanding teams in other offices, but it can be done at any time.
4. Increase Contact Even If It’s Just To Chat
Don't underestimate office banter.
Sometimes it's about bonding and trust, other times it's about business.
If you get all this information in real-time, please forward it.
Even if nothing critical is happening, call remote team members to check in and chat.
I guarantee that building relationships and rapport will increase both their job satisfaction and yours.

Micah Daigle
3 years ago
Facebook is going away. Here are two explanations for why it hasn't been replaced yet.
And tips for anyone trying.

We see the same story every few years.
BREAKING NEWS: [Platform X] launched a social network. With Facebook's reputation down, the new startup bets millions will switch.
Despite the excitement surrounding each new platform (Diaspora, Ello, Path, MeWe, Minds, Vero, etc.), no major exodus occurred.
Snapchat and TikTok attracted teens with fresh experiences (ephemeral messaging and rapid-fire videos). These features aren't Facebook, even if Facebook replicated them.
Facebook's core is simple: you publish items (typically text/images) and your friends (generally people you know IRL) can discuss them.
It's cool. Sometimes I don't want to, but sh*t. I like it.
Because, well, I like many folks I've met. I enjoy keeping in touch with them and their banter.
I dislike Facebook's corporation. I've been cautiously optimistic whenever a Facebook-killer surfaced.
None succeeded.
Why? Two causes, I think:
People couldn't switch quickly enough, which is reason #1
Your buddies make a social network social.
Facebook started in self-contained communities (college campuses) then grew outward. But a new platform can't.
If we're expected to leave Facebook, we want to know that most of our friends will too.
Most Facebook-killers had bottlenecks. You have to waitlist or jump through hoops (e.g. setting up a server).
Same outcome. Upload. Chirp.
After a week or two of silence, individuals returned to Facebook.
Reason #2: The fundamental experience was different.
Even when many of our friends joined in the first few weeks, it wasn't the same.
There were missing features or a different UX.
Want to reply with a meme? No photos in comments yet. (Trying!)
Want to tag a friend? Nope, sorry. 2019!
Want your friends to see your post? You must post to all your friends' servers. Good luck!
It's difficult to introduce a platform with 100% of the same features as one that's been there for 20 years, yet customers want a core experience.
If you can't, they'll depart.
The causes that led to the causes
Having worked on software teams for 14+ years, I'm not surprised by these challenges. They are a natural development of a few tech sector meta-problems:
Lean startup methodology
Silicon Valley worships lean startup. It's a way of developing software that involves testing a stripped-down version with a limited number of people before selecting what to build.
Billion people use Facebook's functions. They aren't tested. It must work right away*
*This may seem weird to software people, but it's how non-software works! You can't sell a car without wheels.
2. Creativity
Startup entrepreneurs build new things, not copies. I understand. Reinventing the wheel is boring.
We know what works. Different experiences raise adoption friction. Once millions have transferred, more features (and a friendlier UX) can be implemented.
3. Cost scaling
True. Building a product that can sustain hundreds of millions of users in weeks is expensive and complex.
Your lifeboats must have the same capacity as the ship you're evacuating. It's required.
4. Pure ideologies
People who work on Facebook-alternatives are (understandably) critical of Facebook.
They build an open-source, fully-distributed, data-portable, interface-customizable, offline-capable, censorship-proof platform.
Prioritizing these aims can prevent replicating the straightforward experience users expect. Github, not Facebook, is for techies only.
What about the business plan, though?
Facebook-killer attempts have followed three models.
Utilize VC funding to increase your user base, then monetize them later. (If you do this, you won't kill Facebook; instead, Facebook will become you.)
Users must pay to utilize it. (This causes a huge bottleneck and slows the required quick expansion, preventing it from seeming like a true social network.)
Make it a volunteer-run, open-source endeavor that is free. (This typically denotes that something is cumbersome, difficult to operate, and is only for techies.)
Wikipedia is a fourth way.
Wikipedia is one of the most popular websites and a charity. No ads. Donations support them.
A Facebook-killer managed by a good team may gather millions (from affluent contributors and the crowd) for their initial phase of development. Then it might sustain on regular donations, ethical transactions (e.g. fees on commerce, business sites, etc.), and government grants/subsidies (since it would essentially be a public utility).
When you're not aiming to make investors rich, it's remarkable how little money you need.
If you want to build a Facebook competitor, follow these tips:
Drop the lean startup philosophy. Wait until you have a finished product before launching. Build it, thoroughly test it for bugs, and then release it.
Delay innovating. Wait till millions of people have switched before introducing your great new features. Make it nearly identical for now.
Spend money climbing. Make sure that guests can arrive as soon as they are invited. Never keep them waiting. Make things easy for them.
Make it accessible to all. Even if doing so renders it less philosophically pure, it shouldn't require technical expertise to utilize.
Constitute a nonprofit. Additionally, develop community ownership structures. Profit maximization is not the only strategy for preserving valued assets.
Last thoughts
Nobody has killed Facebook, but Facebook is killing itself.
The startup is burying the newsfeed to become a TikTok clone. Meta itself seems to be ditching the platform for the metaverse.
I wish I was happy, but I'm not. I miss (understandably) removed friends' postings and remarks. It could be a ghost town in a few years. My dance moves aren't TikTok-worthy.
Who will lead? It's time to develop a social network for the people.
Greetings if you're working on it. I'm not a company founder, but I like to help hard-working folks.

Jari Roomer
3 years ago
10 Alternatives to Smartphone Scrolling
"Don't let technology control you; manage your phone."
"Don't become a slave to technology," said Richard Branson. "Manage your phone, don't let it manage you."
Unfortunately, most people are addicted to smartphones.
Worrying smartphone statistics:
46% of smartphone users spend 5–6 hours daily on their device.
The average adult spends 3 hours 54 minutes per day on mobile devices.
We check our phones 150–344 times per day (every 4 minutes).
During the pandemic, children's daily smartphone use doubled.
Having a list of productive, healthy, and fulfilling replacement activities is an effective way to reduce smartphone use.
The more you practice these smartphone replacements, the less time you'll waste.
Skills Development
Most people say they 'don't have time' to learn new skills or read more. Lazy justification. The issue isn't time, but time management. Distractions and low-quality entertainment waste hours every day.
The majority of time is spent in low-quality ways, according to Richard Koch, author of The 80/20 Principle.
What if you swapped daily phone scrolling for skill-building?
There are dozens of skills to learn, from high-value skills to make more money to new languages and party tricks.
Learning a new skill will last for years, if not a lifetime, compared to scrolling through your phone.
Watch Docs
Love documentaries. It's educational and relaxing. A good documentary helps you understand the world, broadens your mind, and inspires you to change.
Recent documentaries I liked include:
14 Peaks: Nothing Is Impossible
The Social Dilemma
Jim & Andy: The Great Beyond
Fantastic Fungi
Make money online
If you've ever complained about not earning enough money, put away your phone and get to work.
Instead of passively consuming mobile content, start creating it. Create something worthwhile. Freelance.
Internet makes starting a business or earning extra money easier than ever.
(Grand)parents didn't have this. Someone made them work 40+ hours. Few alternatives existed.
Today, all you need is internet and a monetizable skill. Use the internet instead of letting it distract you. Profit from it.
Bookworm
Jack Canfield, author of Chicken Soup For The Soul, said, "Everyone spends 2–3 hours a day watching TV." If you read that much, you'll be in the top 1% of your field."
Few people have more than two hours per day to read.
If you read 15 pages daily, you'd finish 27 books a year (as the average non-fiction book is about 200 pages).
Jack Canfield's quote remains relevant even though 15 pages can be read in 20–30 minutes per day. Most spend this time watching TV or on their phones.
What if you swapped 20 minutes of mindless scrolling for reading? You'd gain knowledge and skills.
Favorite books include:
The 7 Habits of Highly Effective People — Stephen R. Covey
The War of Art — Steven Pressfield
The Psychology of Money — Morgan Housel
A New Earth — Eckart Tolle
Get Organized
All that screen time could've been spent organizing. It could have been used to clean, cook, or plan your week.
If you're always 'behind,' spend 15 minutes less on your phone to get organized.
"Give me six hours to chop down a tree, and I'll spend the first four sharpening the ax," said Abraham Lincoln. Getting organized is like sharpening an ax, making each day more efficient.
Creativity
Why not be creative instead of consuming others'? Do something creative, like:
Painting
Musically
Photography\sWriting
Do-it-yourself
Construction/repair
Creative projects boost happiness, cognitive functioning, and reduce stress and anxiety. Creative pursuits induce a flow state, a powerful mental state.
This contrasts with smartphones' effects. Heavy smartphone use correlates with stress, depression, and anxiety.
Hike
People spend 90% of their time indoors, according to research. This generation is the 'Indoor Generation'
We lack an active lifestyle, fresh air, and vitamin D3 due to our indoor lifestyle (generated through direct sunlight exposure). Mental and physical health issues result.
Put away your phone and get outside. Go on nature walks. Explore your city on foot (or by bike, as we do in Amsterdam) if you live in a city. Move around! Outdoors!
You can't spend your whole life staring at screens.
Podcasting
Okay, a smartphone is needed to listen to podcasts. When you use your phone to get smarter, you're more productive than 95% of people.
Favorite podcasts:
The Pomp Podcast (about cryptocurrencies)
The Joe Rogan Experience
Kwik Brain (by Jim Kwik)
Podcasts can be enjoyed while walking, cleaning, or doing laundry. Win-win.
Journalize
I find journaling helpful for mental clarity. Writing helps organize thoughts.
Instead of reading internet opinions, comments, and discussions, look inward. Instead of Twitter or TikTok, look inward.
“It never ceases to amaze me: we all love ourselves more than other people, but care more about their opinion than our own.” — Marcus Aurelius
Give your mind free reign with pen and paper. It will highlight important thoughts, emotions, or ideas.
Never write for another person. You want unfiltered writing. So you get the best ideas.
Find your best hobbies
List your best hobbies. I guarantee 95% of people won't list smartphone scrolling.
It's often low-quality entertainment. The dopamine spike is short-lived, and it leaves us feeling emotionally 'empty'
High-quality leisure sparks happiness. They make us happy and alive. Everyone has different interests, so these activities vary.
My favorite quality hobbies are:
Nature walks (especially the mountains)
Video game party
Watching a film with my girlfriend
Gym weightlifting
Complexity learning (such as the blockchain and the universe)
This brings me joy. They make me feel more fulfilled and 'rich' than social media scrolling.
Make a list of your best hobbies to refer to when you're spending too much time on your phone.