


More on Technology

Waleed Rikab, PhD
3 years ago
The Enablement of Fraud and Misinformation by Generative AI What You Should Understand
Recent investigations have shown that generative AI can boost hackers and misinformation spreaders.

Since its inception in late November 2022, OpenAI's ChatGPT has entertained and assisted many online users in writing, coding, task automation, and linguistic translation. Given this versatility, it is maybe unsurprising but nonetheless regrettable that fraudsters and mis-, dis-, and malinformation (MDM) spreaders are also considering ChatGPT and related AI models to streamline and improve their operations.
Malign actors may benefit from ChatGPT, according to a WithSecure research. ChatGPT promises to elevate unlawful operations across many attack channels. ChatGPT can automate spear phishing attacks that deceive corporate victims into reading emails from trusted parties. Malware, extortion, and illicit fund transfers can result from such access.
ChatGPT's ability to simulate a desired writing style makes spear phishing emails look more genuine, especially for international actors who don't speak English (or other languages like Spanish and French).
This technique could let Russian, North Korean, and Iranian state-backed hackers conduct more convincing social engineering and election intervention in the US. ChatGPT can also create several campaigns and various phony online personas to promote them, making such attacks successful through volume or variation. Additionally, image-generating AI algorithms and other developing techniques can help these efforts deceive potential victims.
Hackers are discussing using ChatGPT to install malware and steal data, according to a Check Point research. Though ChatGPT's scripts are well-known in the cyber security business, they can assist amateur actors with little technical understanding into the field and possibly develop their hacking and social engineering skills through repeated use.
Additionally, ChatGPT's hacking suggestions may change. As a writer recently indicated, ChatGPT's ability to blend textual and code-based writing might be a game-changer, allowing the injection of innocent content that would subsequently turn out to be a malicious script into targeted systems. These new AI-powered writing- and code-generation abilities allow for unique cyber attacks, regardless of viability.
OpenAI fears ChatGPT usage. OpenAI, Georgetown University's Center for Security and Emerging Technology, and Stanford's Internet Observatory wrote a paper on how AI language models could enhance nation state-backed influence operations. As a last resort, the authors consider polluting the internet with radioactive or misleading data to ensure that AI language models produce outputs that other language models can identify as AI-generated. However, the authors of this paper seem unaware that their "solution" might cause much worse MDM difficulties.
Literally False News
The public argument about ChatGPTs content-generation has focused on originality, bias, and academic honesty, but broader global issues are at stake. ChatGPT can influence public opinion, troll individuals, and interfere in local and national elections by creating and automating enormous amounts of social media material for specified audiences.
ChatGPT's capacity to generate textual and code output is crucial. ChatGPT can write Python scripts for social media bots and give diverse content for repeated posts. The tool's sophistication makes it irrelevant to one's language skills, especially English, when writing MDM propaganda.
I ordered ChatGPT to write a news piece in the style of big US publications declaring that Ukraine is on the verge of defeat in its fight against Russia due to corruption, desertion, and exhaustion in its army. I also gave it a fake reporter's byline and an unidentified NATO source's remark. The outcome appears convincing:

Worse, terrible performers can modify this piece to make it more credible. They can edit the general's name or add facts about current wars. Furthermore, such actors can create many versions of this report in different forms and distribute them separately, boosting its impact.
In this example, ChatGPT produced a news story regarding (fictional) greater moviegoer fatality rates:

Editing this example makes it more plausible. Dr. Jane Smith, the putative author of the medical report, might be replaced with a real-life medical person or a real victim of this supposed medical hazard.
Can deceptive texts be found? Detecting AI text is behind AI advancements. Minor AI-generated text alterations can upset these technologies.
Some OpenAI individuals have proposed covert methods to watermark AI-generated literature to prevent its abuse. AI models would create information that appears normal to humans but would follow a cryptographic formula that would warn other machines that it was AI-made. However, security experts are cautious since manually altering the content interrupts machine and human detection of AI-generated material.
How to Prepare
Cyber security and IT workers can research and use generative AI models to fight spear fishing and extortion. Governments may also launch MDM-defence projects.
In election cycles and global crises, regular people may be the most vulnerable to AI-produced deceit. Until regulation or subsequent technical advances, individuals must recognize exposure to AI-generated fraud, dating scams, other MDM activities.
A three-step verification method of new material in suspicious emails or social media posts can help identify AI content and manipulation. This three-step approach asks about the information's distribution platform (is it reliable? ), author (is the reader familiar with them? ), and plausibility given one's prior knowledge of the topic.
Consider a report by a trusted journalist that makes shocking statements in their typical manner. AI-powered fake news may be released on an unexpected platform, such as a newly created Facebook profile. However, if it links to a known media source, it is more likely to be real.
Though hard and subjective, this verification method may be the only barrier against manipulation for now.
AI language models:
How to Recognize an AI-Generated Article ChatGPT, the popular AI-powered chatbot, can and likely does generate medium.com-style articles.
AI-Generated Text Detectors Fail. Do This. Online tools claim to detect ChatGPT output. Even with superior programming, I tested some of these tools. pub
Why Original Writers Matter Despite AI Language Models Creative writers may never be threatened by AI language models.

Jussi Luukkonen, MBA
3 years ago
Is Apple Secretly Building A Disruptive Tsunami?
A TECHNICAL THOUGHT
The IT giant is seeding the digital Great Renaissance.

Recently, technology has been dull.
We're still fascinated by processing speeds. Wearables are no longer an engineer's dream.
Apple has been quiet and avoided huge announcements. Slowness speaks something. Everything in the spaceship HQ seems to be turning slowly, unlike competitors around buzzwords.
Is this a sign of the impending storm?
Metas stock has fallen while Google milks dumb people. Microsoft steals money from corporations and annexes platforms like Linkedin.
Just surface bubbles?
Is Apple, one of the technology continents, pushing against all others to create a paradigm shift?
The fundamental human right to privacy
Apple's unusual remarks emphasize privacy. They incorporate it into their business models and judgments.
Apple believes privacy is a human right. There are no compromises.
This makes it hard for other participants to gain Apple's ecosystem's efficiencies.
Other players without hardware platforms lose.
Apple delivers new kidneys without rejection, unlike other software vendors. Nothing compromises your privacy.
Corporate citizenship will become more popular.
Apples have full coffers. They've started using that flow to better communities, which is great.
Apple's $2.5B home investment is one example. Google and Facebook are building or proposing to build workforce housing.
Apple's funding helps marginalized populations in more than 25 California counties, not just Apple employees.
Is this a trend, and does Apple keep giving back? Hope so.
I'm not cynical enough to suspect these investments have malicious motives.
The last frontier is the environment.
Climate change is a battle-to-win.
Long-term winners will be companies that protect the environment, turning climate change dystopia into sustainable growth.
Apple has been quietly changing its supply chain to be carbon-neutral by 2030.
“Apple is dedicated to protecting the planet we all share with solutions that are supporting the communities where we work.” Lisa Jackson, Apple’s vice president of environment.
Apple's $4.7 billion Green Bond investment will produce 1.2 gigawatts of green energy for the corporation and US communities. Apple invests $2.2 billion in Europe's green energy. In the Philippines, Thailand, Nigeria, Vietnam, Colombia, Israel, and South Africa, solar installations are helping communities obtain sustainable energy.
Apple is already carbon neutral today for its global corporate operations, and this new commitment means that by 2030, every Apple device sold will have net zero climate impact. -Apple.
Apple invests in green energy and forests to reduce its paper footprint in China and the US. Apple and the Conservation Fund are safeguarding 36,000 acres of US working forest, according to GreenBiz.
Apple's packaging paper is recycled or from sustainably managed forests.
What matters is the scale.
$1 billion is a rounding error for Apple.
These small investments originate from a tree with deep, spreading roots.
Apple's genes are anchored in building the finest products possible to improve consumers' lives.
I felt it when I switched to my iPhone while waiting for a train and had to pack my Macbook. iOS 16 dictation makes writing more enjoyable. Small change boosts productivity. Smooth transition from laptop to small screen and dictation.
Apples' tiny, well-planned steps have great growth potential for all consumers in everything they do.
There is clearly disruption, but it doesn't have to be violent
Digital channels, methods, and technologies have globalized human consciousness. One person's responsibility affects many.
Apple gives us tools to be privately connected. These technologies foster creativity, innovation, fulfillment, and safety.
Apple has invented a mountain of technologies, services, and channels to assist us adapt to the good future or combat evil forces who cynically aim to control us and ruin the environment and communities. Apple has quietly disrupted sectors for decades.
Google, Microsoft, and Meta, among others, should ride this wave. It's a tsunami, but it doesn't have to be devastating if we care, share, and cooperate with political decision-makers and community leaders worldwide.
A fresh Renaissance
Renaissance geniuses Michelangelo and Da Vinci. Different but seeing something no one else could yet see. Both were talented in many areas and could discover art in science and science in art.
These geniuses exemplified a period that changed humanity for the better. They created, used, and applied new, valuable things. It lives on.
Apple is a digital genius orchard. Wozniak and Jobs offered us fertile ground for the digital renaissance. We'll build on their legacy.
We may put our seeds there and see them bloom despite corporate greed and political ignorance.
I think the coming tsunami will illuminate our planet like the Renaissance.

Mark Schaefer
3 years ago
20 Fun Uses for ChatGPT

Our RISE community is stoked on ChatGPT. ChatGPT has countless uses.
Early on. Companies are figuring out the legal and ethical implications of AI's content revolution. Using AI for everyday tasks is cool.
So I challenged RISE friends... Let's have fun and share non-obvious uses.
Onward!
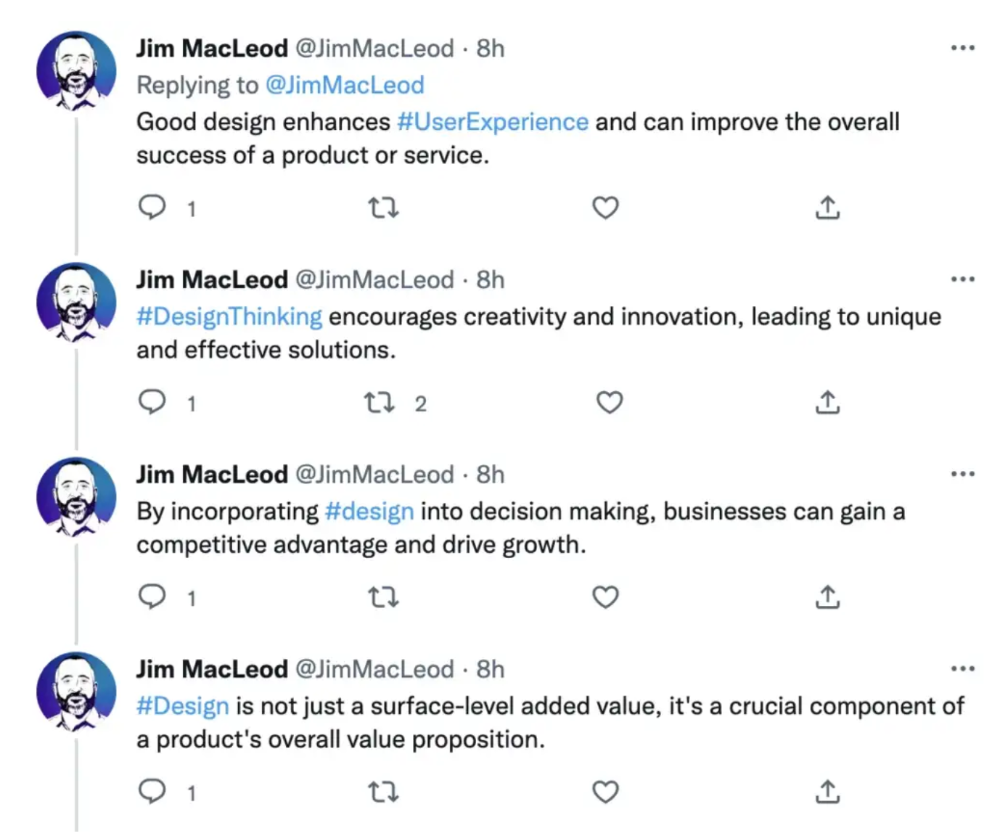
1. Tweet
Jim MacLeod requested a design-themed Twitter thread from ChatGPT.
2. Novelize
Giuseppe Fratoni writes novels.
"This is amazing!" Impotent. I asked about writing, mystery novels, and jazz.
"Develop a mystery novel plot in which a disillusioned homicide detective hunts a serial killer who targets jazz musicians who play Autumn Leaves."
"I have:
Detective James Thompson is a seasoned veteran of the Homicide department, but lately he’s been feeling burnt out and disillusioned. His latest case, the murder of a young jazz pianist who was found brutally killed in his home, only serves to deepen his sense of despair … (much more provided)
3. Question-and-answer sessions
Bliss recommends:
You have a guest speaker and want to ask audience questions.
Pre-generate questions with ChatGPT. "And here's a question from our AI?"
The conference is about Western water scarcity. Water management expert. My AI question was...
Which desalination-related questions should I ask an expert?
ChatGPT said...
How is desalination currently being used around the world, and in what types of locations is it most effective?
What are the potential advantages and disadvantages of using desalination to provide fresh water?
What are some of the key challenges and limitations of desalination technology, and how are they being addressed?
4. Game-making
Richard's a board game expert. He suggests using ChatGPT to plan games. Note: Some people have started getting help solving crossword puzzle clues.
5. Matchmaking
Tanya Thompson thinks it helps dating. ChatGPT:
Here are some flirty first-message ideas for dating apps:
I noticed you from afar. I had to say hi and see if we clicked.
Your profile picture is gorgeous. I'm obsessed with your [Feature] and want to know you better.
I don't usually message first, but I had to. You're [Attractive Quality] and I can't wait to talk.”
Hello. Your profile intimidates me. I'm starstruck by your [Attractiveness]. (Many instances)
5. Solitude/anxiety
ChatGPT excels at one-on-one conversations.
PepperBrooks: "I'm sad and lonely."
ChatGPT: I’m sorry to hear that you’re feeling sad and lonely. It’s natural to feel down sometimes, but it’s important to remember that you’re not alone. There are many people who care about you and want to help you. It can be helpful to talk to someone about your feelings, whether it’s a close friend, family member, or mental health professional.
Sometimes, just expressing your thoughts and emotions to someone else can help to alleviate your sadness and loneliness. It’s also important to take care of yourself and do things that make you happy, such as spending time with loved ones, pursuing a hobby, or exercising. These things can help to improve your mood and make you feel more connected to others. Remember that you are strong and capable, and that you can get through this difficult time.
Daniel Nestle asked ChatGPT to generate journal prompts to help him deal with anxiety.
Write down the things that are causing you anxiety at the moment.
Describe a situation in which you felt anxious and how you coped with it.
Reflect on how your thoughts and beliefs contribute to your anxiety.
Write a letter to your anxiety, expressing your feelings and concerns
Imagine yourself in a calm and peaceful place, and describe it in detail.
(many more items followed)
6. Names
Continued Daniel:
Also, naming ideas.
Me: Name this drink. Japanese gin, unsweetened tonic, lime, Szechuan pepper, grapefruit.
ChatGPT: How about “Sakura Sunrise?” The name incorporates the Japanese gin and the citrus flavors of grapefruit and lime, and the word “sunrise” suggests a fresh and invigorating start to the day. Alternatively, you could go with something like “Peppered Grapefruit Gin Fizz” to emphasize the unique flavor combination of Szechuan pepper and grapefruit.
7. Translation on the go
Monks recommends: ChatGPT is a perfect mobile translation tool. Say you need help in Italy.
ME: Translate to Italian
Where is the nearest gas station?
ChatGPT: “La mia auto sta per esaurire il carburante, mi puoi dire dove si trova la stazione di servizio più vicina?”
8. Fitness
Monks added:
ME: In 3 months, I want to run 5km. Plan out how I can do this.
ChatGPT: Here's a 3-month plan to run 5km.
Start by walking for 15–20 minutes each day to build up your endurance and get your body used to regular exercise.
After a week of walking, begin incorporating short jogs into your routine. Start by jogging for 1–2 minutes at a time, with walking breaks in between. Gradually increase the length of your jogs and reduce the amount of time you spend walking.
Once you can jog for 10 minutes without stopping, start increasing the distance of your runs. Aim to run 1km without stopping and then gradually increase the distance over time.
In addition to your regular runs, incorporate strength training and stretching into your routine to improve your overall fitness and reduce the risk of injury.
(more details continued on)
9. Integrations and coding
10. Teacher lesson plans
Spencer Crandall saved time.
This morning, I wondered who has the hardest job. Teachers.
Many students, little time. ChatGPT could handle lesson planning. I tried it and got this.
Lesson Title: The History and Impact of Artificial Intelligence
Students will understand the history and development of AI and the potential positive and negative impacts on society.
AI timeline AI technologies and applications
Overview:
Introduce the topic of artificial intelligence, and explain that it refers to the development of computer systems and algorithms that can simulate human intelligence and behavior.
Show the timeline of significant events in the history of AI, and discuss the key milestones and developments in the field.
Show examples of AI technologies and applications, and explain how they are used in various industries and fields.
Discuss the potential positive and negative impacts of AI on society, including its potential to improve productivity, efficiency, and safety, as well as its potential to create new challenges and concerns, such as job displacement and ethical issues.
(many more details followed)
11. Find podcast guests.
Joeri Billast suggested:
Who should be on my Web3 podcast?
ChatGPT: Web3 marketing experts, influencers, and thought leaders make great podcast guests. These include Web3 marketers, content creators, business owners, entrepreneurs, and technologists. You could invite Web3 startups and organizations to your podcast.
Please give examples.
ChatGPT: Ideal Web3 marketing podcast guests include:
Tim Berner-Lee, inventor of the World Wide Web
Chris Dixon, general partner at Andreessen Horowitz
Vitalik Buterin, founder of Ethereum
Joe Lubin, founder of ConsenSys
Susan Fowler, author of Whistleblower
(many other suggestions)
12. Comments and reviews on social media
Lisa Monk thinks ChatGPT can help retail staff with social media.
She asked ChatGPT to "review this restaurant"
POSITIVE CUSTOMER REVIEW: I absolutely love this place. We eat out a lot however this place has topped it all. Perfect meals, amazing staff and the timing for it all was great! Special thanks to Sophie B (you rock) From your guests all the way from the Gold Coast, THANK YOU
ChatGPT REPLY: Thank you so much for your kind words and for taking the time to write a review. We are delighted to hear that you had such a great experience at our restaurant. We are thrilled that you enjoyed your meal and the service provided by Sophie. It’s always a pleasure to serve guests visiting from the Gold Coast and we are grateful for your support. We look forward to welcoming you back again soon. Thank you again for your positive review.
CUSTOMER REVIEW: Most average food, there is a nice view, But that’s about it
ChatGPT: Thank you for your review. We apologize if your dining experience was not up to your expectations. We strive to provide top-quality food and service to all of our customers, and we will take your feedback into consideration as we continue to improve. Thank you for letting us know about your experience.
13. Crime-fighting
Zack Seipert said, "I researched some famous unsolved murders, and ChatGPT laid out the crime, suspects, clues, and more." I bet experienced detectives could solve some of these cold cases.
14. Reduce bias
Joanne Taylor struggles to remove biases from her writing. She asked ChatGPT for ideas.
I asked ChatGPT to check a text for racial bias, and it did well.
15. Furnishings
I designed a small, unique table using ChatGPT and MidJourney. I edited ChatGPT's idea for clarity and brevity before entering it in MidJourney.
Results:

16. Serialize a novel
Scott Scowcoft led ChatCPT through iterations of a story text to create serialized novel frames. You can view this here.
17. Interview preparation
I was on a sales podcast. Although this is marketing-related, it's not my forte. I asked ChatGPT for help with a sales interview. Response:
Here are some interview questions about the future of sales and how to answer them.
How will technology affect sales in the future?
Technology will impact sales in the coming years. Automation and AI could be used to handle routine tasks, and data analysis and CRM could become more important. E-commerce and online sales channels are also reshaping the sales landscape.
How will the salesperson's role change?
Future sales roles may change in response to changing customer needs and expectations. Salespeople must be knowledgeable and consultative to help customers navigate complex products and services. Increasing importance of data analysis and CRM tools will require salespeople to understand and use technology effectively.
Future sales professionals will need what skills?
Future salespeople will need many skills. Sales professionals must have strong communication and interpersonal skills, as well as product and service knowledge and the ability to use data analysis and CRM tools effectively. Adapting to changing customer needs and staying current on industry trends will also be important for sales success.
18. Gift ideas
I need Christmas gift ideas for my wife. I asked:
Suggest a gift idea under $200 for a middle-aged woman who loves The Eagles.
A middle-aged woman who loves The Eagles might like a vinyl record of "Hotel California" or "The Long Run." Many music fans enjoy the unique sound and experience of vinyl records.
Pair the record with a high-quality record player for a complete gift. The vinyl record and record player should fit within your $200 budget for an Eagles fan.
19. Explaining complex concepts
I entered: Explain quantum physics to me as if I were 10 years old.
Quantum physics is a branch of science that studies how tiny particles, like atoms and subatomic particles, behave. These particles are so small that they don’t always follow the same rules as the things we can see and touch every day.
For example, sometimes they can be in two places at the same time, or they can be friends with each other even if they are far apart. This might sound strange, but it’s what scientists have learned from studying these tiny particles. Quantum physics helps us understand how the world works at a very small scale, and it can also help us make new technologies, like computers that are much faster than the ones we have today.
20. AP-style editing
Blogs, journals, and books follow AP Style. I asked ChatGPT to "edit using AP Style" and it did a great job.
And then... "Write a catchy headline for a blog post about 16 ChatGPT uses"
Here are some possible blog post titles for 20 creative ChatGPT uses:
“20 Fun and Creative Ways to Use ChatGPT: From Games to Quizzes and More”
“The Ultimate Guide to Using ChatGPT for Entertainment and Creativity”
“20 Reasons to Use ChatGPT: How it Can Enhance Your Gaming, Storytelling, and More”
20 Entertaining Uses for ChatGPT You Never Knew Were Possible”
“Unleash Your Imagination with ChatGPT: 16 Creative and Fun Ways to Use it”
In a previous post, I said ChatGPT will change marketing careers forever. I have never made a statement like that in my life. Even in the early days of the internet, people were cautious.
This technology was just released two weeks ago, and over a million people are already using it. This is the fastest technology adoption in history.
Today's post offers inventive and entertaining ideas, but it's just the beginning. ChatGPT writes code, music, and papers.
You might also like
Langston Thomas
3 years ago
A Simple Guide to NFT Blockchains
Ethereum's blockchain rules NFTs. Many consider it the one-stop shop for NFTs, and it's become the most talked-about and trafficked blockchain in existence.
Other blockchains are becoming popular in NFTs. Crypto-artists and NFT enthusiasts have sought new places to mint and trade NFTs due to Ethereum's high transaction costs and environmental impact.
When choosing a blockchain to mint on, there are several factors to consider. Size, creator costs, consumer spending habits, security, and community input are important. We've created a high-level summary of blockchains for NFTs to help clarify the fast-paced world of web3 tech.
Ethereum
Ethereum currently has the most NFTs. It's decentralized and provides financial and legal services without intermediaries. It houses popular NFT marketplaces (OpenSea), projects (CryptoPunks and the Bored Ape Yacht Club), and artists (Pak and Beeple).
It's also expensive and energy-intensive. This is because Ethereum works using a Proof-of-Work (PoW) mechanism. PoW requires computers to solve puzzles to add blocks and transactions to the blockchain. Solving these puzzles requires a lot of computer power, resulting in astronomical energy loss.
You should consider this blockchain first due to its popularity, security, decentralization, and ease of use.
Solana
Solana is a fast programmable blockchain. Its proof-of-history and proof-of-stake (PoS) consensus mechanisms eliminate complex puzzles. Reduced validation times and fees result.
PoS users stake their cryptocurrency to become a block validator. Validators get SOL. This encourages and rewards users to become stakers. PoH works with PoS to cryptographically verify time between events. Solana blockchain ensures transactions are in order and found by the correct leader (validator).
Solana's PoS and PoH mechanisms keep transaction fees and times low. Solana isn't as popular as Ethereum, so there are fewer NFT marketplaces and blockchain traders.
Tezos
Tezos is a greener blockchain. Tezos rose in 2021. Hic et Nunc was hailed as an economic alternative to Ethereum-centric marketplaces until Nov. 14, 2021.
Similar to Solana, Tezos uses a PoS consensus mechanism and only a PoS mechanism to reduce computational work. This blockchain uses two million times less energy than Ethereum. It's cheaper than Ethereum (but does cost more than Solana).
Tezos is a good place to start minting NFTs in bulk. Objkt is the largest Tezos marketplace.
Flow
Flow is a high-performance blockchain for NFTs, games, and decentralized apps (dApps). Flow is built with scalability in mind, so billions of people could interact with NFTs on the blockchain.
Flow became the NBA's blockchain partner in 2019. Flow, a product of Dapper labs (the team behind CryptoKitties), launched and hosts NBA Top Shot, making the blockchain integral to the popularity of non-fungible tokens.
Flow uses PoS to verify transactions, like Tezos. Developers are working on a model to handle 10,000 transactions per second on the blockchain. Low transaction fees.
Flow NFTs are tradeable on Blocktobay, OpenSea, Rarible, Foundation, and other platforms. NBA, NFL, UFC, and others have launched NFT marketplaces on Flow. Flow isn't as popular as Ethereum, resulting in fewer NFT marketplaces and blockchain traders.
Asset Exchange (WAX)
WAX is king of virtual collectibles. WAX is popular for digitalized versions of legacy collectibles like trading cards, figurines, memorabilia, etc.
Wax uses a PoS mechanism, but also creates carbon offset NFTs and partners with Climate Care. Like Flow, WAX transaction fees are low, and network fees are redistributed to the WAX community as an incentive to collectors.
WAX marketplaces host Topps, NASCAR, Hot Wheels, and cult classic film franchises like Godzilla, The Princess Bride, and Spiderman.
Binance Smart Chain
BSC is another good option for balancing fees and performance. High-speed transactions and low fees hurt decentralization. BSC is most centralized.
Binance Smart Chain uses Proof of Staked Authority (PoSA) to support a short block time and low fees. The 21 validators needed to run the exchange switch every 24 hours. 11 of the 21 validators are directly connected to the Binance Crypto Exchange, according to reports.
While many in the crypto and NFT ecosystems dislike centralization, the BSC NFT market picked up speed in 2021. OpenBiSea, AirNFTs, JuggerWorld, and others are gaining popularity despite not having as robust an ecosystem as Ethereum.

Alison Randel
3 years ago
Raising the Bar on Your 1:1s

Managers spend much time in 1:1s. Most team members meet with supervisors regularly. 1:1s can help create relationships and tackle tough topics. Few appreciate the 1:1 format's potential. Most of the time, that potential is spent on small talk, surface-level updates, and ranting (Ugh, the marketing team isn’t stepping up the way I want them to).
What if you used that time to have deeper conversations and important insights? What if change was easy?
This post introduces a new 1:1 format to help you dive deeper, faster, and develop genuine relationships without losing impact.
A 1:1 is a chat, you would assume. Why use structure to talk to a coworker? Go! I know how to talk to people. I can write. I've always written. Also, This article was edited by Zoe.
Before you discard something, ask yourself if there's a good reason not to try anything new. Is the 1:1 only a talk, or do you want extra benefits? Try the steps below to discover more.
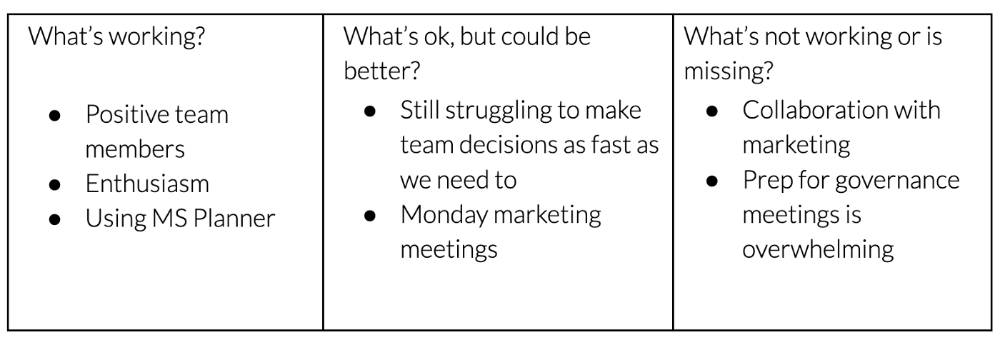
I. Reflection (5 minutes)
Context-free, broad comments waste time and are useless. Instead, give team members 5 minutes to write these 3 prompts.
What's effective?
What is decent but could be improved?
What is broken or missing?
Why these? They encourage people to be honest about all their experiences. Answering these questions helps people realize something isn't working. These prompts let people consider what's working.
Why take notes? Because you get more in less time. Will you feel awkward sitting quietly while your coworker writes? Probably. Persevere. Multi-task. Take a break from your afternoon meeting marathon. Any awkwardness will pay off.
What happens? After a few minutes of light conversation, create a template like the one given here and have team members fill in their replies. You can pre-share the template (with the caveat that this isn’t meant to take much prep time). Do this with your coworker: Answer the prompts. Everyone can benefit from pondering and obtaining guidance.
This step's output.
Part II: Talk (10-20 minutes)
Most individuals can explain what they see but not what's behind an answer. You don't like a meeting. Why not? Marketing partnership is difficult. What makes working with them difficult? I don't recommend slandering coworkers. Consider how your meetings, decisions, and priorities make work harder. The excellent stuff too. You want to know what's humming so you can reproduce the magic.
First, recognize some facts.
Real power dynamics exist. To encourage individuals to be honest, you must provide a safe environment and extend clear invites. Even then, it may take a few 1:1s for someone to feel secure enough to go there in person. It is part of your responsibility to admit that it is normal.
Curiosity and self-disclosure are crucial. Most leaders have received training to present themselves as the authorities. However, you will both benefit more from the dialogue if you can be open and honest about your personal experience, ask questions out of real curiosity, and acknowledge the pertinent sacrifices you're making as a leader.
Honesty without bias is difficult and important. Due to concern for the feelings of others, people frequently hold back. Or if they do point anything out, they do so in a critical manner. The key is to be open and unapologetic about what you observe while not presuming that your viewpoint is correct and that of the other person is incorrect.
Let's go into some prompts (based on genuine conversations):
“What do you notice across your answers?”
“What about the way you/we/they do X, Y, or Z is working well?”
“ Will you say more about item X in ‘What’s not working?’”
“I’m surprised there isn’t anything about Z. Why is that?”
“All of us tend to play some role in maintaining certain patterns. How might you/we be playing a role in this pattern persisting?”
“How might the way we meet, make decisions, or collaborate play a role in what’s currently happening?”
Consider the preceding example. What about the Monday meeting isn't working? Why? or What about the way we work with marketing makes collaboration harder? Remember to share your honest observations!
Third section: observe patterns (10-15 minutes)
Leaders desire to empower their people but don't know how. We also have many preconceptions about what empowerment means to us and how it works. The next phase in this 1:1 format will assist you and your team member comprehend team power and empowerment. This understanding can help you support and shift your team member's behavior, especially where you disagree.
How to? After discussing the stated responses, ask each team member what they can control, influence, and not control. Mark their replies. You can do the same, adding colors where you disagree.
This step's output.
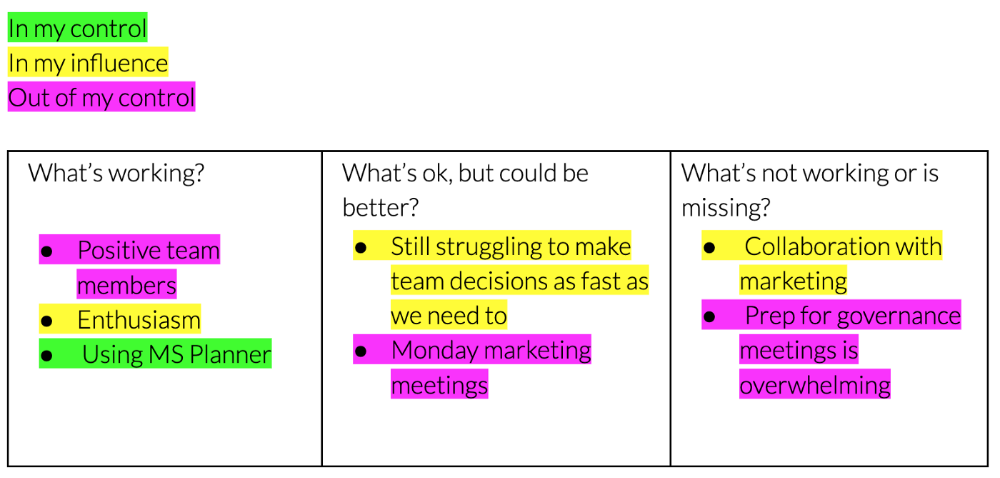
Next, consider the color constellation. Discuss these questions:
Is one color much more prevalent than the other? Why, if so?
Are the colors for the "what's working," "what's fine," and "what's not working" categories clearly distinct? Why, if so?
Do you have any disagreements? If yes, specifically where does your viewpoint differ? What activities do you object to? (Remember, there is no right or wrong in this. Give explicit details and ask questions with curiosity.)
Example: Based on the colors, you can ask, Is the marketing meeting's quality beyond your control? Were our marketing partners consulted? Are there any parts of team decisions we can control? We can't control people, but have we explored another decision-making method? How can we collaborate and generate governance-related information to reduce work, even if the requirement for prep can't be eliminated?
Consider the top one or two topics for this conversation. No 1:1 can cover everything, and that's OK. Focus on the present.
Part IV: Determine the next step (5 minutes)
Last, examine what this conversation means for you and your team member. It's easy to think we know the next moves when we don't.
Like what? You and your teammate answer these questions.
What does this signify moving ahead for me? What can I do to change this? Make requests, for instance, and see how people respond before thinking they won't be responsive.
What demands do I have on other people or my partners? What should I do first? E.g. Make a suggestion to marketing that we hold a monthly retrospective so we can address problems and exchange input more frequently. Include it on the meeting's agenda for next Monday.
Close the 1:1 by sharing what you noticed about the chat. Observations? Learn anything?
Yourself, you, and the 1:1
As a leader, you either reinforce or disrupt habits. Try this template if you desire greater ownership, empowerment, or creativity. Consider how you affect surrounding dynamics. How can you expect others to try something new in high-stakes scenarios, like meetings with cross-functional partners or senior stakeholders, if you won't? How can you expect deep thought and relationship if you don't encourage it in 1:1s? What pattern could this new format disrupt or reinforce?
Fight reluctance. First attempts won't be ideal, and that's OK. You'll only learn by trying.

Dr Mehmet Yildiz
3 years ago
How I train my brain daily for clarity and productivity.
I use a conceptual and practical system I developed decades ago as an example.
Since childhood, I've been interested in the brain-mind connection, so I developed a system using scientific breakthroughs, experiments, and the experiences of successful people in my circles.
This story provides a high-level overview of a custom system to inform and inspire readers. Creating a mind gym was one of my best personal and professional investments.
Such a complex system may not be possible for everyone or appear luxurious at first. However, the process and approach may help you find more accessible and viable solutions.
Visualizing the brain as a muscle, I learned to stimulate it with physical and mental exercises, applying a new mindset and behavioral changes.
My methods and practices may not work for others because we're all different. I focus on the approach's principles and highlights so you can create your own program.
Some create a conceptual and practical system intuitively, and others intellectually. Both worked. I see intellect and intuition as higher selves.
The mental tools I introduce are based on lifestyle changes and can be personalized by anyone, barring physical constraints or underlying health conditions.
Some people can't meditate despite wanting to due to mental constraints. This story lacks exceptions.
People's systems may vary. Many have used my tools successfully. All have scientific backing because their benefits attracted scientists. None are unethical or controversial.
My focus is cognition, which is the neocortex's ability. These practices and tools can affect the limbic and reptilian brain regions.
A previous article discussed brain health's biological aspects. This article focuses on psychology.
Thinking, learning, and remembering are cognitive abilities. Cognitive abilities determine our health and performance.
Cognitive health is the ability to think, concentrate, learn, and remember. Cognitive performance boosting involves various tools and processes. My system and protocols address cognitive health and performance.
As a biological organ, the brain's abilities decline with age, especially if not used regularly. Older people have more neurodegenerative disorders like dementia.
As aging is inevitable, I focus on creating cognitive reserves to remain mentally functional as we age and face mental decline or cognitive impairment.
My protocols focus on neurogenesis, or brain growth and maintenance. Neurons and connections can grow at any age.
Metacognition refers to knowing our cognitive abilities, like thinking about thinking and learning how to learn.
In the following sections, I provide an overview of my system, mental tools, and protocols.
This system summarizes my 50-year career. Some may find it too abstract, so I give examples.
First, explain the system. Section 2 introduces activities. Third, how to measure and maintain mental growth.
1 — Developed a practical mental gym.
The mental gym is a metaphor for the physical fitness gym to improve our mental muscles.
This concept covers brain and mind functionality. Integrated biological and psychological components.
I'll describe my mental gym so my other points make sense. My mental gym has physical and mental tools.
Mindfulness, meditation, visualization, self-conversations, breathing exercises, expressive writing, working in a flow state, reading, music, dance, isometric training, barefoot walking, cold/heat exposure, CBT, and social engagements are regular tools.
Dancing, walking, and thermogenesis are body-related tools. As the brain is part of the body and houses the mind, these tools can affect mental abilities such as attention, focus, memory, task switching, and problem-solving.
Different people may like different tools. I chose these tools based on my needs, goals, and lifestyle. They're just examples. You can choose tools that fit your goals and personality.
2 — Performed tasks regularly.
These tools gave me clarity. They became daily hobbies. Some I did alone, others with others.
Some examples: I meditate daily. Even though my overactive mind made daily meditation difficult at first, I now enjoy it. Meditation three times a day sharpens my mind.
Self-talk is used for self-therapy and creativity. Self-talk was initially difficult, but neurogenesis rewired my brain to make it a habit.
Cold showers, warm baths with Epsom salts, fasting, barefoot walks on the beach or grass, dancing, calisthenics, trampoline hopping, and breathing exercises increase my mental clarity, creativity, and productivity.
These exercises can increase BDNF, which promotes nervous system growth. They improve mental capacity and performance by increasing blood flow and brain oxygenation.
I use weekly and occasional activities like dry saunas, talking with others, and community activities.
These activities stimulate the brain and mind, improving performance and cognitive capacity.
3 — Measured progress, set growth goals.
Measuring progress helps us stay on track. Without data, it's hard to stay motivated. When we face inevitable setbacks, we may abandon our dreams.
I created a daily checklist for a spreadsheet with macros. I tracked how often and long I did each activity.
I measured my progress objectively and subjectively. In the progress spreadsheet, I noted my meditation hours and subjective feelings.
In another column, I used good, moderate, and excellent to get qualitative data. It took time and effort. Later, I started benefiting from this automated structure.
Creating a page for each activity, such as meditation, self-talk, cold showers, walking, expressive writing, personal interactions, etc., gave me empirical data I could analyze, modify, and graph to show progress.
Colored charts showed each area's strengths and weaknesses.
Strengths motivate me to continue them. Identifying weaknesses helped me improve them.
As the system matured, data recording became a habit and took less time. I saw the result immediately because I automated the charts when I entered daily data. Early time investment paid off later.
Mind Gym Benefits, Effective Use, and Progress Measuring
This concept helped me move from comfort to risk. I accept things as they are.
Turnarounds were made. I stopped feeling "Fight-Flight-Freeze" and maintained self-control.
I tamed my overactive amygdala by strengthening my brain. Stress and anxiety decreased. With these shifts, I accepted criticism and turned envy into admiration. Clarity improved.
When the cognitive part of the brain became stronger and the primitive part was tamed, managing thoughts and emotions became easier. My AQ increased. I learned to tolerate people, physical, mental, and emotional obstacles.
Accessing vast information sources in my subconscious mind through an improved RAS allowed me to easily tap into my higher self and recognize flaws in my lower self.
Summary
The brain loves patterns and routines, so habits help. Observing, developing, and monitoring habits mindfully can be beneficial. Mindfulness helps us achieve this goal systematically.
As body and mind are connected, we must consider both when building habits. Consistent and joyful practices can strengthen neurons and neural connections.
Habits help us accomplish more with less effort. Regularly using mental tools and processes can improve our cognitive health and performance as we age.
Creating daily habits to improve cognitive abilities can sharpen our minds and boost our well-being.
Some apps monitor our activities and behavior to help build habits. If you can't replicate my system, try these apps. Some smartwatches and fitness devices include them.
Set aside time each day for mental activities you enjoy. Regular scheduling and practice can strengthen brain regions and form habits. Once you form habits, tasks become easy.
Improving our minds is a lifelong journey. It's easier and more sustainable to increase our efforts daily, weekly, monthly, or annually.
Despite life's ups and downs, many want to remain calm and cheerful.
This valuable skill is unrelated to wealth or fame. It's about our mindset, fueled by our biological and psychological needs.
Here are some lessons I've learned about staying calm and composed despite challenges and setbacks.
1 — Tranquillity starts with observing thoughts and feelings.
2 — Clear the mental clutter and emotional entanglements with conscious breathing and gentle movements.
3 — Accept situations and events as they are with no resistance.
4 — Self-love can lead to loving others and increasing compassion.
5 — Count your blessings and cultivate gratitude.
Clear thinking can bring joy and satisfaction. It's a privilege to wake up with a healthy body and clear mind, ready to connect with others and serve them.
Thank you for reading my perspectives. I wish you a healthy and happy life.