


More on Entrepreneurship

Nick
3 months ago
This Is How Much Quora Paid Me For 23 Million Content Views
You’ll be surprised; I sure was

Blogging and writing online as a side income has now been around for a significant amount of time. Nowadays, it is a continuously rising moneymaker for prospective writers, with several writing platforms existing online. At the top of the list are Medium, Vocal Media, Newsbreak, and the biggest one of them, Quora, with 300 million active users.
Quora, unlike Medium, is a question-and-answer format platform. On Medium you are permitted to write what you want, while on Quora, you answer questions on topics that you have expertise about. Quora, like Medium, now compensates its authors for the answers they provide in comparison to the previous, in which you had to be admitted to the partner program and were paid to ask questions.
Quora just recently went live with this new partner program, Quora Plus, and the way it works is that it is a subscription for $5 a month which provides you access to metered/monetized stories, in turn compensating the writers for part of that subscription for their answers.
I too on Quora have found a lot of success on the platform, gaining 23 Million Content Views, and 300,000 followers for my space, which is kind of the Quora equivalent of a Medium article. The way in which I was able to do this was entirely thanks to a hack that I uncovered to the Quora algorithm.
In this article, I plan on discussing how much money I received from 23 million content views on Quora, and I bet you’ll be shocked; I know I was.
A Brief Explanation of How I Got 23 Million Views and How You Can Do It Too
On Quora, everything in terms of obtaining views is about finding the proper question, which I only understood quite late into the game. I published my first response in 2019 but never actually wrote on Quora until the summer of 2020, and about a month into posting consistently I found out how to find the perfect question. Here’s how:
The Process
Go to your Home Page and start scrolling… While browsing, check for the following things…
Answers from people you follow or your followers.
Advertisements
These two things are the two things you want to ignore, you don’t want to answer those questions or look at the ads. You should now be left with a couple of recommended answers. To discover which recommended answer is the best to answer as well, look at these three important aspects.
Date of the answer: Was it in the past few days, preferably 2–3 days, even better, past 24 hours?
Views: Are they in the ten thousands or hundred thousands?
Upvotes: Are they in the hundreds or thousands?
Now, choose an answer to a question which you think you could answer as well that satisfies the requirements above. Once you click on it, as all answers on Quora works, it will redirect you to the page for that question, in which you will have to select once again if you should answer the question.
Amount of answers: How many responses are there to the given question? This tells you how much competition you have. My rule is beyond 25 answers, you shouldn’t answer, but you can change it anyway you’d like.
Answerers: Who did the answering for the question? If the question includes a bunch of renowned, extremely well-known people on Quora, there’s a good possibility your essay is going to get drowned out.
Views: Check for a constant quantity of high views on each answer for the question; this is what will guarantee that your answer gets a lot of views!
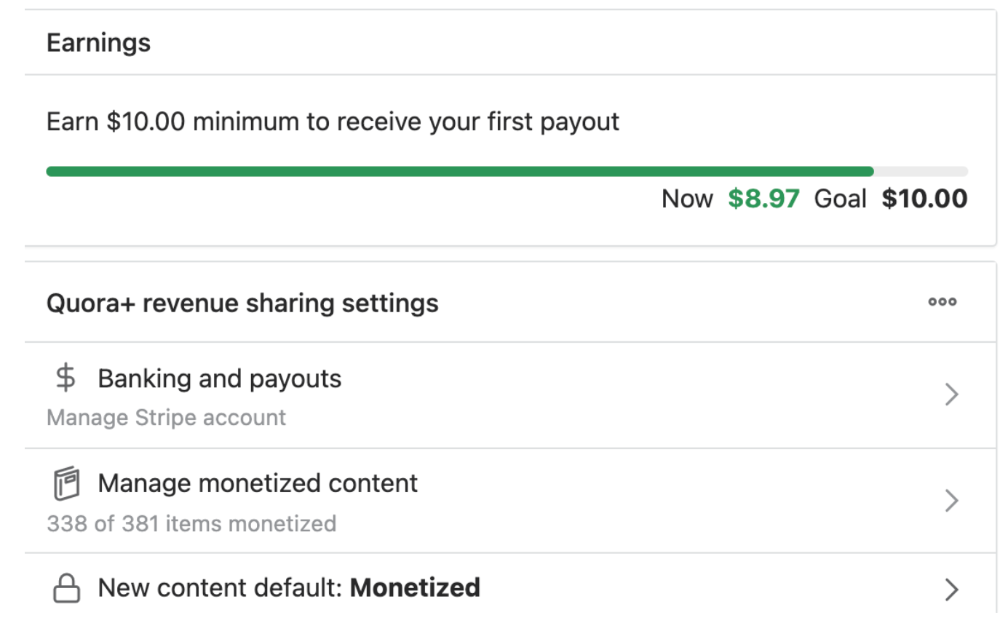
The Income Reveal! How Much I Made From 23 Million Content Views
DRUM ROLL, PLEASE!
8.97 USD. Yes, not even ten dollars, not even nine. Just eight dollars and ninety-seven cents.
Possible Reasons for My Low Earnings
Quora Plus and the answering partner program are newer than my Quora views.
Few people use Quora+, therefore revenues are low.
I haven't been writing much on Quora, so I'm only making money from old answers and a handful since Quora Plus launched.
Quora + pays poorly...
Should You Try Quora and Quora For Money?
My answer depends on your needs. I never got invited to Quora's question partner program due to my late start, but other writers have made hundreds. Due to Quora's new and competitive answering partner program, you may not make much money.
If you want a fun writing community, try Quora. Quora was fun when I only made money from my space. Quora +'s paywalls and new contributors eager to make money have made the platform less fun for me.
This article is a summary to save you time. You can read my full, more detailed article, here.

cdixon
4 months ago
2000s Toys, Secrets, and Cycles
During the dot-com bust, I started my internet career. People used the internet intermittently to check email, plan travel, and do research. The average internet user spent 30 minutes online a day, compared to 7 today. To use the internet, you had to "log on" (most people still used dial-up), unlike today's always-on, high-speed mobile internet. In 2001, Amazon's market cap was $2.2B, 1/500th of what it is today. A study asked Americans if they'd adopt broadband, and most said no. They didn't see a need to speed up email, the most popular internet use. The National Academy of Sciences ranked the internet 13th among the 100 greatest inventions, below radio and phones. The internet was a cool invention, but it had limited uses and wasn't a good place to build a business.
A small but growing movement of developers and founders believed the internet could be more than a read-only medium, allowing anyone to create and publish. This is web 2. The runner up name was read-write web. (These terms were used in prominent publications and conferences.)
Web 2 concepts included letting users publish whatever they want ("user generated content" was a buzzword), social graphs, APIs and mashups (what we call composability today), and tagging over hierarchical navigation. Technical innovations occurred. A seemingly simple but important one was dynamically updating web pages without reloading. This is now how people expect web apps to work. Mobile devices that could access the web were niche (I was an avid Sidekick user).
The contrast between what smart founders and engineers discussed over dinner and on weekends and what the mainstream tech world took seriously during the week was striking. Enterprise security appliances, essentially preloaded servers with security software, were a popular trend. Many of the same people would talk about "serious" products at work, then talk about consumer internet products and web 2. It was tech's biggest news. Web 2 products were seen as toys, not real businesses. They were hobbies, not work-related.
There's a strong correlation between rich product design spaces and what smart people find interesting, which took me some time to learn and led to blog posts like "The next big thing will start out looking like a toy" Web 2's novel product design possibilities sparked dinner and weekend conversations. Imagine combining these features. What if you used this pattern elsewhere? What new product ideas are next? This excited people. "Serious stuff" like security appliances seemed more limited.
The small and passionate web 2 community also stood out. I attended the first New York Tech meetup in 2004. Everyone fit in Meetup's small conference room. Late at night, people demoed their software and chatted. I have old friends. Sometimes I get asked how I first met old friends like Fred Wilson and Alexis Ohanian. These topics didn't interest many people, especially on the east coast. We were friends. Real community. Alex Rampell, who now works with me at a16z, is someone I met in 2003 when a friend said, "Hey, I met someone else interested in consumer internet." Rare. People were focused and enthusiastic. Revolution seemed imminent. We knew a secret nobody else did.
My web 2 startup was called SiteAdvisor. When my co-founders and I started developing the idea in 2003, web security was out of control. Phishing and spyware were common on Internet Explorer PCs. SiteAdvisor was designed to warn users about security threats like phishing and spyware, and then, using web 2 concepts like user-generated reviews, add more subjective judgments (similar to what TrustPilot seems to do today). This staged approach was common at the time; I called it "Come for the tool, stay for the network." We built APIs, encouraged mashups, and did SEO marketing.
Yahoo's 2005 acquisitions of Flickr and Delicious boosted web 2 in 2005. By today's standards, the amounts were small, around $30M each, but it was a signal. Web 2 was assumed to be a fun hobby, a way to build cool stuff, but not a business. Yahoo was a savvy company that said it would make web 2 a priority.
As I recall, that's when web 2 started becoming mainstream tech. Early web 2 founders transitioned successfully. Other entrepreneurs built on the early enthusiasts' work. Competition shifted from ideation to execution. You had to decide if you wanted to be an idealistic indie bar band or a pragmatic stadium band.
Web 2 was booming in 2007 Facebook passed 10M users, Twitter grew and got VC funding, and Google bought YouTube. The 2008 financial crisis tested entrepreneurs' resolve. Smart people predicted another great depression as tech funding dried up.
Many people struggled during the recession. 2008-2011 was a golden age for startups. By 2009, talented founders were flooding Apple's iPhone app store. Mobile apps were booming. Uber, Venmo, Snap, and Instagram were all founded between 2009 and 2011. Social media (which had replaced web 2), cloud computing (which enabled apps to scale server side), and smartphones converged. Even if social, cloud, and mobile improve linearly, the combination could improve exponentially.
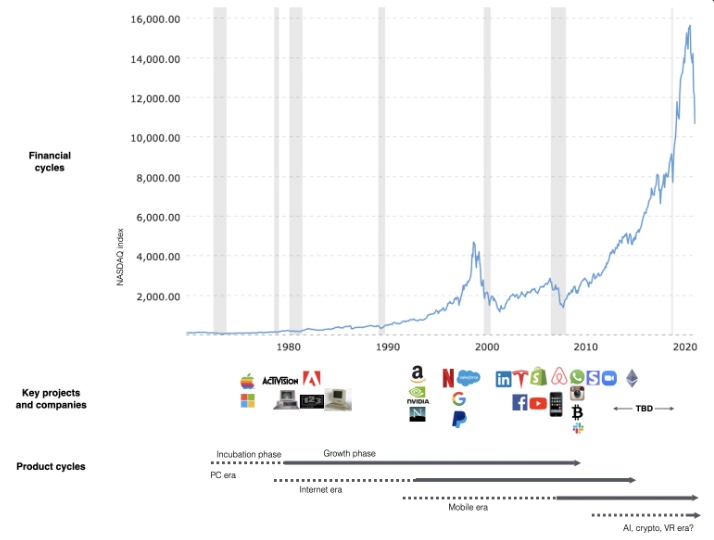
This chart shows how I view product and financial cycles. Product and financial cycles evolve separately. The Nasdaq index is a proxy for the financial sentiment. Financial sentiment wildly fluctuates.
Next row shows iconic startup or product years. Bottom-row product cycles dictate timing. Product cycles are more predictable than financial cycles because they follow internal logic. In the incubation phase, enthusiasts build products for other enthusiasts on nights and weekends. When the right mix of technology, talent, and community knowledge arrives, products go mainstream. (I show the biggest tech cycles in the chart, but smaller ones happen, like web 2 in the 2000s and fintech and SaaS in the 2010s.)
Tech has changed since the 2000s. Few tech giants dominate the internet, exerting economic and cultural influence. In the 2000s, web 2 was ignored or dismissed as trivial. Entrenched interests respond aggressively to new movements that could threaten them. Creative patterns from the 2000s continue today, driven by enthusiasts who see possibilities where others don't. Know where to look. Crypto and web 3 are where I'd start.
Today's negative financial sentiment reminds me of 2008. If we face a prolonged downturn, we can learn from 2008 by preserving capital and focusing on the long term. Keep an eye on the product cycle. Smart people are interested in things with product potential. This becomes true. Toys become necessities. Hobbies become mainstream. Optimists build the future, not cynics.
Full article is available here

SAHIL SAPRU
1 month ago
How I grew my business to a $5 million annual recurring revenue
Scaling your startup requires answering customer demands, not growth tricks.
I cofounded Freedo Rentals in 2019. I reached 50 lakh+ ARR in 6 months before quitting owing to the epidemic.
Freedo aimed to solve 2 customer pain points:
Users lacked a reliable last-mile transportation option.
The amount that Auto walas charge for unmetered services
Solution?
Effectively simple.
Build ports at high-demand spots (colleges, residential societies, metros). Electric ride-sharing can meet demand.
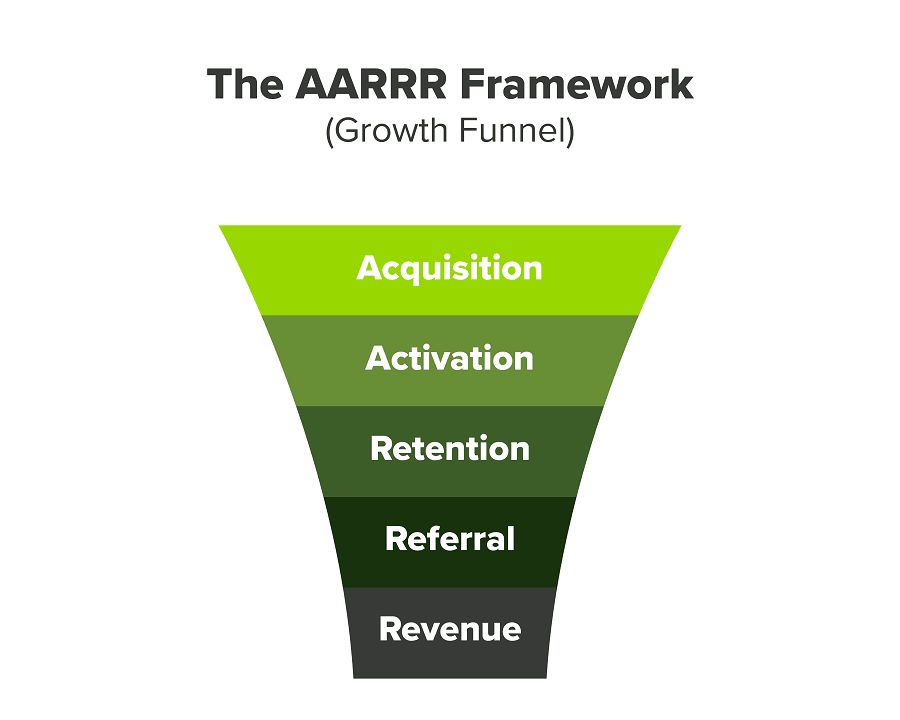
We had many problems scaling. I'll explain using the AARRR model.
Brand unfamiliarity or a novel product offering were the problems with awareness. Nobody knew what Freedo was or what it did.
Problem with awareness: Content and advertisements did a poor job of communicating the task at hand. The advertisements clashed with the white-collar part because they were too cheesy.
Retention Issue: We encountered issues, indicating that the product was insufficient. Problems with keyless entry, creating bills, stealing helmets, etc.
Retention/Revenue Issue: Costly compared to established rivals. Shared cars were 1/3 of our cost.
Referral Issue: Missing the opportunity to seize the AHA moment. After the ride, nobody remembered us.
Once you know where you're struggling with AARRR, iterative solutions are usually best.
Once you have nailed the AARRR model, most startups use paid channels to scale. This dependence, on paid channels, increases with scale unless you crack your organic/inbound game.
Over-index growth loops. Growth loops increase inflow and customers as you scale.
When considering growth, ask yourself:
Who is the solution's ICP (Ideal Customer Profile)? (To whom are you selling)
What are the most important messages I should convey to customers? (This is an A/B test.)
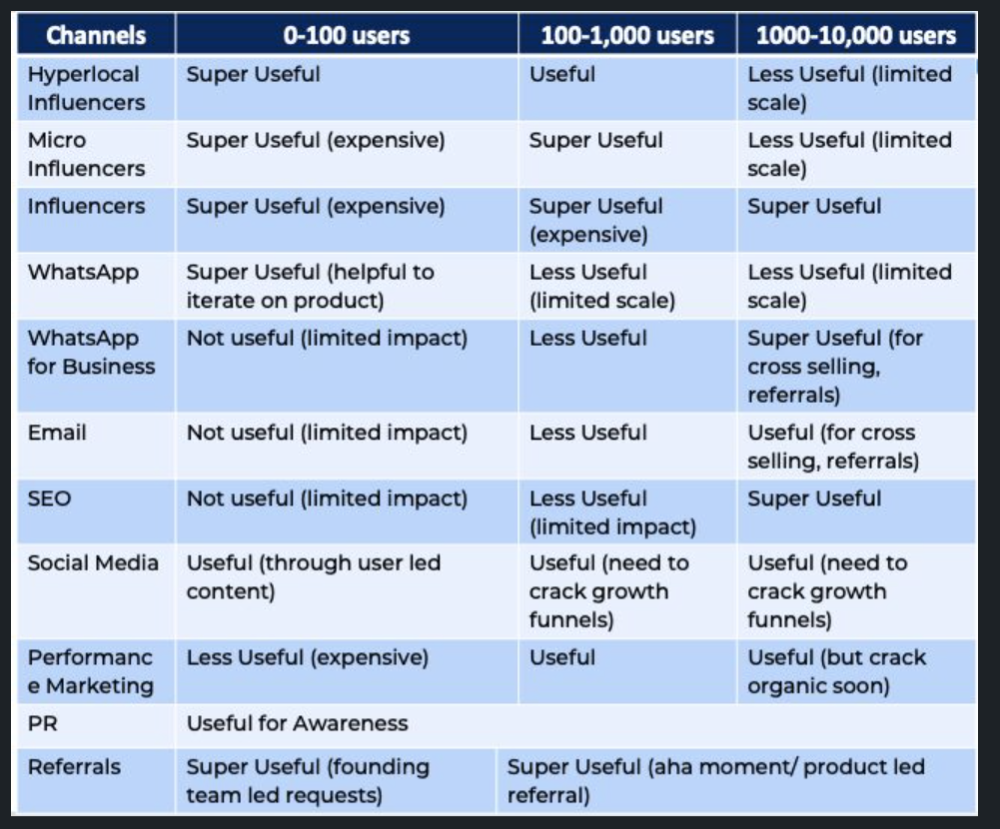
Which marketing channels ought I prioritize? (Conduct analysis based on the startup's maturity/stage.)
Choose the important metrics to monitor for your AARRR funnel (not all metrics are equal)
Identify the Flywheel effect's growth loops (inertia matters)
My biggest mistakes:
not paying attention to consumer comments or satisfaction. It is the main cause of problems with referrals, retention, and acquisition for startups. Beyond your NPS, you should consider second-order consequences.
The tasks at hand should be quite clear.
Here's my scaling equation:
Growth = A x B x C
A = Funnel top (Traffic)
B = Product Valuation (Solving a real pain point)
C = Aha! (Emotional response)
Freedo's A, B, and C created a unique offering.
Freedo’s ABC:
A — Working or Studying population in NCR
B — Electric Vehicles provide last-mile mobility as a clean and affordable solution
C — One click booking with a no-noise scooter
Final outcome:
FWe scaled Freedo to Rs. 50 lakh MRR and were growing 60% month on month till the pandemic ceased our growth story.
How we did it?
We tried ambassadors and coupons. WhatsApp was our most successful A/B test.
We grew widespread adoption through college and society WhatsApp groups. We requested users for referrals in community groups.
What worked for us won't work for others. This scale underwent many revisions.
Every firm is different, thus you must know your customers. Needs to determine which channel to prioritize and when.
Users desired a safe, time-bound means to get there.
This (not mine) growth framework helped me a lot. You should follow suit.
You might also like

Trent Lapinski
9 months ago
What The Hell Is A Crypto Punk?
We are Crypto Punks, and we are changing your world.
A “Crypto Punk” is a new generation of entrepreneurs who value individual liberty and collective value creation and co-creation through decentralization. While many Crypto Punks were born and raised in a digital world, some of the early pioneers in the crypto space are from the Oregon Trail generation. They were born to an analog world, but grew up simultaneously alongside the birth of home computing, the Internet, and mobile computing.
A Crypto Punk’s world view is not the same as previous generations. By the time most Crypto Punks were born everything from fiat currency, the stock market, pharmaceuticals, the Internet, to advanced operating systems and microprocessing were already present or emerging. Crypto Punks were born into pre-existing conditions and systems of control, not governed by logic or reason but by greed, corporatism, subversion, bureaucracy, censorship, and inefficiency.
All Systems Are Human Made
Crypto Punks understand that all systems were created by people and that previous generations did not have access to information technologies that we have today. This is why Crypto Punks have different values than their parents, and value liberty, decentralization, equality, social justice, and freedom over wealth, money, and power. They understand that the only path forward is to work together to build new and better systems that make the old world order obsolete.
Unlike the original cypher punks and cyber punks, Crypto Punks are a new iteration or evolution of these previous cultures influenced by cryptography, blockchain technology, crypto economics, libertarianism, holographics, democratic socialism, and artificial intelligence. They are tasked with not only undoing the mistakes of previous generations, but also innovating and creating new ways of solving complex problems with advanced technology and solutions.
Where Crypto Punks truly differ is in their understanding that computer systems can exist for more than just engagement and entertainment, but actually improve the human condition by automating bureaucracy and inefficiency by creating more efficient economic incentives and systems.
Crypto Punks Value Transparency and Do Not Trust Flawed, Unequal, and Corrupt Systems
Crypto Punks have a strong distrust for inherently flawed and corrupt systems. This why Crypto Punks value transparency, free speech, privacy, and decentralization. As well as arguably computer systems over human powered systems.
Crypto Punks are the children of the Great Recession, and will never forget the economic corruption that still enslaves younger generations.
Crypto Punks were born to think different, and raised by computers to view reality through an LED looking glass. They will not surrender to the flawed systems of economic wage slavery, inequality, censorship, and subjection. They will literally engineer their own unstoppable financial systems and trade in cryptography over fiat currency merely to prove that belief systems are more powerful than corruption.
Crypto Punks are here to help achieve freedom from world governments, corporations and bankers who monetizine our data to control our lives.
Crypto Punks Decentralize
Despite all the evils of the world today, Crypto Punks know they have the power to create change. This is why Crypto Punks are optimistic about the future despite all the indicators that humanity is destined for failure.
Crypto Punks believe in systems that prioritize people and the planet above profit. Even so, Crypto Punks still believe in capitalistic systems, but only capitalistic systems that incentivize good behaviors that do not violate the common good for the sake of profit.
Cyber Punks Are Co-Creators
We are Crypto Punks, and we will build a better world for all of us. For the true price of creation is not in US dollars, but through working together as equals to replace the unequal and corrupt greedy systems of previous generations.
Where they have failed, Crypto Punks will succeed. Not because we want to, but because we have to. The world we were born into is so corrupt and its systems so flawed and unequal we were never given a choice.
We have to be the change we seek.
We are Crypto Punks.
Either help us, or get out of our way.
Are you a Crypto Punk?

Emma Jade
3 months ago
6 hacks to create content faster
Content gurus' top time-saving hacks.

I'm a content strategist, writer, and graphic designer. Time is more valuable than money.
Money is always available. Even if you're poor. Ways exist.
Time is passing, and one day we'll run out.
Sorry to be morbid.
In today's digital age, you need to optimize how you create content for your organization. Here are six content creation hacks.
1. Use templates
Use templates to streamline your work whether generating video, images, or documents.
Setup can take hours. Using a free resource like Canva, you can create templates for any type of material.
This will save you hours each month.
2. Make a content calendar
You post without a plan? A content calendar solves 50% of these problems.
You can prepare, organize, and plan your material ahead of time so you're not scrambling when you remember, "Shit, it's Mother's Day!"
3. Content Batching
Batching content means creating a lot in one session. This is helpful for video content that requires a lot of setup time.
Batching monthly content saves hours. Time is a valuable resource.
When working on one type of task, it's easy to get into a flow state. This saves time.
4. Write Caption
On social media, we generally choose the image first and then the caption. Writing captions first sometimes work better, though.
Writing the captions first can allow you more creative flexibility and be easier if you're not excellent with language.
Say you want to tell your followers something interesting.
Writing a caption first is easier than choosing an image and then writing a caption to match.
Not everything works. You may have already-created content that needs captioning. When you don't know what to share, think of a concept, write the description, and then produce a video or graphic.
Cats can be skinned in several ways..
5. Repurpose
Reuse content when possible. You don't always require new stuff. In fact, you’re pretty stupid if you do #SorryNotSorry.
Repurpose old content. All those blog entries, videos, and unfinished content on your desk or hard drive.
This blog post can be turned into a social media infographic. Canva's motion graphic function can animate it. I can record a YouTube video regarding this issue for a podcast. I can make a post on each point in this blog post and turn it into an eBook or paid course.
And it doesn’t stop there.
My point is, to think outside the box and really dig deep into ways you can leverage the content you’ve already created.
6. Schedule Them
If you're still manually posting content, get help. When you batch your content, schedule it ahead of time.
Some scheduling apps are free or cheap. No excuses.
Don't publish and ghost.
Scheduling saves time by preventing you from doing it manually. But if you never engage with your audience, the algorithm won't reward your material.
Be online and engage your audience.
Content Machine
Use these six content creation hacks. They help you succeed and save time.

Nicolas Tresegnie
24 days ago
Launching 10 SaaS applications in 100 days

Apocodes helps entrepreneurs create SaaS products without writing code. This post introduces micro-SaaS and outlines its basic strategy.
Strategy
Vision and strategy differ when starting a startup.
The company's long-term future state is outlined in the vision. It establishes the overarching objectives the organization aims to achieve while also justifying its existence. The company's future is outlined in the vision.
The strategy consists of a collection of short- to mid-term objectives, the accomplishment of which will move the business closer to its vision. The company gets there through its strategy.
The vision should be stable, but the strategy must be adjusted based on customer input, market conditions, or previous experiments.
Begin modestly and aim high.
Be truthful. It's impossible to automate SaaS product creation from scratch. It's like climbing Everest without running a 5K. Physical rules don't prohibit it, but it would be suicide.
Apocodes 5K equivalent? Two options:
(A) Create a feature that includes every setting option conceivable. then query potential clients “Would you choose us to build your SaaS solution if we offered 99 additional features of the same caliber?” After that, decide which major feature to implement next.
(B) Build a few straightforward features with just one or two configuration options. Then query potential clients “Will this suffice to make your product?” What's missing if not? Finally, tweak the final result a bit before starting over.
(A) is an all-or-nothing approach. It's like training your left arm to climb Mount Everest. My right foot is next.
(B) is a better method because it's iterative and provides value to customers throughout.
Focus on a small market sector, meet its needs, and expand gradually. Micro-SaaS is Apocode's first market.
What is micro-SaaS.
Micro-SaaS enterprises have these characteristics:
A limited range: They address a specific problem with a small number of features.
A small group of one to five individuals.
Low external funding: The majority of micro-SaaS companies have Total Addressable Markets (TAM) under $100 million. Investors find them unattractive as a result. As a result, the majority of micro-SaaS companies are self-funded or bootstrapped.
Low competition: Because they solve problems that larger firms would rather not spend time on, micro-SaaS enterprises have little rivalry.
Low upkeep: Because of their simplicity, they require little care.
Huge profitability: Because providing more clients incurs such a small incremental cost, high profit margins are possible.
Micro-SaaS enterprises created with no-code are Apocode's ideal first market niche.
We'll create our own micro-SaaS solutions to better understand their needs. Although not required, we believe this will improve community discussions.
The challenge
In 100 days (September 12–December 20, 2022), we plan to build 10 micro-SaaS enterprises using Apocode.
They will be:
Self-serve: Customers will be able to use the entire product experience without our manual assistance.
Real: They'll deal with actual issues. They won't be isolated proofs of concept because we'll keep up with them after the challenge.
Both free and paid options: including a free plan and a free trial period. Although financial success would be a good result, the challenge's stated objective is not financial success.
This will let us design Apocodes features, showcase them, and talk to customers.
(Edit: The first micro-SaaS was launched!)
Follow along
If you want to follow the story of Apocode or our progress in this challenge, you can subscribe here.
If you are interested in using Apocode, sign up here.
If you want to provide feedback, discuss the idea further or get involved, email me at nicolas.tresegnie@gmail.com