


More on Entrepreneurship/Creators
Maddie Wang
3 years ago
Easiest and fastest way to test your startup idea!
Here's the fastest way to validate company concepts.
I squandered a year after dropping out of Stanford designing a product nobody wanted.
But today, I’m at 100k!
Differences:
I was designing a consumer product when I dropped out.
I coded MVP, got 1k users, and got YC interview.
Nice, huh?
WRONG!
Still coding and getting users 12 months later
WOULD PEOPLE PAY FOR IT? was the riskiest assumption I hadn't tested.
When asked why I didn't verify payment, I said,
Not-ready products. Now, nobody cares. The website needs work. Include this. Increase usage…
I feared people would say no.
After 1 year of pushing it off, my team told me they were really worried about the Business Model. Then I asked my audience if they'd buy my product.
So?
No, overwhelmingly.
I felt like I wasted a year building a product no one would buy.
Founders Cafe was the opposite.
Before building anything, I requested payment.
40 founders were interviewed.
Then we emailed Stanford, YC, and other top founders, asking them to join our community.
BOOM! 10/12 paid!
Without building anything, in 1 day I validated my startup's riskiest assumption. NOT 1 year.
Asking people to pay is one of the scariest things.
I understand.
I asked Stanford queer women to pay before joining my gay sorority.
I was afraid I'd turn them off or no one would pay.
Gay women, like those founders, were in such excruciating pain that they were willing to pay me upfront to help.
You can ask for payment (before you build) to see if people have the burning pain. Then they'll pay!
Examples from Founders Cafe members:
😮 Using a fake landing page, a college dropout tested a product. Paying! He built it and made $3m!
😮 YC solo founder faked a Powerpoint demo. 5 Enterprise paid LOIs. $1.5m raised, built, and in YC!
😮 A Harvard founder can convert Figma to React. 1 day, 10 customers. Built a tool to automate Figma -> React after manually fulfilling requests. 1m+
Bad example:
😭 Stanford Dropout Spends 1 Year Building Product Without Payment Validation
Some people build for a year and then get paying customers.
What I'm sharing is my experience and what Founders Cafe members have told me about validating startup ideas.
Don't waste a year like I did.
After my first startup failed, I planned to re-enroll at Stanford/work at Facebook.
After people paid, I quit for good.
I've hit $100k!
Hope this inspires you to request upfront payment! It'll change your life

MAJESTY AliNICOLE WOW!
3 years ago
YouTube's faceless videos are growing in popularity, but this is nothing new.
I've always bucked social media norms. YouTube doesn't compare. Traditional video made me zig when everyone zagged. Audio, picture personality animation, thought movies, and slide show videos are most popular and profitable.

YouTube's business is shifting. While most video experts swear by the idea that YouTube success is all about making personal and professional Face-Share-Videos, those who use YouTube for business know things are different.
In this article, I will share concepts from my mini master class Figures to Followers: Prioritizing Purposeful Profits Over Popularity on YouTube to Create the Win-Win for You, Your Audience & More and my forthcoming publication The WOWTUBE-PRENEUR FACTOR EVOLUTION: The Basics of Powerfully & Profitably Positioning Yourself as a Video Communications Authority to Broadcast Your WOW Effect as a Video Entrepreneur.
I've researched the psychology, anthropology, and anatomy of significant social media platforms as an entrepreneur and social media marketing expert. While building my YouTube empire, I've paid particular attention to what works for short, mid, and long-term success, whether it's a niche-focused, lifestyle, or multi-interest channel.
Most new, semi-new, and seasoned YouTubers feel vlog-style or live-on-camera videos are popular. Faceless, animated, music-text-based, and slideshow videos do well for businesses.
Buyer-consumer vs. content-consumer thinking is totally different when absorbing content. Profitability and popularity are closely related, however most people become popular with traditional means but not profitable.
In my experience, Faceless videos are more profitable, although it depends on the channel's style. Several professionals are now teaching in their courses that non-traditional films are making the difference in their business success and popularity.
Face-Share-Personal-Touch videos make audiences feel like they know the personality, but they're not profitable.
Most spend hours creating articles, videos, and thumbnails to seem good. That's how most YouTubers gained their success in the past, but not anymore.
Looking the part and performing a typical role in videos doesn't convert well, especially for newbie channels.
Working with video marketers and YouTubers for years, I've noticed that most struggle to be consistent with content publishing since they exclusively use formats that need extensive development. Camera and green screen set ups, shooting/filming, and editing for post productions require their time, making it less appealing to post consistently, especially if they're doing all the work themselves.
Because they won't make simple format videos or audio videos with an overlay image, they overcomplicate the procedure (even with YouTube Shorts), and they leave their channels for weeks or months. Again, they believe YouTube only allows specific types of videos. Even though this procedure isn't working, they plan to keep at it.

A successful YouTube channel needs multiple video formats to suit viewer needs, I teach. Face-Share-Personal Touch and Faceless videos are both useful.
How people engage with YouTube content has changed over the years, and the average customer is no longer interested in an all-video channel.
Face-Share-Personal-Touch videos are great
Google Live
Online training
Giving listeners a different way to access your podcast that is being broadcast on sites like Anchor, BlogTalkRadio, Spreaker, Google, Apple Store, and others Many people enjoy using a video camera to record themselves while performing the internet radio, Facebook, or Instagram Live versions of their podcasts.
Video Blog Updates
even more
Faceless videos are popular for business and benefit both entrepreneurs and audiences.
For the business owner/entrepreneur…
Less production time results in time dollar savings.
enables the business owner to demonstrate the diversity of content development
For the Audience…
The channel offers a variety of appealing content options.
The same format is not monotonous or overly repetitive for the viewers.
Below are a couple videos from YouTube guru Make Money Matt's channel, which has over 347K subscribers.
Enjoy
24 Best Niches to Make Money on YouTube Without Showing Your Face
Make Money on YouTube Without Making Videos (Free Course)
In conclusion, you have everything it takes to build your own YouTube brand and empire. Learn the rules, then adapt them to succeed.
Please reread this and the other suggested articles for optimal benefit.
I hope this helped. How has this article helped you? Follow me for more articles like this and more multi-mission expressions.

Caleb Naysmith
3 years ago
Ads Coming to Medium?
Could this happen?
Medium isn't like other social media giants. It wasn't a dot-com startup that became a multi-trillion-dollar social media firm. It launched in 2012 but didn't gain popularity until later. Now, it's one of the largest sites by web traffic, but it's still little compared to most. Most of Medium's traffic is external, but they don't run advertisements, so it's all about memberships.
Medium isn't profitable, but they don't disclose how terrible the problem is. Most of the $163 million they raised has been spent or used for acquisitions. If the money turns off, Medium can't stop paying its writers since the site dies. Writers must be paid, but they can't substantially slash payment without hurting the platform. The existing model needs scale to be viable and has a low ceiling. Facebook and other free social media platforms are struggling to retain users. Here, you must pay to appreciate it, and it's bad for writers AND readers. If I had the same Medium stats on YouTube, I'd make thousands of dollars a month.
Then what? Medium has tried to monetize by offering writers a cut of new members, but that's unsustainable. People-based growth is limited. Imagine recruiting non-Facebook users and getting them to pay to join. Some may, but I'd rather write.
Alternatives:
Donation buttons
Tiered subscriptions ($5, $10, $25, etc.)
Expanding content
and these may be short-term fixes, but they're not as profitable as allowing ads. Advertisements can pay several dollars per click and cents every view. If you get 40,000 views a month like me, that's several thousand instead of a few hundred. Also, Medium would have enough money to split ad revenue with writers, who would make more. I'm among the top 6% of Medium writers. Only 6% of Medium writers make more than $100, and I made $500 with 35,000 views last month. Compared to YouTube, the top 1% of Medium authors make a lot. Mr. Beast and PewDiePie make MILLIONS a month, yet top Medium writers make tens of thousands. Sure, paying 3 or 4 people a few grand, or perhaps tens of thousands, will keep them around. What if great authors leveraged their following to go huge on YouTube and abandoned Medium? If people use Medium to get successful on other platforms, Medium will be continuously cycling through authors and paying them to stay.
Ads might make writing on Medium more profitable than making videos on YouTube because they could preserve the present freemium model and pay users based on internal views. The $5 might be ad-free.
Consider: Would you accept Medium ads? A $5 ad-free version + pay-as-you-go, etc. What are your thoughts on this?
Original post available here
You might also like

Marcus Lu
3 years ago
The Brand Structure of U.S. Electric Vehicle Production
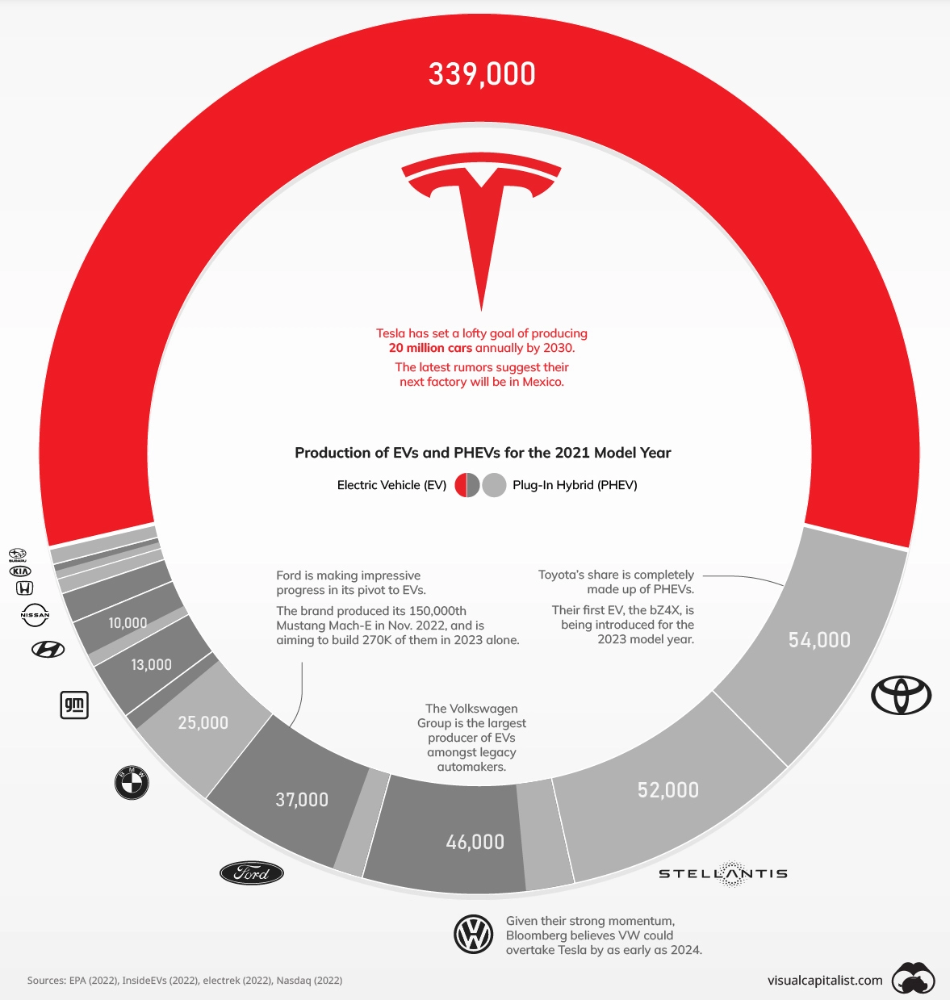
Will Tesla be able to maintain its lead in the EV market for very long?
This is one of the most pressing issues in the American auto sector today. One positive aspect of Tesla is the company's devoted customer base and recognizable name recognition (similar to Apple). It also invests more in research and development per vehicle than its rivals and has a head start in EV production.
Conversely, established automakers like Volkswagen are actively plotting their strategy to surpass Tesla. As the current market leaders, they have decades of experience in the auto industry and are spending billions to catch up.
We've visualized data from the EPA's 2022 Automotive Trends Report to bring you up to speed on this developing story.
Info for the Model Year of 2021
The full production data used in this infographic is for the 2021 model year, but it comes from a report for 2022.
Combined EV and PHEV output is shown in the table below (plug-in hybrid electric vehicle).
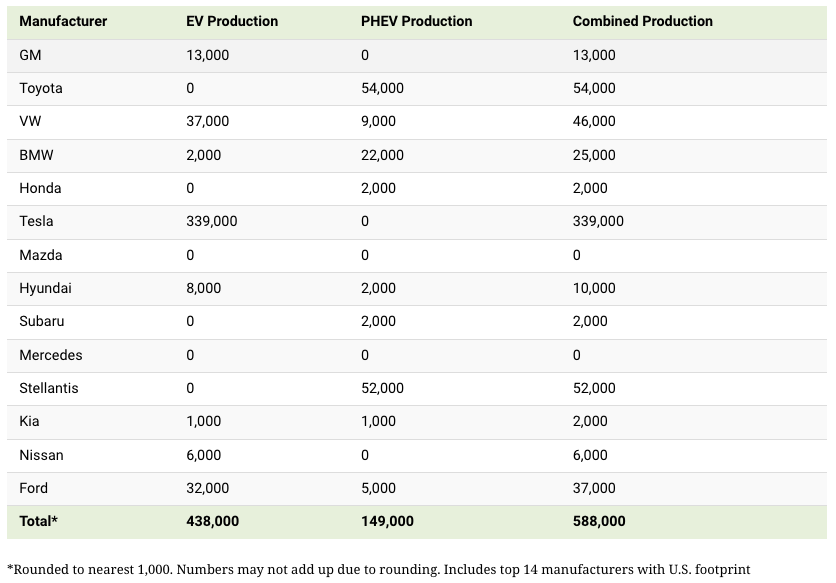
It is important to note that Toyota and Stellantis, the two largest legacy automakers in this dataset, only produced PHEVs. Toyota's first electric vehicle, the bZ4X, won't hit the market until 2023.
Stellantis seems to be falling even further behind, despite having enormous unrealized potential in its Jeep and Ram brands. Stellantis CEO Carlos Tavares said in a recent interview that the firm has budgeted $36 billion for electrification and software.
Legacy Brands with the Most Momentum
In the race to develop electric vehicles, some long-standing manufacturers have gotten the jump on their rivals.
Volkswagen, one of these storied manufacturers, has made a significant investment in electric vehicles (EVs) in the wake of the Dieselgate scandal. The company plans to roll out multiple EV models, including the ID.3 hatchback, ID.4 SUV, and ID. Buzz, with the goal of producing 22 million EVs by 2028. (an electric revival of the classic Microbus).
Even Ford is keeping up, having just announced an EV investment of $22 billion between 2021 and 2025. In November of 2022, the company manufactured their 150,000th Mustang Mach-E, and by the end of 2023, they hoped to have 270,000 of them in circulation.
Additionally, over 200,000 F-150 Lightnings have been reserved since Ford announced the truck. The Lightning is scheduled to have a production run of 15,000 in 2022, 55,000 in 2023, and 80,000 in 2024. Ford's main competitor in the electric pickup truck segment, Rivian, is on track to sell 25,000 vehicles by 2022.

Sam Bourgi
3 years ago
NFT was used to serve a restraining order on an anonymous hacker.
The international law firm Holland & Knight used an NFT built and airdropped by its asset recovery team to serve a defendant in a hacking case.
The law firms Holland & Knight and Bluestone used a nonfungible token to serve a defendant in a hacking case with a temporary restraining order, marking the first documented legal process assisted by an NFT.
The so-called "service token" or "service NFT" was served to an unknown defendant in a hacking case involving LCX, a cryptocurrency exchange based in Liechtenstein that was hacked for over $8 million in January. The attack compromised the platform's hot wallets, resulting in the loss of Ether (ETH), USD Coin (USDC), and other cryptocurrencies, according to Cointelegraph at the time.
On June 7, LCX claimed that around 60% of the stolen cash had been frozen, with investigations ongoing in Liechtenstein, Ireland, Spain, and the United States. Based on a court judgment from the New York Supreme Court, Centre Consortium, a company created by USDC issuer Circle and crypto exchange Coinbase, has frozen around $1.3 million in USDC.
The monies were laundered through Tornado Cash, according to LCX, but were later tracked using "algorithmic forensic analysis." The organization was also able to identify wallets linked to the hacker as a result of the investigation.
In light of these findings, the law firms representing LCX, Holland & Knight and Bluestone, served the unnamed defendant with a temporary restraining order issued on-chain using an NFT. According to LCX, this system "was allowed by the New York Supreme Court and is an example of how innovation can bring legitimacy and transparency to a market that some say is ungovernable."

umair haque
2 years ago
The reasons why our civilization is deteriorating
The Industrial Revolution's Curse: Why One Age's Power Prevents the Next Ones
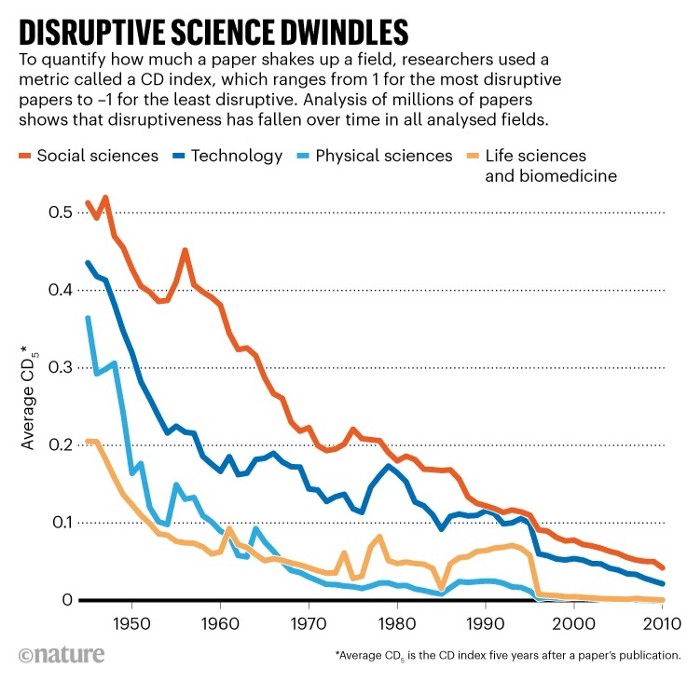
A surprising fact. Recently, Big Oil's 1970s climate change projections were disturbingly accurate. Of course, we now know that it worked tirelessly to deny climate change, polluting our societies to this day. That's a small example of the Industrial Revolution's curse.
Let me rephrase this nuanced and possibly weird thought. The chart above? Disruptive science is declining. The kind that produces major discoveries, new paradigms, and shattering prejudices.
Not alone. Our civilisation reached a turning point suddenly. Progress stopped and reversed for the first time in centuries.
The Industrial Revolution's Big Bang started it all. At least some humans had riches for the first time, if not all, and with that wealth came many things. Longer, healthier lives since now health may be publicly and privately invested in. For the first time in history, wealthy civilizations could invest their gains in pure research, a good that would have sounded frivolous to cultures struggling to squeeze out the next crop, which required every shoulder to the till.
So. Don't confuse me with the Industrial Revolution's curse. Industry progressed. Contrary. I'm claiming that the Big Bang of Progress is slowing, plateauing, and ultimately reversing. All social indicators show that. From progress itself to disruptive, breakthrough research, everything is slowing down.
It's troubling. Because progress slows and plateaus, pre-modern social problems like fascism, extremism, and fundamentalism return. People crave nostalgic utopias when they lose faith in modernity. That strongman may shield me from this hazardous life. If I accept my place in a blood-and-soil hierarchy, I have a stable, secure position and someone to punch and detest. It's no coincidence that as our civilization hits a plateau of progress, there is a tsunami pulling the world backwards, with people viscerally, openly longing for everything from theocracy to fascism to fundamentalism, an authoritarian strongman to soothe their fears and tell them what to do, whether in Britain, heartland America, India, China, and beyond.
However, one aspect remains unknown. Technology. Let me clarify.
How do most people picture tech? Say that without thinking. Most people think of social media or AI. Well, small correlation engines called artificial neurons are a far cry from biological intelligence, which functions in far more obscure and intricate ways, down to the subatomic level. But let's try it.
Today, tech means AI. But. Do you foresee it?
Consider why civilisation is plateauing and regressing. Because we can no longer provide the most basic necessities at the same rate. On our track, clean air, water, food, energy, medicine, and healthcare will become inaccessible to huge numbers within a decade or three. Not enough. There isn't, therefore prices for food, medicine, and energy keep rising, with occasional relief.
Why our civilizations are encountering what economists like me term a budget constraint—a hard wall of what we can supply—should be evident. Global warming and extinction. Megafires, megadroughts, megafloods, and failed crops. On a civilizational scale, good luck supplying the fundamentals that way. Industrial food production cannot feed a planet warming past two degrees. Crop failures, droughts, floods. Another example: glaciers melt, rivers dry up, and the planet's fresh water supply contracts like a heart attack.
Now. Let's talk tech again. Mostly AI, maybe phone apps. The unsettling reality is that current technology cannot save humanity. Not much.
AI can do things that have become cliches to titillate the masses. It may talk to you and act like a person. It can generate art, which means reproduce it, but nonetheless, AI art! Despite doubts, it promises to self-drive cars. Unimportant.
We need different technology now. AI won't grow crops in ash-covered fields, cleanse water, halt glaciers from melting, or stop the clear-cutting of the planet's few remaining forests. It's not useless, but on a civilizational scale, it's much less beneficial than its proponents claim. By the time it matures, AI can help deliver therapy, keep old people company, and even drive cars more efficiently. None of it can save our culture.
Expand that scenario. AI's most likely use? Replacing call-center workers. Support. It may help doctors diagnose, surgeons orient, or engineers create more fuel-efficient motors. This is civilizationally marginal.
Non-disruptive. Do you see the connection with the paper that indicated disruptive science is declining? AI exemplifies that. It's called disruptive, yet it's a textbook incremental technology. Oh, cool, I can communicate with a bot instead of a poor human in an underdeveloped country and have the same or more trouble being understood. This bot is making more people unemployed. I can now view a million AI artworks.
AI illustrates our civilization's trap. Its innovative technologies will change our lives. But as you can see, its incremental, delivering small benefits at most, and certainly not enough to balance, let alone solve, the broader problem of steadily dropping living standards as our society meets a wall of being able to feed itself with fundamentals.
Contrast AI with disruptive innovations we need. What do we need to avoid a post-Roman Dark Age and preserve our civilization in the coming decades? We must be able to post-industrially produce all our basic needs. We need post-industrial solutions for clean water, electricity, cement, glass, steel, manufacture for garments and shoes, starting with the fossil fuel-intensive plastic, cotton, and nylon they're made of, and even food.
Consider. We have no post-industrial food system. What happens when crop failures—already dangerously accelerating—reach a critical point? Our civilization is vulnerable. Think of ancient civilizations that couldn't survive the drying up of their water sources, the failure of their primary fields, which they assumed the gods would preserve forever, or an earthquake or sickness that killed most of their animals. Bang. Lost. They failed. They splintered, fragmented, and abandoned vast capitols and cities, and suddenly, in history's sight, poof, they were gone.
We're getting close. Decline equals civilizational peril.
We believe dumb notions about AI becoming disruptive when it's incremental. Most of us don't realize our civilization's risk because we believe these falsehoods. Everyone should know that we cannot create any thing at civilizational scale without fossil fuels. Most of us don't know it, thus we don't realize that the breakthrough technologies and systems we need don't manipulate information anymore. Instead, biotechnologies, largely but not genes, generate food without fossil fuels.
We need another Industrial Revolution. AI, apps, bots, and whatnot won't matter unless you think you can eat and drink them while the world dies and fascists, lunatics, and zealots take democracy's strongholds. That's dramatic, but only because it's already happening. Maybe AI can entertain you in that bunker while society collapses with smart jokes or a million Mondrian-like artworks. If civilization is to survive, it cannot create the new Industrial Revolution.
The revolution has begun, but only in small ways. Post-industrial fundamental systems leaders are developing worldwide. The Netherlands is leading post-industrial agriculture. That's amazing because it's a tiny country performing well. Correct? Discover how large-scale agriculture can function, not just you and me, aged hippies, cultivating lettuce in our backyards.
Iceland is leading bioplastics, which, if done well, will be a major advance. Of sure, microplastics are drowning the oceans. What should we do since we can't live without it? We need algae-based bioplastics for green plastic.
That's still young. Any of the above may not function on a civilizational scale. Bioplastics use algae, which can cause problems if overused. None of the aforementioned indicate the next Industrial Revolution is here. Contrary. Slowly.
We have three decades until everything fails. Before life ends. Curtain down. No more fields, rivers, or weather. Freshwater and life stocks have plummeted. Again, we've peaked and declined in our ability to live at today's relatively rich standards. Game over—no more. On a dying planet, producing the fundamentals for a civilisation that left it too late to construct post-industrial systems becomes next to impossible, with output dropping faster and quicker each year, quarter, and day.
Too slow. That's because it's not really happening. Most people think AI when I say tech. I get a politicized response if I say Green New Deal or Clean Industrial Revolution. Half the individuals I talk to have been politicized into believing that climate change isn't real and that any breakthrough technical progress isn't required, desirable, possible, or genuine. They'll suffer.
The Industrial Revolution curse. Every revolution creates new authorities, which ossify and refuse to relinquish their privileges. For fifty years, Big Oil has denied climate change, even though their scientists predicted it. We also have a software industry and its venture capital power centers that are happy for the average person to think tech means chatbots, not being able to produce basics for a civilization without destroying the planet, and billionaires who buy comms platforms for the same eye-watering amount of money it would take to save life on Earth.
The entire world's vested interests are against the next industrial revolution, which is understandable since they were established from fossil money. From finance to energy to corporate profits to entertainment, power in our world is the result of the last industrial revolution, which means it has no motivation or purpose to give up fossil money, as we are witnessing more brutally out in the open.
Thus, the Industrial Revolution's curse—fossil power—rules our globe. Big Agriculture, Big Pharma, Wall St., Silicon Valley, and many others—including politics, which they buy and sell—are basically fossil power, and they have no interest in generating or letting the next industrial revolution happen. That's why tiny enterprises like those creating bioplastics in Iceland or nations savvy enough to shun fossil power, like the Netherlands, which has a precarious relationship with nature, do it. However, fossil power dominates politics, economics, food, clothes, energy, and medicine, and it has no motivation to change.
Allow disruptive innovations again. As they occur, its position becomes increasingly vulnerable. If you were fossil power, would you allow another industrial revolution to destroy its privilege and wealth?
You might, since power and money haven't corrupted you. However, fossil power prevents us from building, creating, and growing what we need to survive as a society. I mean the entire economic, financial, and political power structure from the last industrial revolution, not simply Big Oil. My friends, fossil power's chokehold over our society is likely to continue suffocating the advances that could have spared our civilization from a decline that's now here and spiraling closer to oblivion.