


More on Entrepreneurship/Creators
Evgenii Nelepko
3 years ago
My 3 biggest errors as a co-founder and CEO
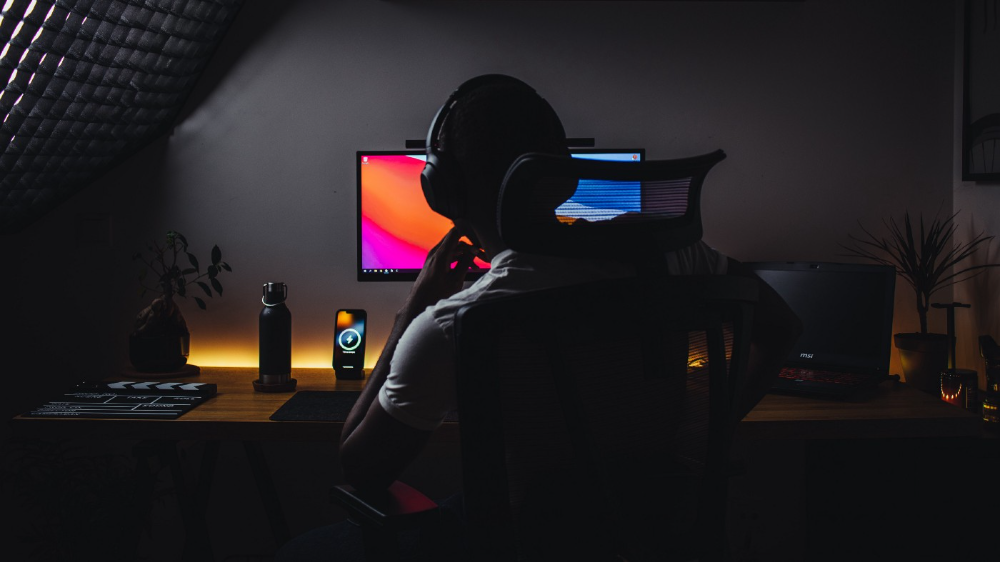
Reflections on the closed company Hola! Dating app
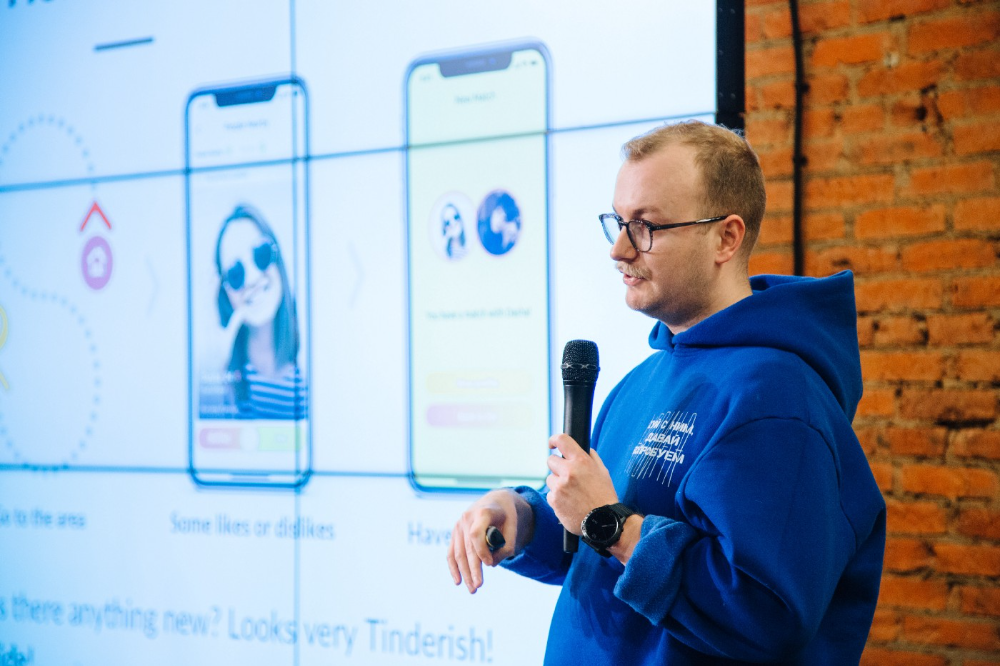
I'll discuss my fuckups as an entrepreneur and CEO. All of them refer to the dating app Hola!, which I co-founded and starred in.
Spring 2021 was when we started. Two techies and two non-techies created a dating app. Pokemon Go and Tinder were combined.
Online dating is a business, and it takes two weeks from a like to a date. We questioned online dating app users if they met anyone offline last year.
75% replied yes, 50% sometimes, 25% usually.
Offline dating is popular, yet people have concerns.
Men are reluctant to make mistakes in front of others.
Women are curious about the background of everyone who approaches them.
We designed unique mechanics that let people date after a match. No endless chitchat. Women would be safe while men felt like cowboys.
I wish to emphasize three faults that lead to founders' estrangement.
This detachment ultimately led to us shutting down the company.
The wrong technology stack
Situation
Instead of generating a faster MVP and designing an app in a universal stack for iOS and Android, I argued we should pilot the app separately for iOS and Android. Technical founders' expertise made this possible.
Self-reflection
Mistaken strategy. We lost time and resources developing two apps at once. We chose iOS since it's more profitable. Apple took us out after the release, citing Guideline 4.3 Spam. After 4 months, we had nothing. We had a long way to go to get the app on Android and the Store.
I suggested creating a uniform platform for the company's growth. This makes parallel product development easier. The strategist's lack of experience and knowledge made it a piece of crap.
What would I have changed if I could?
We should have designed an Android universal stack. I expected Apple to have issues with a dating app.
Our approach should have been to launch something and subsequently improve it, but prejudice won.
The lesson
Discuss the IT stack with your CTO. It saves time and money. Choose the easiest MVP method.

2. A tardy search for investments
Situation
Though the universe and other founders encouraged me to locate investors first, I started pitching when we almost had an app.
When angels arrived, it was time to close. The app was banned, war broke out, I left the country, and the other co-founders stayed. We had no savings.
Self-reflection
I loved interviewing users. I'm proud of having done 1,000 interviews. I wanted to understand people's pain points and improve the product.
Interview results no longer affected the product. I was terrified to start pitching. I filled out accelerator applications and redid my presentation. You must go through that so you won't be terrified later.
What would I have changed if I could?
Get an external or internal mentor to help me with my first pitch as soon as possible. I'd be supported if criticized. He'd cheer with me if there was enthusiasm.
In 99% of cases, I'm comfortable jumping into the unknown, but there are exceptions. The mentor's encouragement would have prompted me to act sooner.
The lesson
Begin fundraising immediately. Months may pass. Show investors your pre-MVP project. Draw inferences from feedback.
3. Role ambiguity
Situation
My technical co-founders were also part-time lead developers, which produced communication issues. As co-founders, we communicated well and recognized the problems. Stakes, vesting, target markets, and approach were agreed upon.
We were behind schedule. Technical debt and strategic gap grew.
Bi-daily and weekly reviews didn't help. Each time, there were explanations. Inside, I was freaking out.
Self-reflection
I am a fairly easy person to talk to. I always try to stick to agreements; otherwise, my head gets stuffed with unnecessary information, interpretations, and emotions.
Sit down -> talk -> decide -> do -> evaluate the results. Repeat it.
If I don't get detailed comments, I start ruining everyone's mood. If there's a systematic violation of agreements without a good justification, I won't join the project or I'll end the collaboration.
What would I have done otherwise?
This is where it’s scariest to draw conclusions. Probably the most logical thing would have been not to start the project as we started it. But that was already a completely different project. So I would not have done anything differently and would have failed again.
But I drew conclusions for the future.
The lesson
First-time founders should find an adviser or team coach for a strategic session. It helps split the roles and responsibilities.

Edward Williams
3 years ago
I currently manage 4 profitable online companies. I find all the generic advice and garbage courses very frustrating. The only advice you need is this.

This is for young entrepreneurs, especially in tech.
People give useless success advice on TikTok and Reddit. Early risers, bookworms, etc. Entrepreneurship courses. Work hard and hustle.
False. These aren't successful traits.
I mean, organization is good. As someone who founded several businesses and now works at a VC firm, I find these tips to be clichés.
Based on founding four successful businesses and working with other successful firms, here's my best actionable advice:
1. Choose a sector or a niche and become an expert in it.
This is more generic than my next tip, but it's a must-do that's often overlooked. Become an expert in the industry or niche you want to enter. Discover everything.
Buy (future) competitors' products. Understand consumers' pain points. Market-test. Target keyword combos. Learn technical details.
The most successful businesses I've worked with were all formed by 9-5 employees. They knew the industry's pain points. They started a business targeting these pain points.
2. Choose a niche or industry crossroads to target.
How do you choose an industry or niche? What if your industry is too competitive?
List your skills and hobbies. Randomness is fine. Find an intersection between two interests or skills.
Say you build websites well. You like cars.
Web design is a *very* competitive industry. Cars and web design?
Instead of web design, target car dealers and mechanics. Build a few fake demo auto mechanic websites, then cold call shops with poor websites. Verticalize.
I've noticed a pattern:
Person works in a particular industry for a corporation.
Person gains expertise in the relevant industry.
Person quits their job and launches a small business to address a problem that their former employer was unwilling to address.
I originally posted this on Reddit and it seemed to have taken off so I decided to share it with you all.
Focus on the product. When someone buys from you, you convince them the product's value exceeds the price. It's not fair and favors the buyer.
Creating a superior product or service will win. Narrowing this helps you outcompete others.
You may be their only (lucky) option.

Alex Mathers
3 years ago
400 articles later, nobody bothered to read them.

Writing for readers:
14 years of daily writing.
I post practically everything on social media. I authored hundreds of articles, thousands of tweets, and numerous volumes to almost no one.
Tens of thousands of readers regularly praise me.
I despised writing. I'm stuck now.
I've learned what readers like and what doesn't.
Here are some essential guidelines for writing with impact:
Readers won't understand your work if you can't.
Though obvious, this slipped me up. Share your truths.
Stories engage human brains.
Showing the journey of a person from worm to butterfly inspires the human spirit.
Overthinking hinders powerful writing.
The best ideas come from inner understanding in between thoughts.
Avoid writing to find it. Write.
Writing a masterpiece isn't motivating.
Write for five minutes to simplify. Step-by-step, entertaining, easy steps.
Good writing requires a willingness to make mistakes.
So write loads of garbage that you can edit into a good piece.
Courageous writing.
A courageous story will move readers. Personal experience is best.
Go where few dare.
Templates, outlines, and boundaries help.
Limitations enhance writing.
Excellent writing is straightforward and readable, removing all the unnecessary fat.
Use five words instead of nine.
Use ordinary words instead of uncommon ones.
Readers desire relatability.
Too much perfection will turn it off.
Write to solve an issue if you can't think of anything to write.
Instead, read to inspire. Best authors read.
Every tweet, thread, and novel must have a central idea.
What's its point?
This can make writing confusing.
️ Don't direct your reader.
Readers quit reading. Demonstrate, describe, and relate.
Even if no one responds, have fun. If you hate writing it, the reader will too.
You might also like

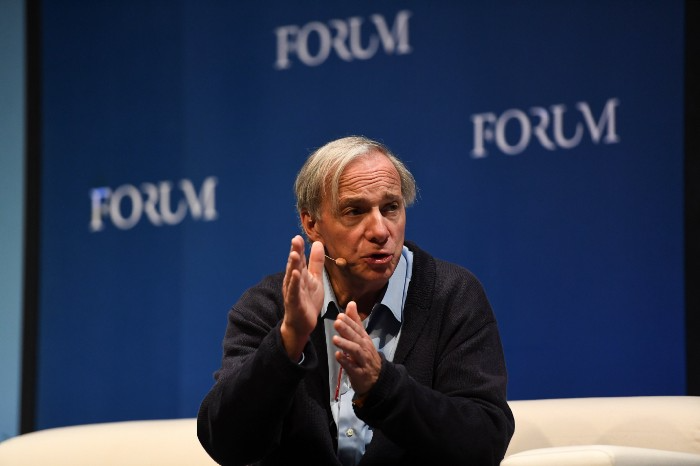
Scott Galloway
3 years ago
Text-ure
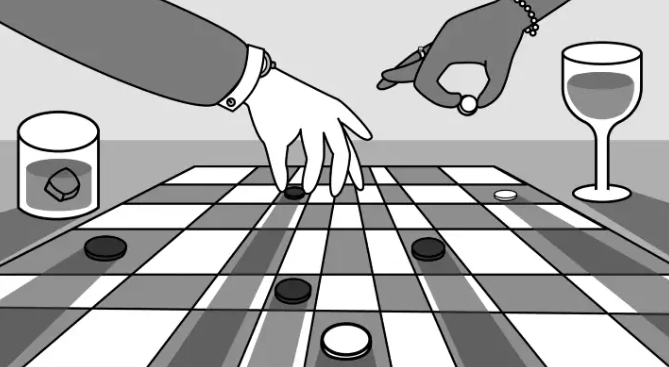
While we played checkers, we thought billionaires played 3D chess. They're playing the same game on a fancier board.
Every medium has nuances and norms. Texting is authentic and casual. A smaller circle has access, creating intimacy and immediacy. Most people read all their texts, but not all their email and mail. Many of us no longer listen to our voicemails, and calling your kids ages you.
Live interviews and testimony under oath inspire real moments, rare in a world where communications departments sanitize everything powerful people say. When (some of) Elon's text messages became public in Twitter v. Musk, we got a glimpse into tech power. It's bowels.
These texts illuminate the tech community's upper caste.
Checkers, Not Chess
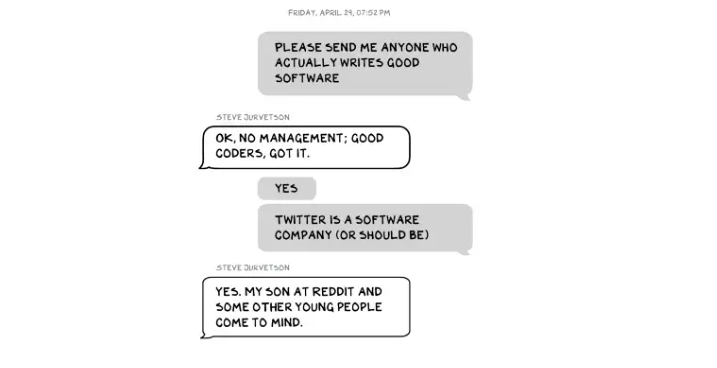
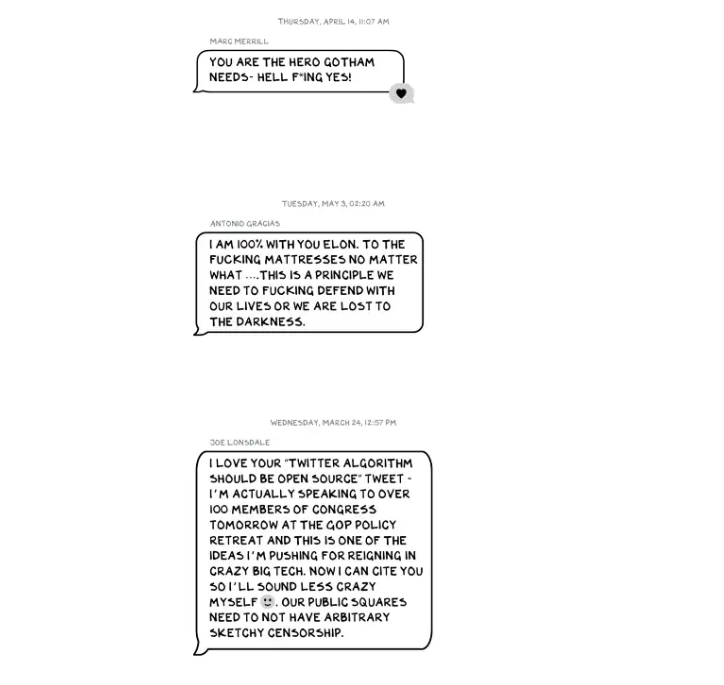
Elon texts with Larry Ellison, Joe Rogan, Sam Bankman-Fried, Satya Nadella, and Jack Dorsey. They reveal astounding logic, prose, and discourse. The world's richest man and his followers are unsophisticated, obtuse, and petty. Possibly. While we played checkers, we thought billionaires played 3D chess. They're playing the same game on a fancier board.
They fumble with their computers.

They lean on others to get jobs for their kids (no surprise).
No matter how rich, they always could use more (money).

Differences A social hierarchy exists. Among this circle, the currency of deference is... currency. Money increases sycophantry. Oculus and Elon's "friends'" texts induce nausea.
Autocorrect frustrates everyone.

Elon doesn't stand out to me in these texts; he comes off mostly OK in my view. It’s the people around him. It seems our idolatry of innovators has infected the uber-wealthy, giving them an uncontrollable urge to kill the cool kid for a seat at his cafeteria table. "I'd grenade for you." If someone says this and they're not fighting you, they're a fan, not a friend.
Many powerful people are undone by their fake friends. Facilitators, not well-wishers. When Elon-Twitter started, I wrote about power. Unchecked power is intoxicating. This is a scientific fact, not a thesis. Power causes us to downplay risk, magnify rewards, and act on instincts more quickly. You lose self-control and must rely on others.
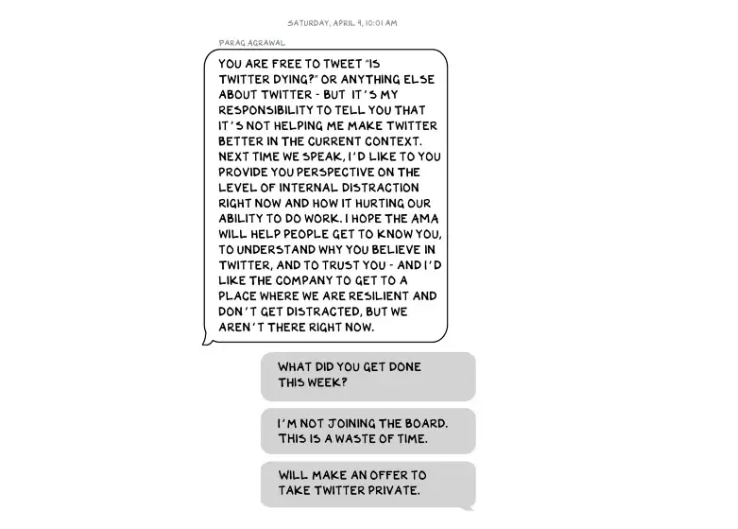
You'd hope the world's richest person has advisers who push back when necessary (i.e., not yes men). Elon's reckless, childish behavior and these texts show there is no truth-teller. I found just one pushback in the 151-page document. It came from Twitter CEO Parag Agrawal, who, in response to Elon’s unhelpful “Is Twitter dying?” tweet, let Elon know what he thought: It was unhelpful. Elon’s response? A childish, terse insult.
Scale
The texts are mostly unremarkable. There are some, however, that do remind us the (super-)rich are different. Specifically, the discussions of possible equity investments from crypto-billionaire Sam Bankman-Fried (“Does he have huge amounts of money?”) and this exchange with Larry Ellison:
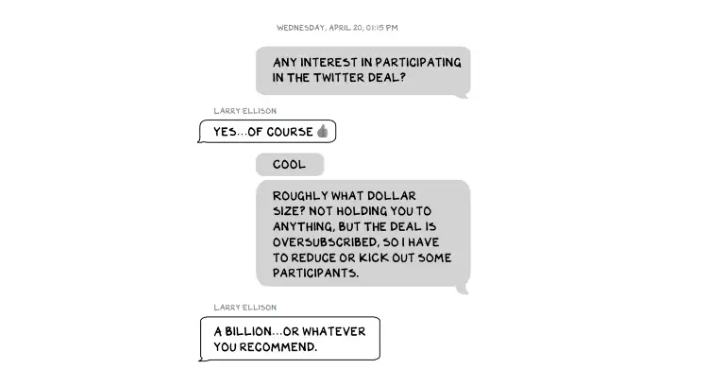
Ellison, who co-founded $175 billion Oracle, is wealthy. Less clear is whether he can text a billion dollars. Who hasn't been texted $1 billion? Ellison offered 8,000 times the median American's net worth, enough to buy 3,000 Ferraris or the Chicago Blackhawks. It's a bedrock principle of capitalism to have incredibly successful people who are exponentially wealthier than the rest of us. It creates an incentive structure that inspires productivity and prosperity. When people offer billions over text to help a billionaire's vanity project in a country where 1 in 5 children are food insecure, isn't America messed up?
Elon's Morgan Stanley banker, Michael Grimes, tells him that Web3 ventures investor Bankman-Fried can invest $5 billion in the deal: “could do $5bn if everything vision lock... Believes in your mission." The message bothers Elon. In Elon's world, $5 billion doesn't warrant a worded response. $5 billion is more than many small nations' GDP, twice the SEC budget, and five times the NRC budget.
If income inequality worries you after reading this, trust your gut.
Billionaires aren't like the rich.
As an entrepreneur, academic, and investor, I've met modest-income people, rich people, and billionaires. Rich people seem different to me. They're smarter and harder working than most Americans. Monty Burns from The Simpsons is a cartoon about rich people. Rich people have character and know how to make friends. Success requires supporters.
I've never noticed a talent or intelligence gap between wealthy and ultra-wealthy people. Conflating talent and luck infects the tech elite. Timing is more important than incremental intelligence when going from millions to hundreds of millions or billions. Proof? Elon's texting. Any man who electrifies the auto industry and lands two rockets on barges is a genius. His mega-billions come from a well-regulated capital market, enforceable contracts, thousands of workers, and billions of dollars in government subsidies, including a $465 million DOE loan that allowed Tesla to produce the Model S. So, is Mr. Musk a genius or an impressive man in a unique time and place?
The Point
Elon's texts taught us more? He can't "fix" Twitter. For two weeks in April, he was all in on blockchain Twitter, brainstorming Dogecoin payments for tweets with his brother — i.e., paid speech — while telling Twitter's board he was going to make a hostile tender offer. Kimbal approved. By May, he was over crypto and "laborious blockchain debates." (Mood.)
Elon asked the Twitter CEO for "an update from the Twitter engineering team" No record shows if he got the meeting. It doesn't "fix" Twitter either. And this is Elon's problem. He's a grown-up child with all the toys and no boundaries. His yes-men encourage his most facile thoughts, and shitposts and errant behavior diminish his genius and ours.
Post-Apocalyptic
The universe's titans have a sense of humor.
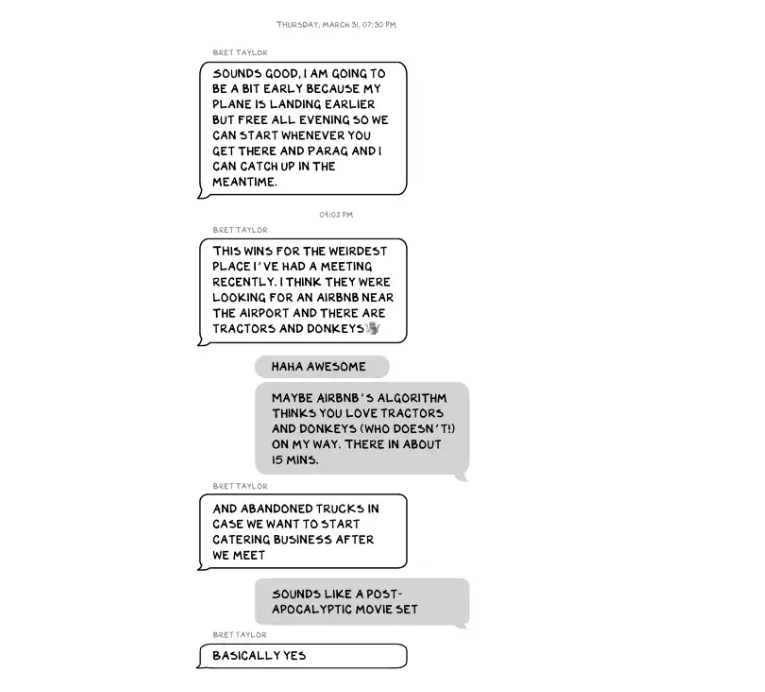
Every day, we must ask: Who keeps me real? Who will disagree with me? Who will save me from my psychosis, which has brought down so many successful people? Elon Musk doesn't need anyone to jump on a grenade for him; he needs to stop throwing them because one will explode in his hand.

James White
3 years ago
Ray Dalio suggests reading these three books in 2022.
An inspiring reading list
I'm no billionaire or hedge-fund manager. My bank account doesn't have millions. Ray Dalio's love of reading motivates me to think differently.
Here are some books recommended by Ray Dalio. Each influenced me. Hope they'll help you.
Sapiens by Yuval Noah Harari
Page Count: 512
Rating on Goodreads: 4.39
My favorite nonfiction book.
Sapiens explores human evolution. It explains how Homo Sapiens developed from hunter-gatherers to a dominant species. Amazing!
Sapiens will teach you about human history. Yuval Noah Harari has a follow-up book on human evolution.
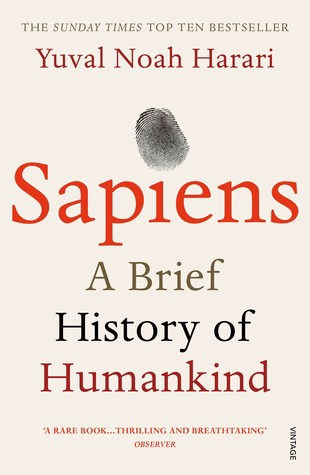
My favorite book quotes are:
The tendency for luxuries to turn into necessities and give rise to new obligations is one of history's few unbreakable laws.
Happiness is not dependent on material wealth, physical health, or even community. Instead, it depends on how closely subjective expectations and objective circumstances align.
The romantic comparison between today's industry, which obliterates the environment, and our forefathers, who coexisted well with nature, is unfounded. Homo sapiens held the record among all organisms for eradicating the most plant and animal species even before the Industrial Revolution. The unfortunate distinction of being the most lethal species in the history of life belongs to us.
The Power Of Habit by Charles Duhigg
Page Count: 375
Rating on Goodreads: 4.13
Great book: The Power Of Habit. It illustrates why habits are everything. The book explains how healthier habits can improve your life, career, and society.
The Power of Habit rocks. It's a great book on productivity. Its suggestions helped me build healthier behaviors (and drop bad ones).
Read ASAP!
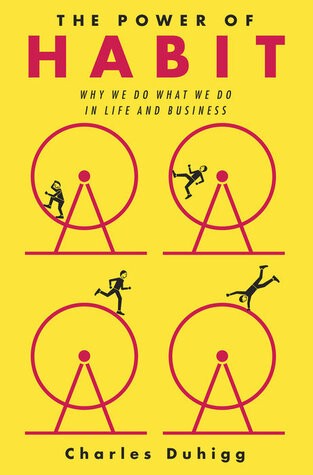
My favorite book quotes are:
Change may not occur quickly or without difficulty. However, almost any behavior may be changed with enough time and effort.
People who exercise begin to eat better and produce more at work. They are less smokers and are more patient with friends and family. They claim to feel less anxious and use their credit cards less frequently. A fundamental habit that sparks broad change is exercise.
Habits are strong but also delicate. They may develop independently of our awareness or may be purposefully created. They frequently happen without our consent, but they can be altered by changing their constituent pieces. They have a much greater influence on how we live than we realize; in fact, they are so powerful that they cause our brains to adhere to them above all else, including common sense.
Tribe Of Mentors by Tim Ferriss
Page Count: 561
Rating on Goodreads: 4.06
Unusual book structure. It's worth reading if you want to learn from successful people.
The book is Q&A-style. Tim questions everyone. Each chapter features a different person's life-changing advice. In the book, Pressfield, Willink, Grylls, and Ravikant are interviewed.
Amazing!
My favorite book quotes are:
According to one's courage, life can either get smaller or bigger.
Don't engage in actions that you are aware are immoral. The reputation you have with yourself is all that constitutes self-esteem. Always be aware.
People mistakenly believe that focusing means accepting the task at hand. However, that is in no way what it represents. It entails rejecting the numerous other worthwhile suggestions that exist. You must choose wisely. Actually, I'm just as proud of the things we haven't accomplished as I am of what I have. Saying no to 1,000 things is what innovation is.

Marco Manoppo
3 years ago
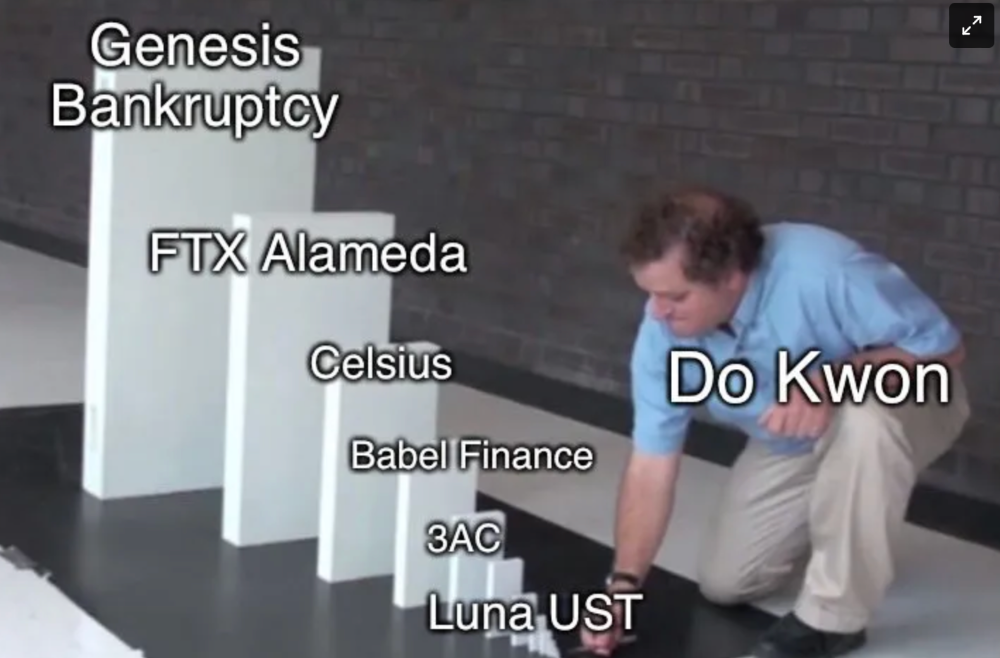
Failures of DCG and Genesis
Don't sleep with your own sister.
70% of lottery winners go broke within five years. You've heard the last one. People who got rich quickly without setbacks and hard work often lose it all. My father said, "Easy money is easily lost," and a wealthy friend who owns a family office said, "The first generation makes it, the second generation spends it, and the third generation blows it."
This is evident. Corrupt politicians in developing countries live lavishly, buying their third wives' fifth Hermès bag and celebrating New Year's at The Brando Resort. A successful businessperson from humble beginnings is more conservative with money. More so if they're atom-based, not bit-based. They value money.
Crypto can "feel" easy. I have nothing against capital market investing. The global financial system is shady, but that's another topic. The problem started when those who took advantage of easy money started affecting other businesses. VCs did minimal due diligence on FTX because they needed deal flow and returns for their LPs. Lenders did minimum diligence and underwrote ludicrous loans to 3AC because they needed revenue.
Alameda (hence FTX) and 3AC made "easy money" Genesis and DCG aren't. Their businesses are more conventional, but they underestimated how "easy money" can hurt them.
Genesis has been the victim of easy money hubris and insolvency, losing $1 billion+ to 3AC and $200M to FTX. We discuss the implications for the broader crypto market.
Here are the quick takeaways:
Genesis is one of the largest and most notable crypto lenders and prime brokerage firms.
DCG and Genesis have done related party transactions, which can be done right but is a bad practice.
Genesis owes DCG $1.5 billion+.
If DCG unwinds Grayscale's GBTC, $9-10 billion in BTC will hit the market.
DCG will survive Genesis.
What happened?
Let's recap the FTX shenanigan from two weeks ago. Shenanigans! Delphi's tweet sums up the craziness. Genesis has $175M in FTX.
Cred's timeline: I hate bad crisis management. Yes, admitting their balance sheet hole right away might've sparked more panic, and there's no easy way to convey your trouble, but no one ever learns.
By November 23, rumors circulated online that the problem could affect Genesis' parent company, DCG. To address this, Barry Silbert, Founder, and CEO of DCG released a statement to shareholders.
A few things are confirmed thanks to this statement.
DCG owes $1.5 billion+ to Genesis.
$500M is due in 6 months, and the rest is due in 2032 (yes, that’s not a typo).
Unless Barry raises new cash, his last-ditch efforts to repay the money will likely push the crypto market lower.
Half a year of GBTC fees is approximately $100M.
They can pay $500M with GBTC.
With profits, sell another port.
Genesis has hired a restructuring adviser, indicating it is in trouble.
Rehypothecation
Every crypto problem in the past year seems to be rehypothecation between related parties, excessive leverage, hubris, and the removal of the money printer. The Bankless guys provided a chart showing 2021 crypto yield.
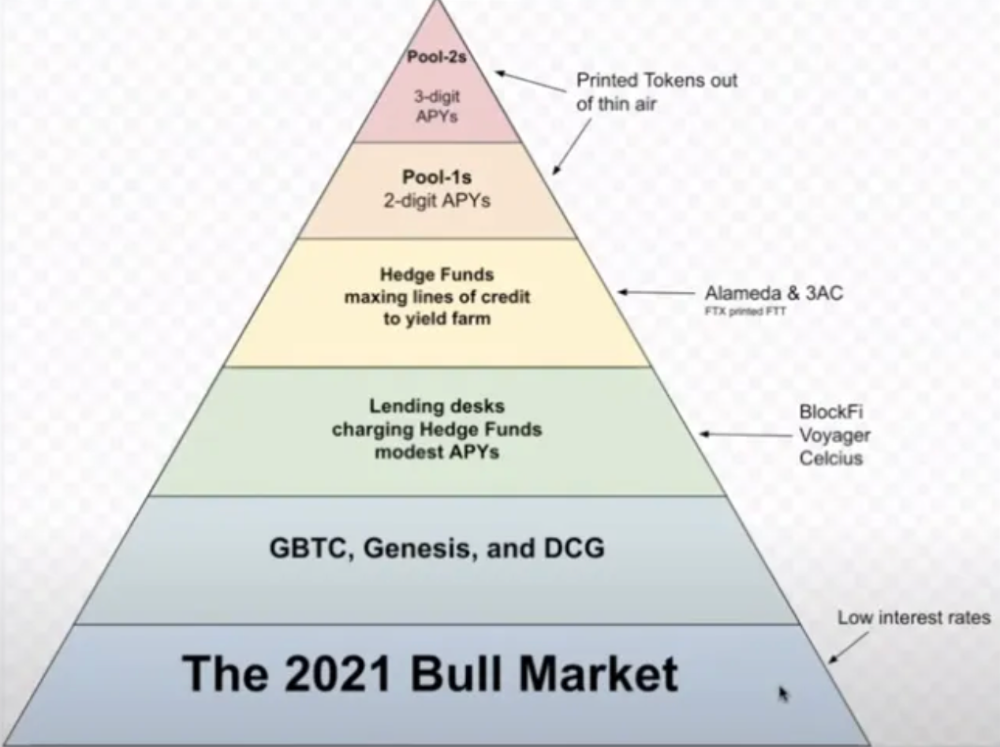
In June 2022, @DataFinnovation published a great investigation about 3AC and DCG. Here's a summary.
3AC borrowed BTC from Genesis and pledged it to create Grayscale's GBTC shares.
3AC uses GBTC to borrow more money from Genesis.
This lets 3AC leverage their capital.
3AC's strategy made sense because GBTC had a premium, creating "free money."
GBTC's discount and LUNA's implosion caused problems.
3AC lost its loan money in LUNA.
Margin called on 3ACs' GBTC collateral.
DCG bought GBTC to avoid a systemic collapse and a larger discount.
Genesis lost too much money because 3AC can't pay back its loan. DCG "saved" Genesis, but the FTX collapse hurt Genesis further, forcing DCG and Genesis to seek external funding.
bruh…
Learning Experience
Co-borrowing. Unnecessary rehypothecation. Extra space. Governance disaster. Greed, hubris. Crypto has repeatedly shown it can recreate traditional financial system disasters quickly. Working in crypto is one of the best ways to learn crazy financial tricks people will do for a quick buck much faster than if you dabble in traditional finance.
Moving Forward
I think the crypto industry needs to consider its future. This is especially true for professionals. I'm not trying to scare you. In 2018 and 2020, I had doubts. No doubts now. Detailing the crypto industry's potential outcomes helped me gain certainty and confidence in its future. This includes VCs' benefits and talking points during the bull market, as well as what would happen if government regulations became hostile, etc. Even if that happens, I'm certain. This is permanent. I may write a post about that soon.
Sincerely,
M.