


More on Marketing

M.G. Siegler
3 years ago
Apple: Showing Ads on Your iPhone
This report from Mark Gurman has stuck with me:
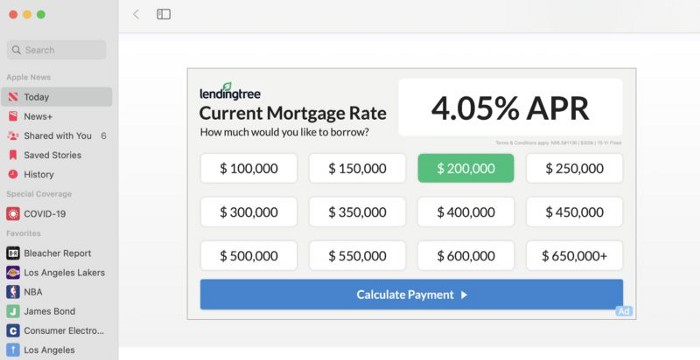
In the News and Stocks apps, the display ads are no different than what you might get on an ad-supported website. In the App Store, the ads are for actual apps, which are probably more useful for Apple users than mortgage rates. Some people may resent Apple putting ads in the News and Stocks apps. After all, the iPhone is supposed to be a premium device. Let’s say you shelled out $1,000 or more to buy one, do you want to feel like Apple is squeezing more money out of you just to use its standard features? Now, a portion of ad revenue from the News app’s Today tab goes to publishers, but it’s not clear how much. Apple also lets publishers advertise within their stories and keep the vast majority of that money. Surprisingly, Today ads also appear if you subscribe to News+ for $10 per month (though it’s a smaller number).
I use Apple News often. It's a good general news catch-up tool, like Twitter without the BS. Customized notifications are helpful. Fast and lovely. Except for advertisements. I have Apple One, which includes News+, and while I understand why the magazines still have brand ads, it's ridiculous to me that Apple enables web publishers to introduce awful ads into this experience. Apple's junky commercials are ridiculous.
We know publishers want and probably requested this. Let's keep Apple News ad-free for the much smaller percentage of paid users, and here's your portion. (Same with Stocks, which is more sillier.)
Paid app placement in the App Store is a wonderful approach for developers to find new users (though far too many of those ads are trying to trick users, in my opinion).
Apple is also planning to increase ads in its Maps app. This sounds like Google Maps, and I don't like it. I never find these relevant, and they clutter up the user experience. Apple Maps now has a UI advantage (though not a data/search one, which matters more).
Apple is nickel-and-diming its customers. We spend thousands for their products and premium services like Apple One. We all know why: income must rise, and new firms are needed to scale. This will eventually backfire.

Jano le Roux
3 years ago
Here's What I Learned After 30 Days Analyzing Apple's Microcopy
Move people with tiny words.
Apple fanboy here.
Macs are awesome.
Their iPhones rock.
$19 cloths are great.
$999 stands are amazing.
I love Apple's microcopy even more.
It's like the marketing goddess bit into the Apple logo and blessed the world with microcopy.
I took on a 30-day micro-stalking mission.
Every time I caught myself wasting time on YouTube, I had to visit Apple’s website to learn the secrets of the marketing goddess herself.
We've learned. Golden apples are calling.
Cut the friction
Benefit-first, not commitment-first.
Brands lose customers through friction.
Most brands don't think like customers.
Brands want sales.
Brands want newsletter signups.
Here's their microcopy:
“Buy it now.”
“Sign up for our newsletter.”
Both are difficult. They ask for big commitments.
People are simple creatures. Want pleasure without commitment.
Apple nails this.
So, instead of highlighting the commitment, they highlight the benefit of the commitment.
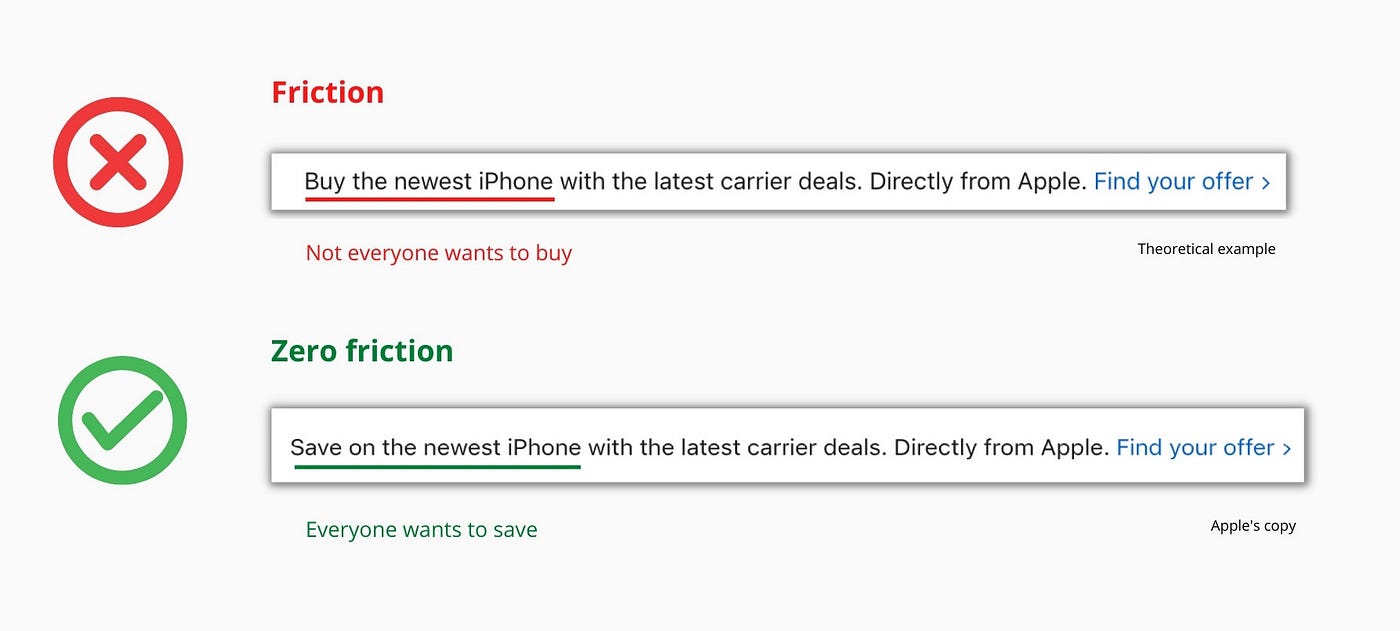
Saving on the latest iPhone sounds easier than buying it. Everyone saves, but not everyone buys.
A subtle change in framing reduces friction.
Apple eliminates customer objections to reduce friction.
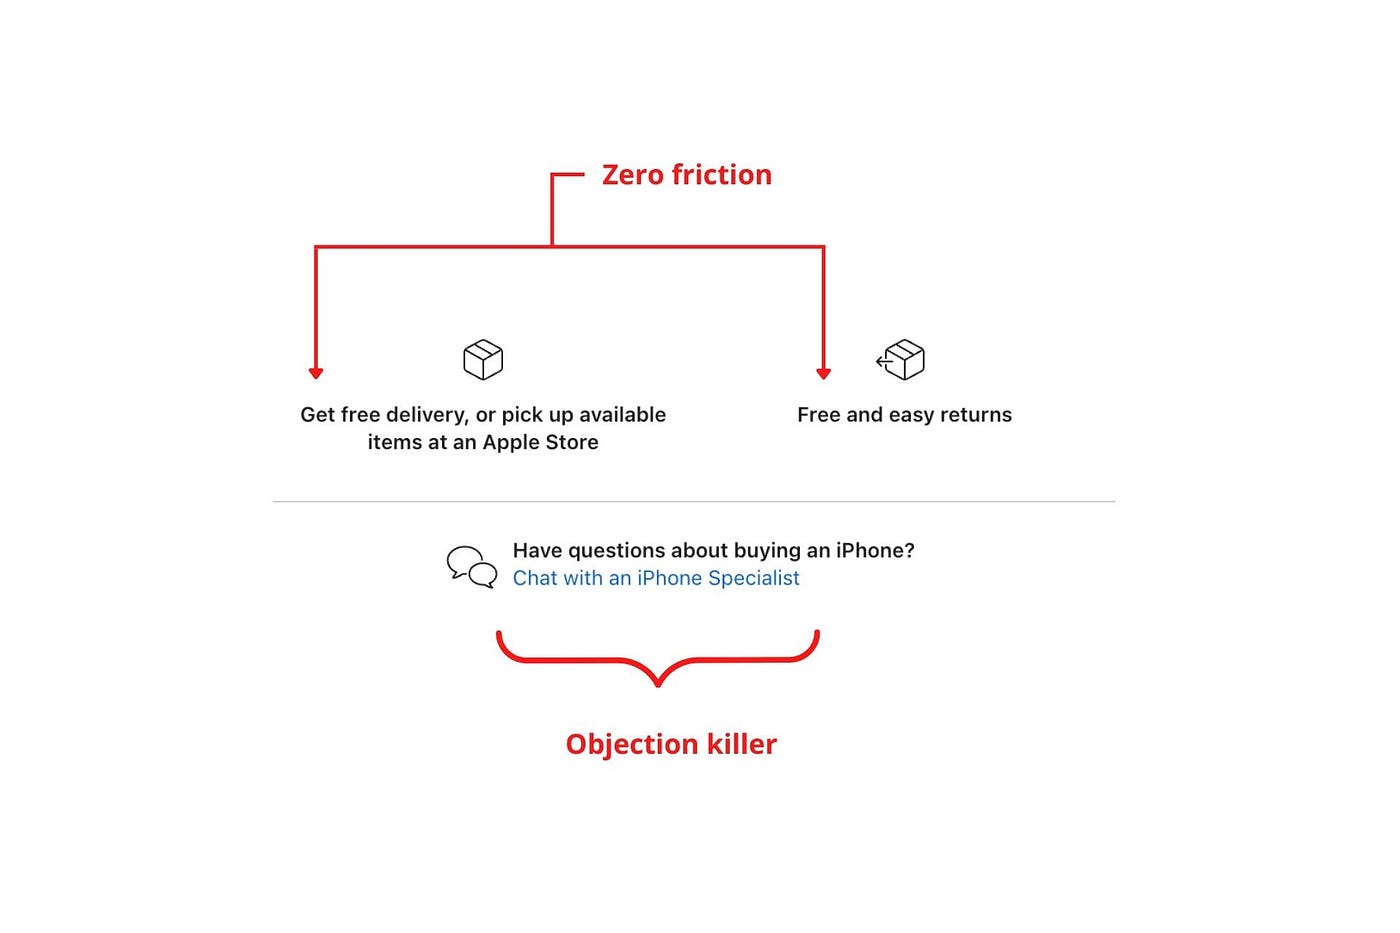
Less customer friction means simpler processes.
Apple's copy expertly reassures customers about shipping fees and not being home. Apple assures customers that returning faulty products is easy.
Apple knows that talking to a real person is the best way to reduce friction and improve their copy.
Always rhyme
Learn about fine rhyme.
Poets make things beautiful with rhyme.
Copywriters use rhyme to stand out.
Apple’s copywriters have mastered the art of corporate rhyme.
Two techniques are used.
1. Perfect rhyme
Here, rhymes are identical.

2. Imperfect rhyme
Here, rhyming sounds vary.

Apple prioritizes meaning over rhyme.
Apple never forces rhymes that don't fit.
It fits so well that the copy seems accidental.
Add alliteration
Alliteration always entertains.
Alliteration repeats initial sounds in nearby words.
Apple's copy uses alliteration like no other brand I've seen to create a rhyming effect or make the text more fun to read.
For example, in the sentence "Sam saw seven swans swimming," the initial "s" sound is repeated five times. This creates a pleasing rhythm.
Microcopy overuse is like pouring ketchup on a Michelin-star meal.
Alliteration creates a memorable phrase in copywriting. It's subtler than rhyme, and most people wouldn't notice; it simply resonates.
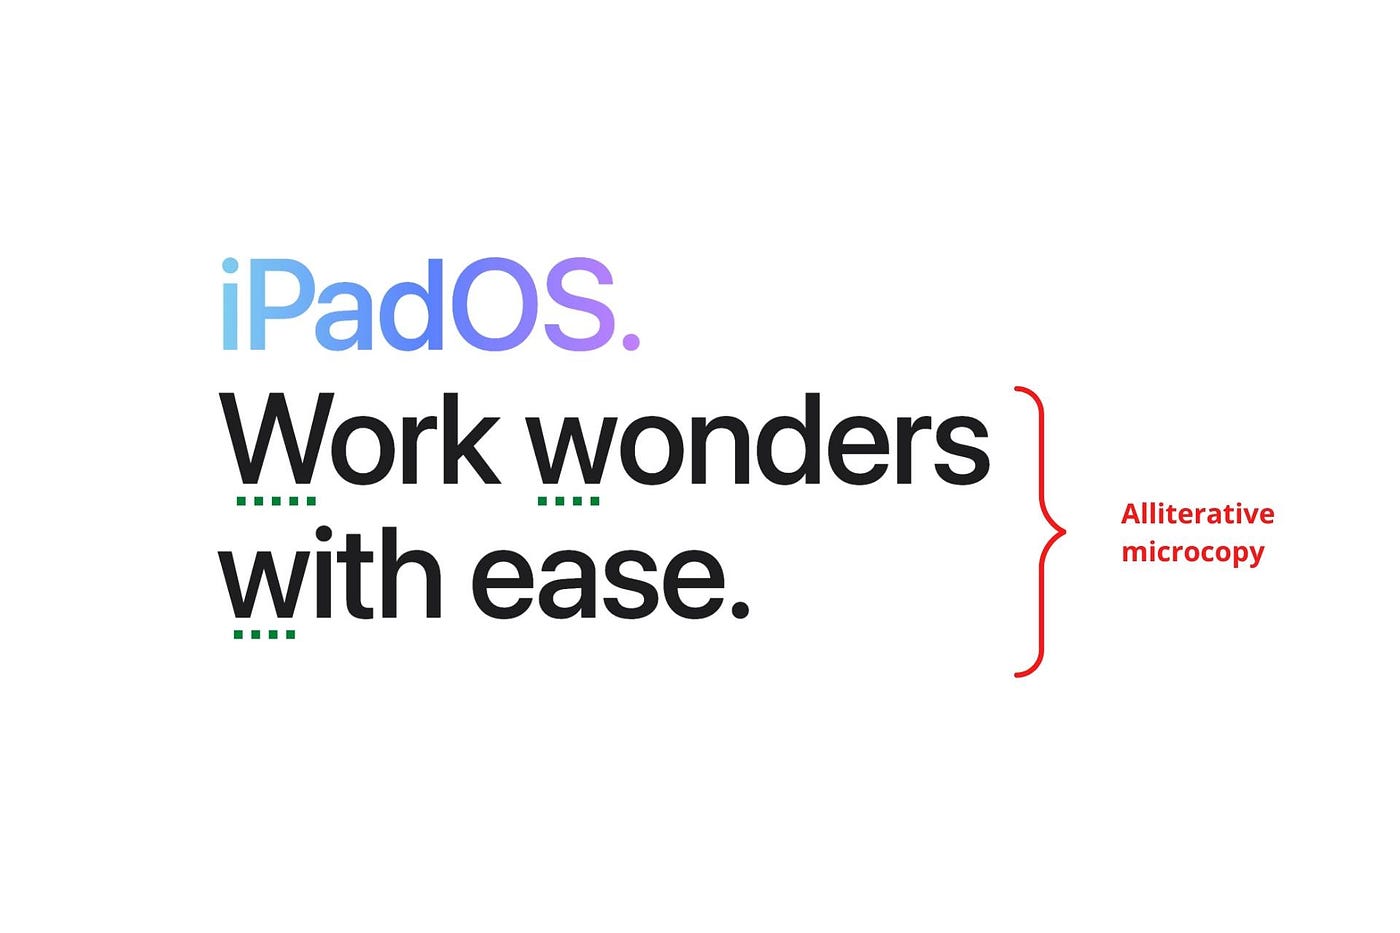
I love how Apple uses alliteration and contrast between "wonders" and "ease".
Assonance, or repeating vowels, isn't Apple's thing.
You ≠ Hero, Customer = Hero
Your brand shouldn't be the hero.
Because they'll be using your product or service, your customer should be the hero of your copywriting. With your help, they should feel like they can achieve their goals.
I love how Apple emphasizes what you can do with the machine in this microcopy.

It's divine how they position their tools as sidekicks to help below.
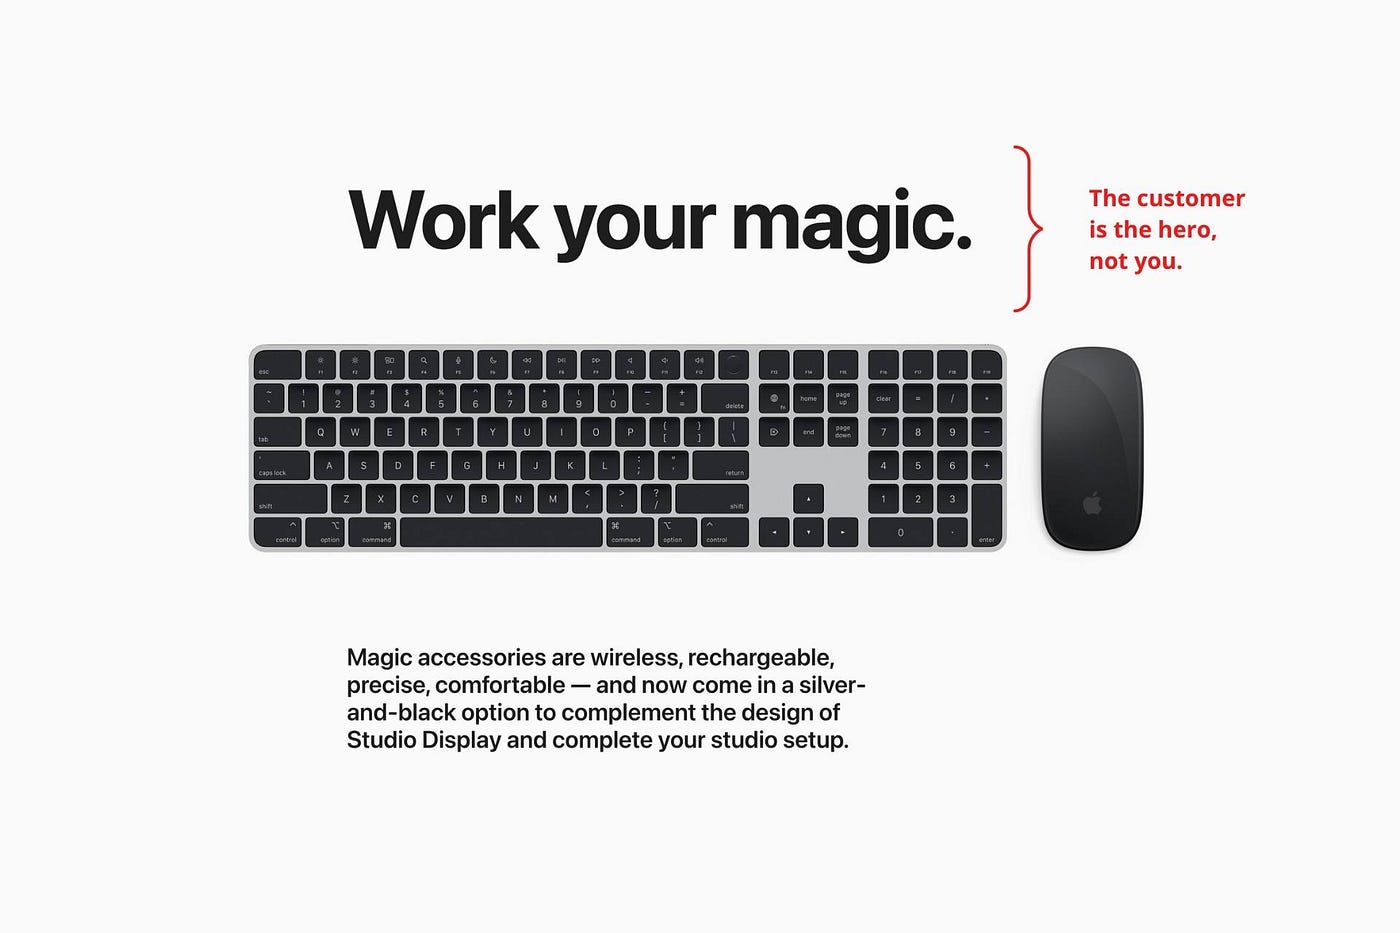
This one takes the cake:
Dialogue-style writing
Conversational copy engages.
Excellent copy Like sharing gum with a friend.
This helps build audience trust.
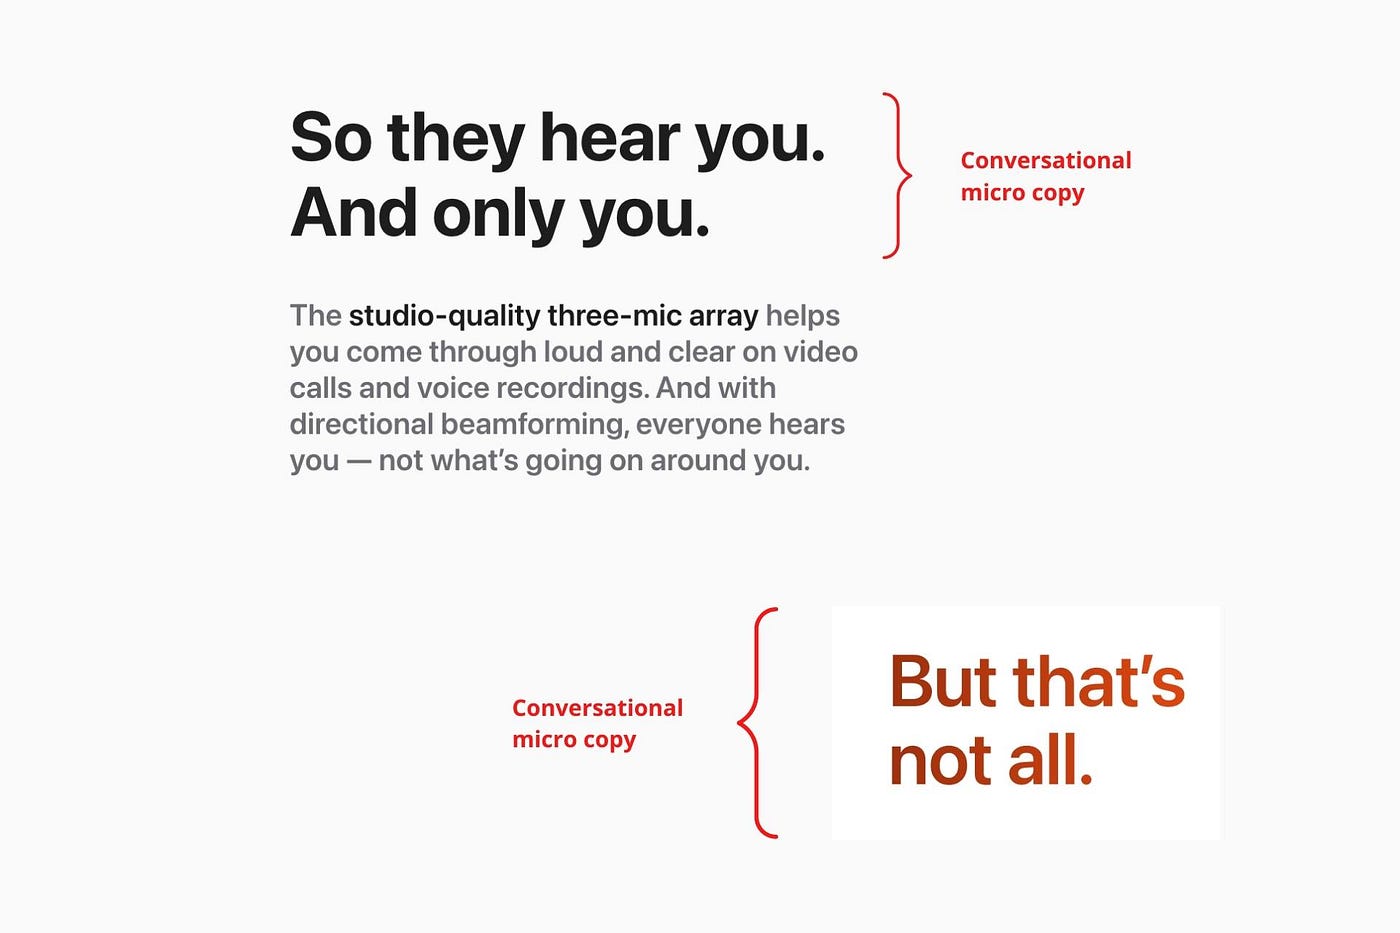
Apple does this by using natural connecting words like "so" and phrases like "But that's not all."
Snowclone-proof
The mother of all microcopy techniques.
A snowclone uses an existing phrase or sentence to create a new one. The new phrase or sentence uses the same structure but different words.
It’s usually a well know saying like:
To be or not to be.
This becomes a formula:
To _ or not to _.
Copywriters fill in the blanks with cause-related words. Example:
To click or not to click.

Apple turns "survival of the fittest" into "arrival of the fittest."
It's unexpected and surprises the reader.
So this was fun.
But my fun has just begun.
Microcopy is 21st-century poetry.
I came as an Apple fanboy.
I leave as an Apple fanatic.
Now I’m off to find an apple tree.
Cause you know how it goes.
(Apples, trees, etc.)
This post is a summary. Original post available here.
Emma Jade
3 years ago
6 hacks to create content faster
Content gurus' top time-saving hacks.
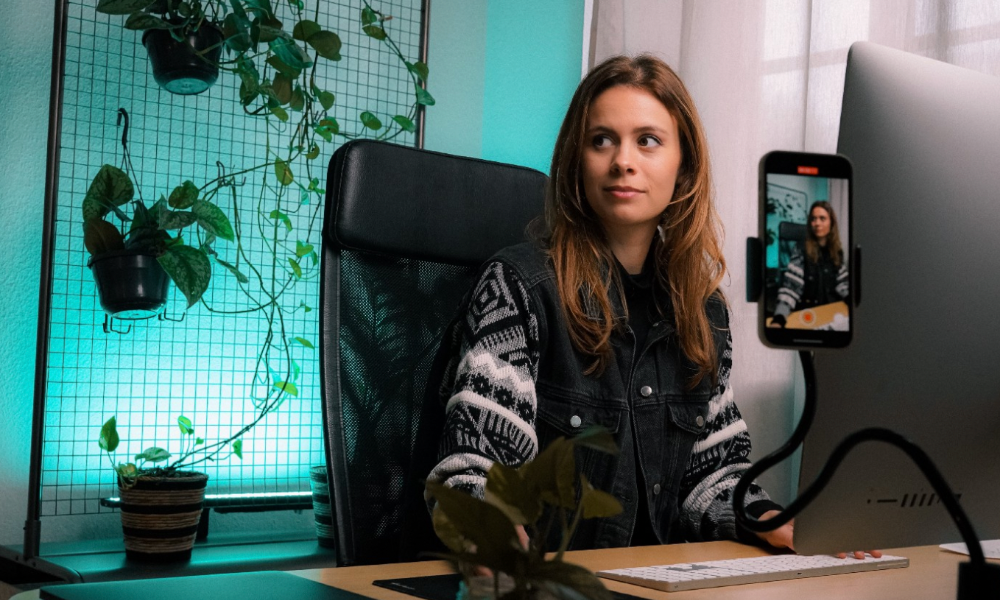
I'm a content strategist, writer, and graphic designer. Time is more valuable than money.
Money is always available. Even if you're poor. Ways exist.
Time is passing, and one day we'll run out.
Sorry to be morbid.
In today's digital age, you need to optimize how you create content for your organization. Here are six content creation hacks.
1. Use templates
Use templates to streamline your work whether generating video, images, or documents.
Setup can take hours. Using a free resource like Canva, you can create templates for any type of material.
This will save you hours each month.
2. Make a content calendar
You post without a plan? A content calendar solves 50% of these problems.
You can prepare, organize, and plan your material ahead of time so you're not scrambling when you remember, "Shit, it's Mother's Day!"
3. Content Batching
Batching content means creating a lot in one session. This is helpful for video content that requires a lot of setup time.
Batching monthly content saves hours. Time is a valuable resource.
When working on one type of task, it's easy to get into a flow state. This saves time.
4. Write Caption
On social media, we generally choose the image first and then the caption. Writing captions first sometimes work better, though.
Writing the captions first can allow you more creative flexibility and be easier if you're not excellent with language.
Say you want to tell your followers something interesting.
Writing a caption first is easier than choosing an image and then writing a caption to match.
Not everything works. You may have already-created content that needs captioning. When you don't know what to share, think of a concept, write the description, and then produce a video or graphic.
Cats can be skinned in several ways..
5. Repurpose
Reuse content when possible. You don't always require new stuff. In fact, you’re pretty stupid if you do #SorryNotSorry.
Repurpose old content. All those blog entries, videos, and unfinished content on your desk or hard drive.
This blog post can be turned into a social media infographic. Canva's motion graphic function can animate it. I can record a YouTube video regarding this issue for a podcast. I can make a post on each point in this blog post and turn it into an eBook or paid course.
And it doesn’t stop there.
My point is, to think outside the box and really dig deep into ways you can leverage the content you’ve already created.
6. Schedule Them
If you're still manually posting content, get help. When you batch your content, schedule it ahead of time.
Some scheduling apps are free or cheap. No excuses.
Don't publish and ghost.
Scheduling saves time by preventing you from doing it manually. But if you never engage with your audience, the algorithm won't reward your material.
Be online and engage your audience.
Content Machine
Use these six content creation hacks. They help you succeed and save time.
You might also like

Vitalik
3 years ago
An approximate introduction to how zk-SNARKs are possible (part 2)
If tasked with the problem of coming up with a zk-SNARK protocol, many people would make their way to this point and then get stuck and give up. How can a verifier possibly check every single piece of the computation, without looking at each piece of the computation individually? But it turns out that there is a clever solution.
Polynomials
Polynomials are a special class of algebraic expressions of the form:
- x+5
- x^4
- x^3+3x^2+3x+1
- 628x^{271}+318x^{270}+530x^{269}+…+69x+381
i.e. they are a sum of any (finite!) number of terms of the form cx^k
There are many things that are fascinating about polynomials. But here we are going to zoom in on a particular one: polynomials are a single mathematical object that can contain an unbounded amount of information (think of them as a list of integers and this is obvious). The fourth example above contained 816 digits of tau, and one can easily imagine a polynomial that contains far more.
Furthermore, a single equation between polynomials can represent an unbounded number of equations between numbers. For example, consider the equation A(x)+ B(x) = C(x). If this equation is true, then it's also true that:
- A(0)+B(0)=C(0)
- A(1)+B(1)=C(1)
- A(2)+B(2)=C(2)
- A(3)+B(3)=C(3)
And so on for every possible coordinate. You can even construct polynomials to deliberately represent sets of numbers so you can check many equations all at once. For example, suppose that you wanted to check:
- 12+1=13
- 10+8=18
- 15+8=23
- 15+13=28
You can use a procedure called Lagrange interpolation to construct polynomials A(x) that give (12,10,15,15) as outputs at some specific set of coordinates (eg. (0,1,2,3)), B(x) the outputs (1,8,8,13) on thos same coordinates, and so forth. In fact, here are the polynomials:
- A(x)=-2x^3+\frac{19}{2}x^2-\frac{19}{2}x+12
- B(x)=2x^3-\frac{19}{2}x^2+\frac{29}{2}x+1
- C(x)=5x+13
Checking the equation A(x)+B(x)=C(x) with these polynomials checks all four above equations at the same time.
Comparing a polynomial to itself
You can even check relationships between a large number of adjacent evaluations of the same polynomial using a simple polynomial equation. This is slightly more advanced. Suppose that you want to check that, for a given polynomial F, F(x+2)=F(x)+F(x+1) with the integer range {0,1…89} (so if you also check F(0)=F(1)=1, then F(100) would be the 100th Fibonacci number)
As polynomials, F(x+2)-F(x+1)-F(x) would not be exactly zero, as it could give arbitrary answers outside the range x={0,1…98}. But we can do something clever. In general, there is a rule that if a polynomial P is zero across some set S=\{x_1,x_2…x_n\} then it can be expressed as P(x)=Z(x)*H(x), where Z(x)=(x-x_1)*(x-x_2)*…*(x-x_n) and H(x) is also a polynomial. In other words, any polynomial that equals zero across some set is a (polynomial) multiple of the simplest (lowest-degree) polynomial that equals zero across that same set.
Why is this the case? It is a nice corollary of polynomial long division: the factor theorem. We know that, when dividing P(x) by Z(x), we will get a quotient Q(x) and a remainder R(x) is strictly less than that of Z(x). Since we know that P is zero on all of S, it means that R has to be zero on all of S as well. So we can simply compute R(x) via polynomial interpolation, since it's a polynomial of degree at most n-1 and we know n values (the zeros at S). Interpolating a polynomial with all zeroes gives the zero polynomial, thus R(x)=0 and H(x)=Q(x).
Going back to our example, if we have a polynomial F that encodes Fibonacci numbers (so F(x+2)=F(x)+F(x+1) across x=\{0,1…98\}), then I can convince you that F actually satisfies this condition by proving that the polynomial P(x)=F(x+2)-F(x+1)-F(x) is zero over that range, by giving you the quotient:
H(x)=\frac{F(x+2)-F(x+1)-F(x)}{Z(x)}
Where Z(x) = (x-0)*(x-1)*…*(x-98).
You can calculate Z(x) yourself (ideally you would have it precomputed), check the equation, and if the check passes then F(x) satisfies the condition!
Now, step back and notice what we did here. We converted a 100-step-long computation into a single equation with polynomials. Of course, proving the N'th Fibonacci number is not an especially useful task, especially since Fibonacci numbers have a closed form. But you can use exactly the same basic technique, just with some extra polynomials and some more complicated equations, to encode arbitrary computations with an arbitrarily large number of steps.
see part 3
Max Chafkin
3 years ago
Elon Musk Bets $44 Billion on Free Speech's Future
Musk’s purchase of Twitter has sealed his bond with the American right—whether the platform’s left-leaning employees and users like it or not.
Elon Musk's pursuit of Twitter Inc. began earlier this month as a joke. It started slowly, then spiraled out of control, culminating on April 25 with the world's richest man agreeing to spend $44 billion on one of the most politically significant technology companies ever. There have been bigger financial acquisitions, but Twitter's significance has always outpaced its balance sheet. This is a unique Silicon Valley deal.
To recap: Musk announced in early April that he had bought a stake in Twitter, citing the company's alleged suppression of free speech. His complaints were vague, relying heavily on the dog whistles of the ultra-right. A week later, he announced he'd buy the company for $54.20 per share, four days after initially pledging to join Twitter's board. Twitter's directors noticed the 420 reference as well, and responded with a “shareholder rights” plan (i.e., a poison pill) that included a 420 joke.
Musk - Patrick Pleul/Getty Images
No one knew if the bid was genuine. Musk's Twitter plans seemed implausible or insincere. In a tweet, he referred to automated accounts that use his name to promote cryptocurrency. He enraged his prospective employees by suggesting that Twitter's San Francisco headquarters be turned into a homeless shelter, renaming the company Titter, and expressing solidarity with his growing conservative fan base. “The woke mind virus is making Netflix unwatchable,” he tweeted on April 19.
But Musk got funding, and after a frantic weekend of negotiations, Twitter said yes. Unlike most buyouts, Musk will personally fund the deal, putting up up to $21 billion in cash and borrowing another $12.5 billion against his Tesla stock.
Free Speech and Partisanship
Percentage of respondents who agree with the following
The deal is expected to replatform accounts that were banned by Twitter for harassing others, spreading misinformation, or inciting violence, such as former President Donald Trump's account. As a result, Musk is at odds with his own left-leaning employees, users, and advertisers, who would prefer more content moderation rather than less.
Dorsey - Photographer: Joe Raedle/Getty Images
Previously, the company's leadership had similar issues. Founder Jack Dorsey stepped down last year amid concerns about slowing growth and product development, as well as his dual role as CEO of payments processor Block Inc. Compared to Musk, a father of seven who already runs four companies (besides Tesla and SpaceX), Dorsey is laser-focused.
Musk's motivation to buy Twitter may be political. Affirming the American far right with $44 billion spent on “free speech” Right-wing activists have promoted a series of competing upstart Twitter competitors—Parler, Gettr, and Trump's own effort, Truth Social—since Trump was banned from major social media platforms for encouraging rioters at the US Capitol on Jan. 6, 2021. But Musk can give them a social network with lax content moderation and a real user base. Trump said he wouldn't return to Twitter after the deal was announced, but he wouldn't be the first to do so.
Trump - Eli Hiller/Bloomberg
Conservative activists and lawmakers are already ecstatic. “A great day for free speech in America,” said Missouri Republican Josh Hawley. The day the deal was announced, Tucker Carlson opened his nightly Fox show with a 10-minute laudatory monologue. “The single biggest political development since Donald Trump's election in 2016,” he gushed over Musk.
But Musk's supporters and detractors misunderstand how much his business interests influence his political ideology. He marketed Tesla's cars as carbon-saving machines that were faster and cooler than gas-powered luxury cars during George W. Bush's presidency. Musk gained a huge following among wealthy environmentalists who reserved hundreds of thousands of Tesla sedans years before they were made during Barack Obama's presidency. Musk in the Trump era advocated for a carbon tax, but he also fought local officials (and his own workers) over Covid rules that slowed the reopening of his Bay Area factory.
Teslas at the Las Vegas Convention Center Loop Central Station in April 2021. The Las Vegas Convention Center Loop was Musk's first commercial project. Ethan Miller/Getty Images
Musk's rightward shift matched the rise of the nationalist-populist right and the desire to serve a growing EV market. In 2019, he unveiled the Cybertruck, a Tesla pickup, and in 2018, he announced plans to manufacture it at a new plant outside Austin. In 2021, he decided to move Tesla's headquarters there, citing California's "land of over-regulation." After Ford and General Motors beat him to the electric truck market, Musk reframed Tesla as a company for pickup-driving dudes.
Similarly, his purchase of Twitter will be entwined with his other business interests. Tesla has a factory in China and is friendly with Beijing. This could be seen as a conflict of interest when Musk's Twitter decides how to treat Chinese-backed disinformation, as Amazon.com Inc. founder Jeff Bezos noted.
Musk has focused on Twitter's product and social impact, but the company's biggest challenges are financial: Either increase cash flow or cut costs to comfortably service his new debt. Even if Musk can't do that, he can still benefit from the deal. He has recently used the increased attention to promote other business interests: Boring has hyperloops and Neuralink brain implants on the way, Musk tweeted. Remember Tesla's long-promised robotaxis!
Musk may be comfortable saying he has no expectation of profit because it benefits his other businesses. At the TED conference on April 14, Musk insisted that his interest in Twitter was solely charitable. “I don't care about money.”
The rockets and weed jokes make it easy to see Musk as unique—and his crazy buyout will undoubtedly add to that narrative. However, he is a megabillionaire who is risking a small amount of money (approximately 13% of his net worth) to gain potentially enormous influence. Musk makes everything seem new, but this is a rehash of an old media story.

Jeff John Roberts
3 years ago
Jack Dorsey and Jay-Z Launch 'Bitcoin Academy' in Brooklyn rapper's home
The new Bitcoin Academy will teach Jay-Marcy Z's Houses neighbors "What is Cryptocurrency."
Jay-Z grew up in Brooklyn's Marcy Houses. The rapper and Block CEO Jack Dorsey are giving back to his hometown by creating the Bitcoin Academy.
The Bitcoin Academy will offer online and in-person classes, including "What is Money?" and "What is Blockchain?"
The program will provide participants with a mobile hotspot and a small amount of Bitcoin for hands-on learning.
Students will receive dinner and two evenings of instruction until early September. The Shawn Carter Foundation will help with on-the-ground instruction.
Jay-Z and Dorsey announced the program Thursday morning. It will begin at Marcy Houses but may be expanded.
Crypto Blockchain Plug and Black Bitcoin Billionaire, which has received a grant from Block, will teach the classes.
Jay-Z, Dorsey reunite
Jay-Z and Dorsey have previously worked together to promote a Bitcoin and crypto-based future.
In 2021, Dorsey's Block (then Square) acquired the rapper's streaming music service Tidal, which they propose using for NFT distribution.
Dorsey and Jay-Z launched an endowment in 2021 to fund Bitcoin development in Africa and India.
Dorsey is funding the new Bitcoin Academy out of his own pocket (as is Jay-Z), but he's also pushed crypto-related charitable endeavors at Block, including a $5 million fund backed by corporate Bitcoin interest.
This post is a summary. Read full article here