


10 Predictions for Web3 and the Cryptoeconomy for 2022
By Surojit Chatterjee, Chief Product Officer
2021 proved to be a breakout year for crypto with BTC price gaining almost 70% yoy, Defi hitting $150B in value locked, and NFTs emerging as a new category. Here’s my view through the crystal ball into 2022 and what it holds for our industry:
1. Eth scalability will improve, but newer L1 chains will see substantial growth — As we welcome the next hundred million users to crypto and Web3, scalability challenges for Eth are likely to grow. I am optimistic about improvements in Eth scalability with the emergence of Eth2 and many L2 rollups. Traction of Solana, Avalanche and other L1 chains shows that we’ll live in a multi-chain world in the future. We’re also going to see newer L1 chains emerge that focus on specific use cases such as gaming or social media.
2. There will be significant usability improvements in L1-L2 bridges — As more L1 networks gain traction and L2s become bigger, our industry will desperately seek improvements in speed and usability of cross-L1 and L1-L2 bridges. We’re likely to see interesting developments in usability of bridges in the coming year.
3. Zero knowledge proof technology will get increased traction — 2021 saw protocols like ZkSync and Starknet beginning to get traction. As L1 chains get clogged with increased usage, ZK-rollup technology will attract both investor and user attention. We’ll see new privacy-centric use cases emerge, including privacy-safe applications, and gaming models that have privacy built into the core. This may also bring in more regulator attention to crypto as KYC/AML could be a real challenge in privacy centric networks.
4. Regulated Defi and emergence of on-chain KYC attestation — Many Defi protocols will embrace regulation and will create separate KYC user pools. Decentralized identity and on-chain KYC attestation services will play key roles in connecting users’ real identity with Defi wallet endpoints. We’ll see more acceptance of ENS type addresses, and new systems from cross chain name resolution will emerge.
5. Institutions will play a much bigger role in Defi participation — Institutions are increasingly interested in participating in Defi. For starters, institutions are attracted to higher than average interest-based returns compared to traditional financial products. Also, cost reduction in providing financial services using Defi opens up interesting opportunities for institutions. However, they are still hesitant to participate in Defi. Institutions want to confirm that they are only transacting with known counterparties that have completed a KYC process. Growth of regulated Defi and on-chain KYC attestation will help institutions gain confidence in Defi.
6. Defi insurance will emerge — As Defi proliferates, it also becomes the target of security hacks. According to London-based firm Elliptic, total value lost by Defi exploits in 2021 totaled over $10B. To protect users from hacks, viable insurance protocols guaranteeing users’ funds against security breaches will emerge in 2022.
7. NFT Based Communities will give material competition to Web 2.0 social networks — NFTs will continue to expand in how they are perceived. We’ll see creator tokens or fan tokens take more of a first class seat. NFTs will become the next evolution of users’ digital identity and passport to the metaverse. Users will come together in small and diverse communities based on types of NFTs they own. User created metaverses will be the future of social networks and will start threatening the advertising driven centralized versions of social networks of today.
8. Brands will start actively participating in the metaverse and NFTs — Many brands are realizing that NFTs are great vehicles for brand marketing and establishing brand loyalty. Coca-Cola, Campbell’s, Dolce & Gabbana and Charmin released NFT collectibles in 2021. Adidas recently launched a new metaverse project with Bored Ape Yacht Club. We’re likely to see more interesting brand marketing initiatives using NFTs. NFTs and the metaverse will become the new Instagram for brands. And just like on Instagram, many brands may start as NFT native. We’ll also see many more celebrities jumping in the bandwagon and using NFTs to enhance their personal brand.
9. Web2 companies will wake up and will try to get into Web3 — We’re already seeing this with Facebook trying to recast itself as a Web3 company. We’re likely to see other big Web2 companies dipping their toes into Web3 and metaverse in 2022. However, many of them are likely to create centralized and closed network versions of the metaverse.
10. Time for DAO 2.0 — We’ll see DAOs become more mature and mainstream. More people will join DAOs, prompting a change in definition of employment — never receiving a formal offer letter, accepting tokens instead of or along with fixed salaries, and working in multiple DAO projects at the same time. DAOs will also confront new challenges in terms of figuring out how to do M&A, run payroll and benefits, and coordinate activities in larger and larger organizations. We’ll see a plethora of tools emerge to help DAOs execute with efficiency. Many DAOs will also figure out how to interact with traditional Web2 companies. We’re likely to see regulators taking more interest in DAOs and make an attempt to educate themselves on how DAOs work.
Thanks to our customers and the ecosystem for an incredible 2021. Looking forward to another year of building the foundations for Web3. Wagmi.
More on Web3 & Crypto
Scott Hickmann
4 years ago
YouTube
This is a YouTube video:
Isobel Asher Hamilton
3 years ago
$181 million in bitcoin buried in a dump. $11 million to get them back
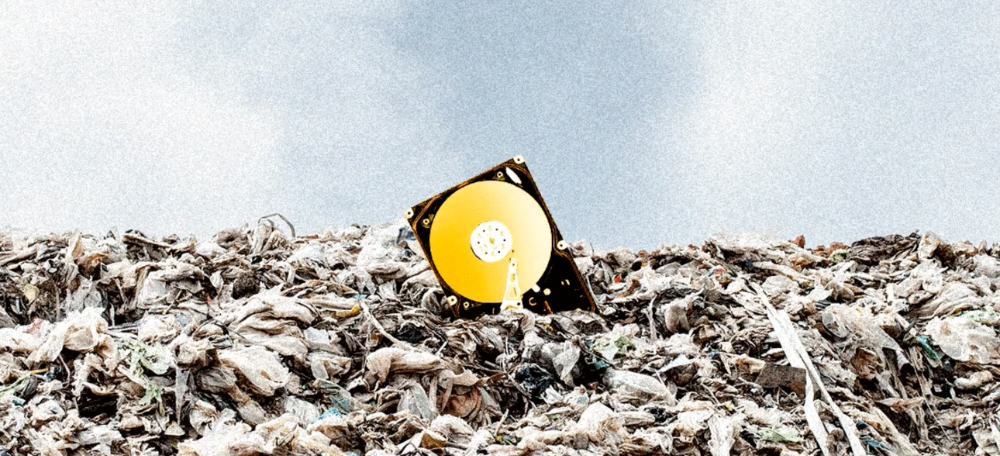
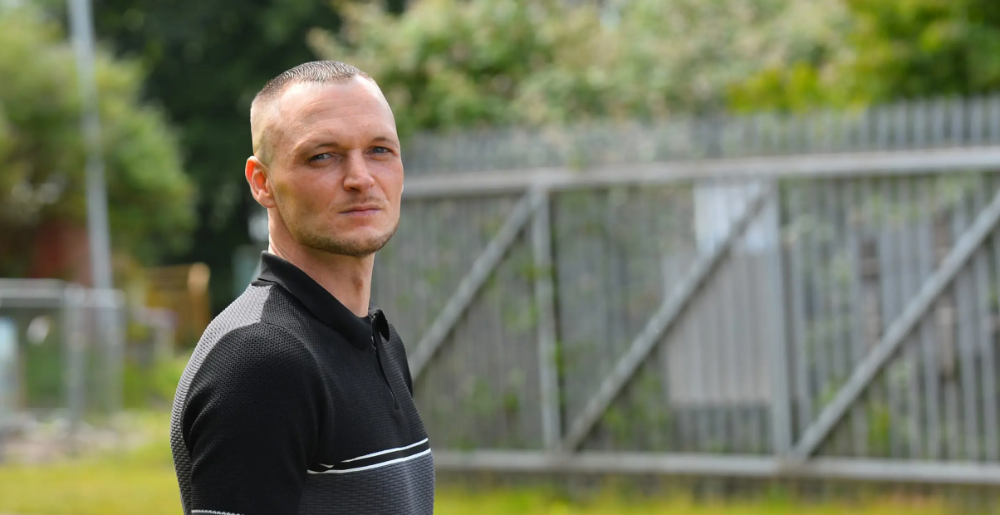
James Howells lost 8,000 bitcoins. He has $11 million to get them back.
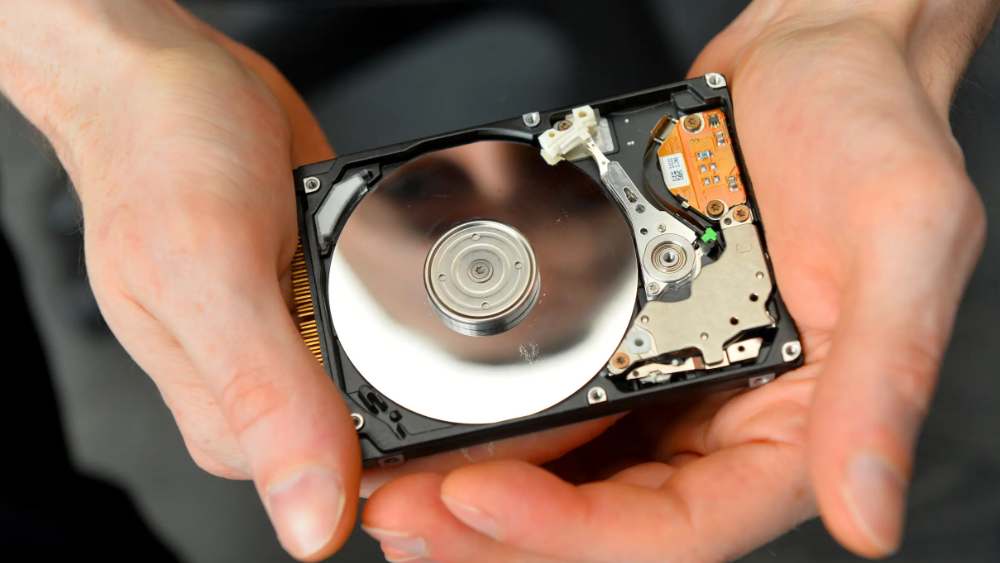
His life altered when he threw out an iPhone-sized hard drive.
Howells, from the city of Newport in southern Wales, had two identical laptop hard drives squirreled away in a drawer in 2013. One was blank; the other had 8,000 bitcoins, currently worth around $181 million.
He wanted to toss out the blank one, but the drive containing the Bitcoin went to the dump.
He's determined to reclaim his 2009 stash.
Howells, 36, wants to arrange a high-tech treasure hunt for bitcoins. He can't enter the landfill.
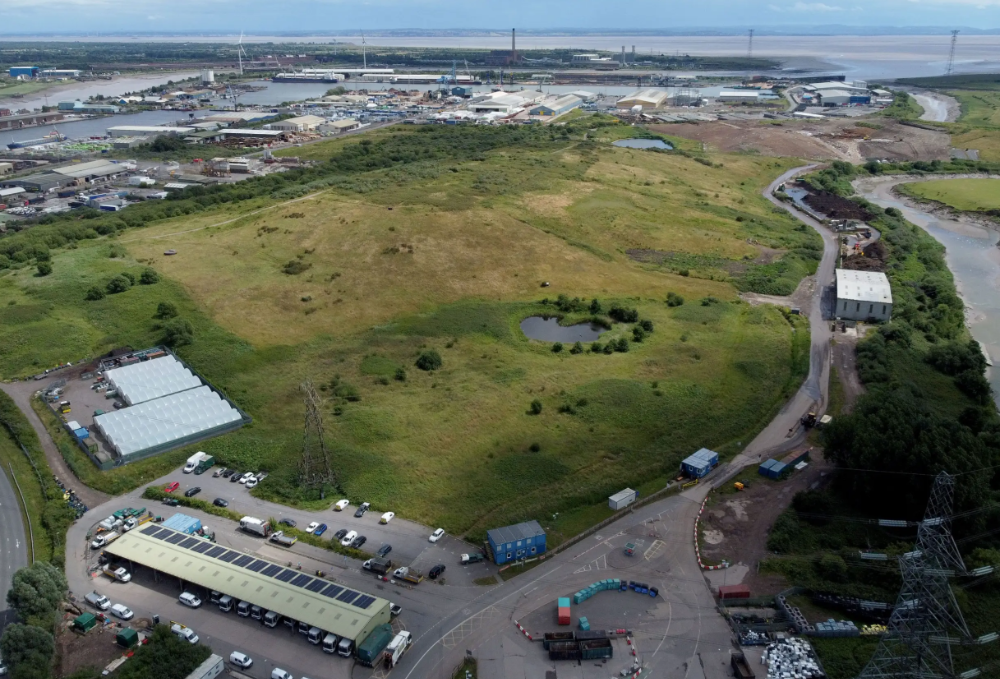
Newport's city council has rebuffed Howells' requests to dig for his hard drive for almost a decade, stating it would be expensive and environmentally destructive.
I got an early look at his $11 million idea to search 110,000 tons of trash. He expects submitting it to the council would convince it to let him recover the hard disk.
110,000 tons of trash, 1 hard drive
Finding a hard disk among heaps of trash may seem Herculean.
Former IT worker Howells claims it's possible with human sorters, robot dogs, and an AI-powered computer taught to find hard drives on a conveyor belt.
His idea has two versions, depending on how much of the landfill he can search.
His most elaborate solution would take three years and cost $11 million to sort 100,000 metric tons of waste. Scaled-down version costs $6 million and takes 18 months.
He's created a team of eight professionals in AI-powered sorting, landfill excavation, garbage management, and data extraction, including one who recovered Columbia's black box data.
The specialists and their companies would be paid a bonus if they successfully recovered the bitcoin stash.
Howells: "We're trying to commercialize this project."
Howells claimed rubbish would be dug up by machines and sorted near the landfill.
Human pickers and a Max-AI machine would sort it. The machine resembles a scanner on a conveyor belt.
Remi Le Grand of Max-AI told us it will train AI to recognize Howells-like hard drives. A robot arm would select candidates.
Howells has added security charges to his scheme because he fears people would steal the hard drive.
He's budgeted for 24-hour CCTV cameras and two robotic "Spot" canines from Boston Dynamics that would patrol at night and look for his hard drive by day.
Howells said his crew met in May at the Celtic Manor Resort outside Newport for a pitch rehearsal.
Richard Hammond's narrative swings from banal to epic.
Richard Hammond filmed the meeting and created a YouTube documentary on Howells.
Hammond said of Howells' squad, "They're committed and believe in him and the idea."
Hammond: "It goes from banal to gigantic." "If I were in his position, I wouldn't have the strength to answer the door."
Howells said trash would be cleaned and repurposed after excavation. Reburying the rest.
"We won't pollute," he declared. "We aim to make everything better."
After the project is finished, he hopes to develop a solar or wind farm on the dump site. The council is unlikely to accept his vision soon.
A council representative told us, "Mr. Howells can't convince us of anything." "His suggestions constitute a significant ecological danger, which we can't tolerate and are forbidden by our permit."
Will the recovered hard drive work?
The "platter" is a glass or metal disc that holds the hard drive's data. Howells estimates 80% to 90% of the data will be recoverable if the platter isn't damaged.
Phil Bridge, a data-recovery expert who consulted Howells, confirmed these numbers.
If the platter is broken, Bridge adds, data recovery is unlikely.
Bridge says he was intrigued by the proposal. "It's an intriguing case," he added. Helping him get it back and proving everyone incorrect would be a great success story.
Who'd pay?
Swiss and German venture investors Hanspeter Jaberg and Karl Wendeborn told us they would fund the project if Howells received council permission.
Jaberg: "It's a needle in a haystack and a high-risk investment."
Howells said he had no contract with potential backers but had discussed the proposal in Zoom meetings. "Until Newport City Council gives me something in writing, I can't commit," he added.
Suppose he finds the bitcoins.
Howells said he would keep 30% of the data, worth $54 million, if he could retrieve it.
A third would go to the recovery team, 30% to investors, and the remainder to local purposes, including gifting £50 ($61) in bitcoin to each of Newport's 150,000 citizens.
Howells said he opted to spend extra money on "professional firms" to help convince the council.
What if the council doesn't approve?
If Howells can't win the council's support, he'll sue, claiming its actions constitute a "illegal embargo" on the hard drive. "I've avoided that path because I didn't want to cause complications," he stated. I wanted to cooperate with Newport's council.
Howells never met with the council face-to-face. He mentioned he had a 20-minute Zoom meeting in May 2021 but thought his new business strategy would help.
He met with Jessica Morden on June 24. Morden's office confirmed meeting.
After telling the council about his proposal, he can only wait. "I've never been happier," he said. This is our most professional operation, with the best employees.
The "crypto proponent" buys bitcoin every month and sells it for cash.
Howells tries not to think about what he'd do with his part of the money if the hard disk is found functional. "Otherwise, you'll go mad," he added.
This post is a summary. Read the full article here.
The Verge
3 years ago
Bored Ape Yacht Club creator raises $450 million at a $4 billion valuation.
Yuga Labs, owner of three of the biggest NFT brands on the market, announced today a $450 million funding round. The money will be used to create a media empire based on NFTs, starting with games and a metaverse project.
The team's Otherside metaverse project is an MMORPG meant to connect the larger NFT universe. They want to create “an interoperable world” that is “gamified” and “completely decentralized,” says Wylie Aronow, aka Gordon Goner, co-founder of Bored Ape Yacht Club. “We think the real Ready Player One experience will be player run.”
Just a few weeks ago, Yuga Labs announced the acquisition of CryptoPunks and Meebits from Larva Labs. The deal brought together three of the most valuable NFT collections, giving Yuga Labs more IP to work with when developing games and metaverses. Last week, ApeCoin was launched as a cryptocurrency that will be governed independently and used in Yuga Labs properties.
Otherside will be developed by “a few different game studios,” says Yuga Labs CEO Nicole Muniz. The company plans to create development tools that allow NFTs from other projects to work inside their world. “We're welcoming everyone into a walled garden.”
However, Yuga Labs believes that other companies are approaching metaverse projects incorrectly, allowing the startup to stand out. People won't bond spending time in a virtual space with nothing going on, says Yuga Labs co-founder Greg Solano, aka Gargamel. Instead, he says, people bond when forced to work together.
In order to avoid getting smacked, Solano advises making friends. “We don't think a Zoom chat and walking around saying ‘hi' creates a deep social experience.” Yuga Labs refused to provide a release date for Otherside. Later this year, a play-to-win game is planned.
The funding round was led by Andreessen Horowitz, a major investor in the Web3 space. It previously backed OpenSea and Coinbase. Animoca Brands, Coinbase, and MoonPay are among those who have invested. Andreessen Horowitz general partner Chris Lyons will join Yuga Labs' board. The Financial Times broke the story last month.
"META IS A DOMINANT DIGITAL EXPERIENCE PROVIDER IN A DYSTOPIAN FUTURE."
This emerging [Web3] ecosystem is important to me, as it is to companies like Meta,” Chris Dixon, head of Andreessen Horowitz's crypto arm, tells The Verge. “In a dystopian future, Meta is the dominant digital experience provider, and it controls all the money and power.” (Andreessen Horowitz co-founder Marc Andreessen sits on Meta's board and invested early in Facebook.)
Yuga Labs has been profitable so far. According to a leaked pitch deck, the company made $137 million last year, primarily from its NFT brands, with a 95% profit margin. (Yuga Labs declined to comment on deck figures.)
But the company has built little so far. According to OpenSea data, it has only released one game for a limited time. That means Yuga Labs gets hundreds of millions of dollars to build a gaming company from scratch, based on a hugely lucrative art project.
Investors fund Yuga Labs based on its success. That's what they did, says Dixon, “they created a culture phenomenon”. But ultimately, the company is betting on the same thing that so many others are: that a metaverse project will be the next big thing. Now they must construct it.
You might also like

Sam Hickmann
3 years ago
Donor-Advised Fund Tax Benefits (DAF)
Giving through a donor-advised fund can be tax-efficient. Using a donor-advised fund can reduce your tax liability while increasing your charitable impact.
Grow Your Donations Tax-Free.
Your DAF's charitable dollars can be invested before being distributed. Your DAF balance can grow with the market. This increases grantmaking funds. The assets of the DAF belong to the charitable sponsor, so you will not be taxed on any growth.
Avoid a Windfall Tax Year.
DAFs can help reduce tax burdens after a windfall like an inheritance, business sale, or strong market returns. Contributions to your DAF are immediately tax deductible, lowering your taxable income. With DAFs, you can effectively pre-fund years of giving with assets from a single high-income event.
Make a contribution to reduce or eliminate capital gains.
One of the most common ways to fund a DAF is by gifting publicly traded securities. Securities held for more than a year can be donated at fair market value and are not subject to capital gains tax. If a donor liquidates assets and then donates the proceeds to their DAF, capital gains tax reduces the amount available for philanthropy. Gifts of appreciated securities, mutual funds, real estate, and other assets are immediately tax deductible up to 30% of Adjusted gross income (AGI), with a five-year carry-forward for gifts that exceed AGI limits.
Using Appreciated Stock as a Gift
Donating appreciated stock directly to a DAF rather than liquidating it and donating the proceeds reduces philanthropists' tax liability by eliminating capital gains tax and lowering marginal income tax.
In the example below, a donor has $100,000 in long-term appreciated stock with a cost basis of $10,000:
Using a DAF would allow this donor to give more to charity while paying less taxes. This strategy often allows donors to give more than 20% more to their favorite causes.
For illustration purposes, this hypothetical example assumes a 35% income tax rate. All realized gains are subject to the federal long-term capital gains tax of 20% and the 3.8% Medicare surtax. No other state taxes are considered.
The information provided here is general and educational in nature. It is not intended to be, nor should it be construed as, legal or tax advice. NPT does not provide legal or tax advice. Furthermore, the content provided here is related to taxation at the federal level only. NPT strongly encourages you to consult with your tax advisor or attorney before making charitable contributions.

Owolabi Judah
3 years ago
How much did YouTube pay for 10 million views?
Ali's $1,054,053.74 YouTube Adsense haul.
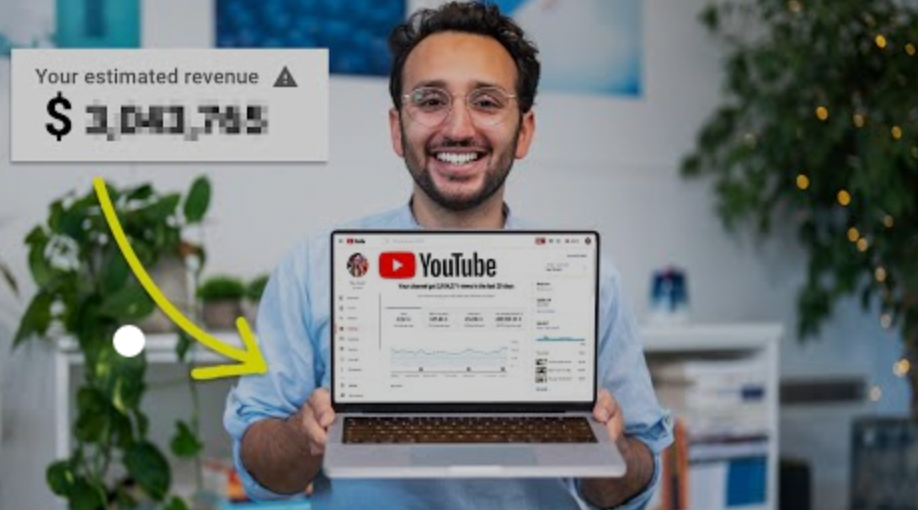
YouTuber, entrepreneur, and former doctor Ali Abdaal. He began filming productivity and financial videos in 2017. Ali Abdaal has 3 million YouTube subscribers and has crossed $1 million in AdSense revenue. Crazy, no?
Ali will share the revenue of his top 5 youtube videos, things he's learned that you can apply to your side hustle, and how many views it takes to make a livelihood off youtube.
First, "The Long Game."
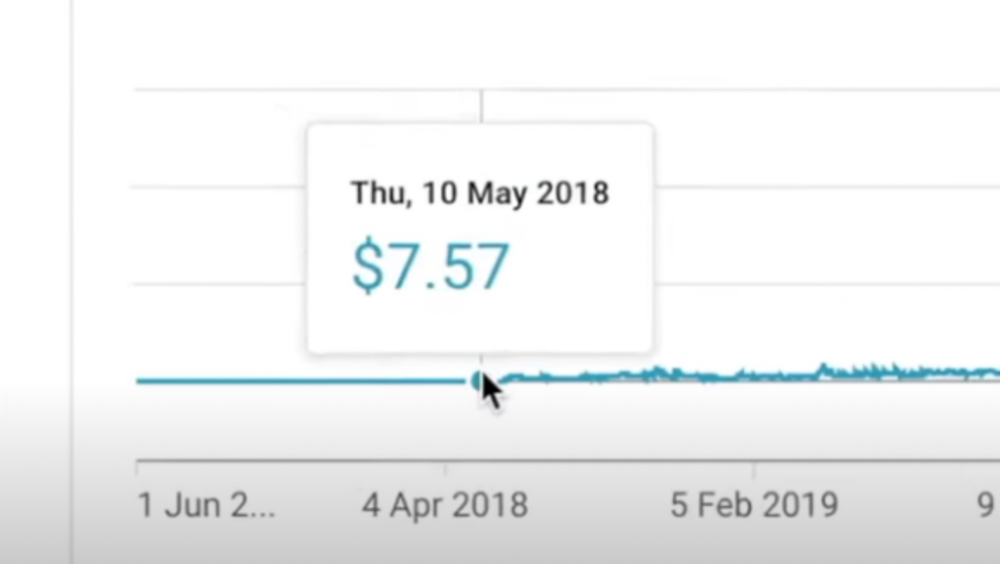
All good things take time to bear fruit. Compounding improves everything. Long-term work yields better returns. Ali made his first dollar after nine months and 85 videos.
Second, "One piece of content can transform your life, but you never know which one."
Had he abandoned YouTube at 84 videos without making any money, he wouldn't have filmed the 85th video that altered everything.
Third Lesson: Your Industry Choice Can Multiply.
The industry or niche you target as a business owner or side hustler can have a major impact on how much money you make.
Here are the top 5 videos.
1) 9.8m views: $191,258.16 for 9 passive income ideas
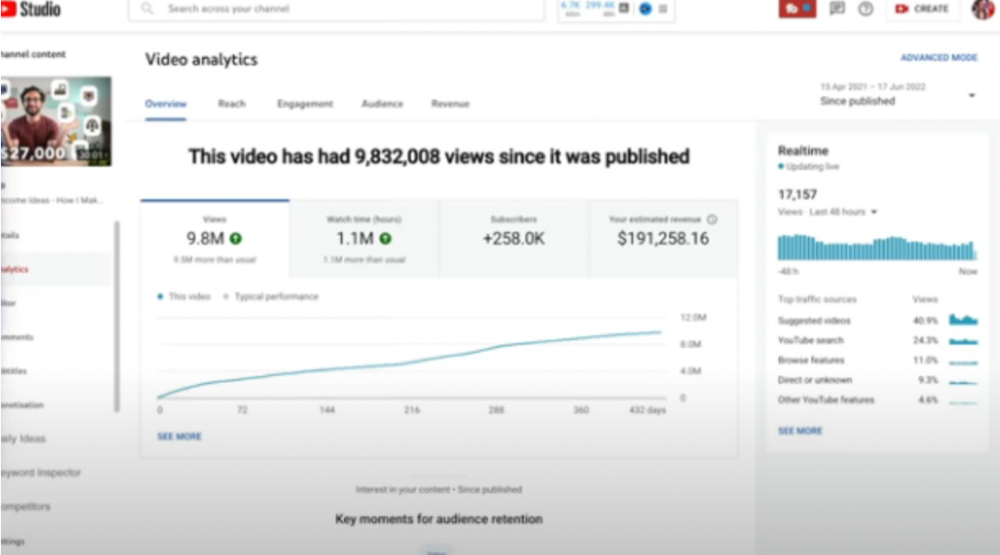
Ali made 2 points.
We should consider YouTube videos digital assets. They're investments, which make us money. His investments are yielding passive income.
Investing extra time and effort in your films can pay off.
2) How to Invest for Beginners — 5.2m Views: $87,200.08.
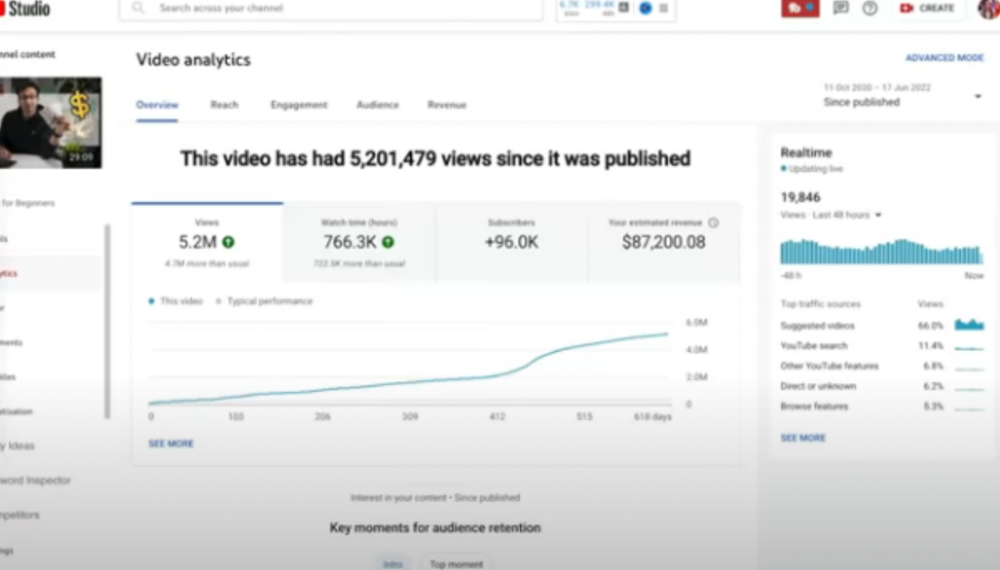
This video did poorly in the first several weeks after it was published; it was his tenth poorest performer. Don't worry about things you can't control. This applies to life, not just YouTube videos.
He stated we constantly have anxieties, fears, and concerns about things outside our control, but if we can find that line, life is easier and more pleasurable.
3) How to Build a Website in 2022— 866.3k views: $42,132.72.
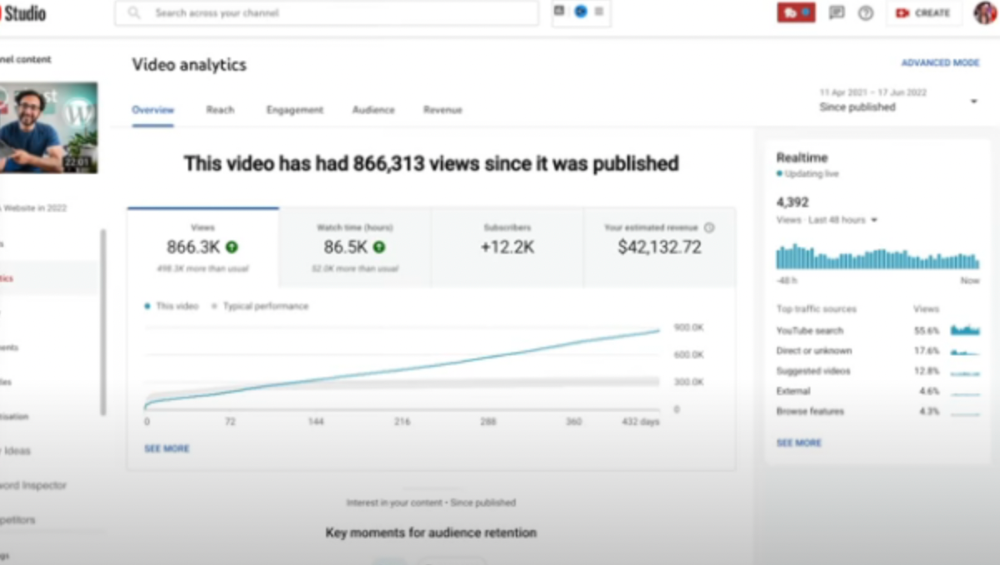
The RPM was $48.86 per thousand views, making it his highest-earning video. Squarespace, Wix, and other website builders are trying to put ads on it and competing against one other, so ad rates go up.
Because it was beyond his niche, Ali almost didn't make the video. He made the video because he wanted to help at least one person.
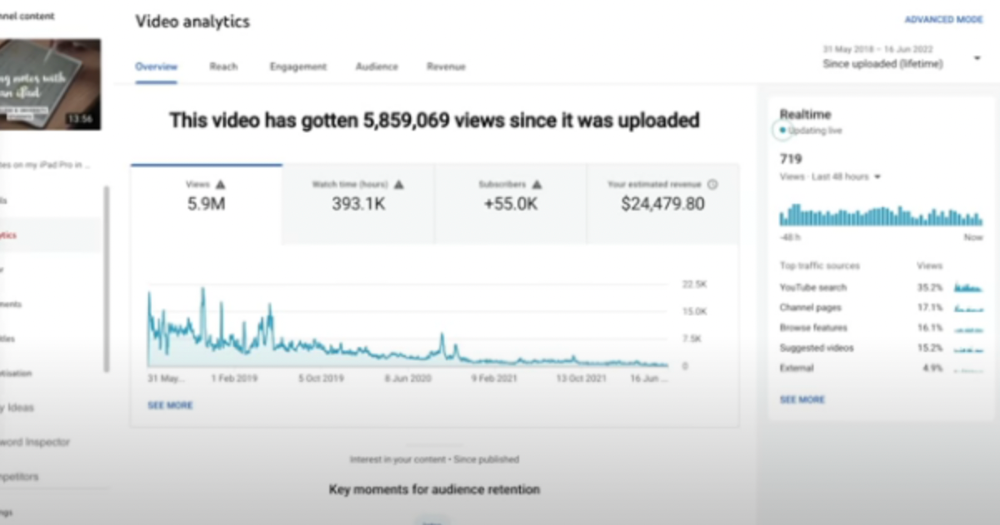
4) How I take notes on my iPad in medical school — 5.9m views: $24,479.80
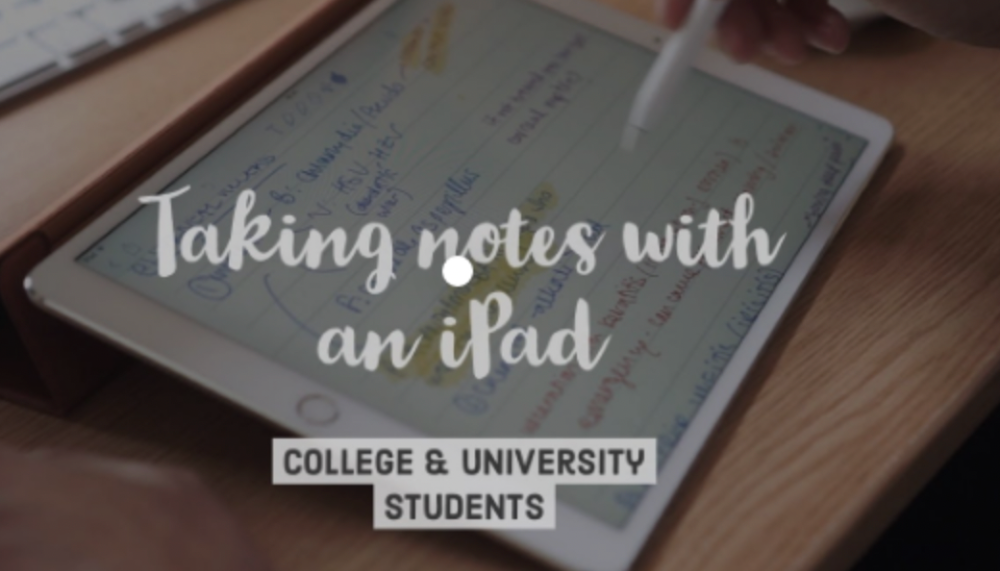
85th video. It's the video that affected Ali's YouTube channel and his life the most. The video's success wasn't certain.
5) How I Type Fast 156 Words Per Minute — 8.2M views: $25,143.17
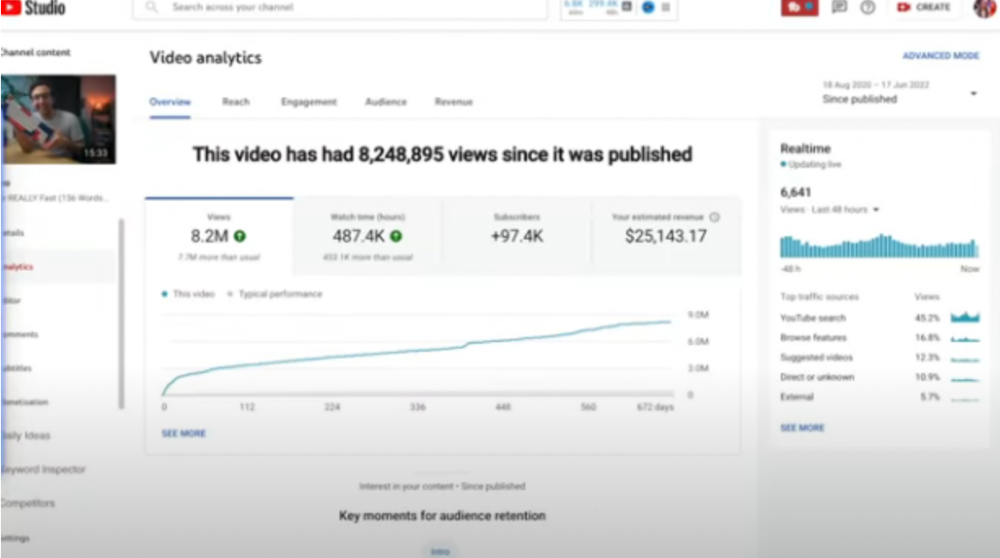
Ali didn't know this video would perform well; he made it because he can type fast and has been practicing for 10 years. So he made a video with his best advice.
How many views to different wealth levels?
It depends on geography, niche, and other monetization sources. To keep things simple, he would solely utilize AdSense.
How many views to generate money?
To generate money on Youtube, you need 1,000 subscribers and 4,000 hours of view time. How much work do you need to make pocket money?
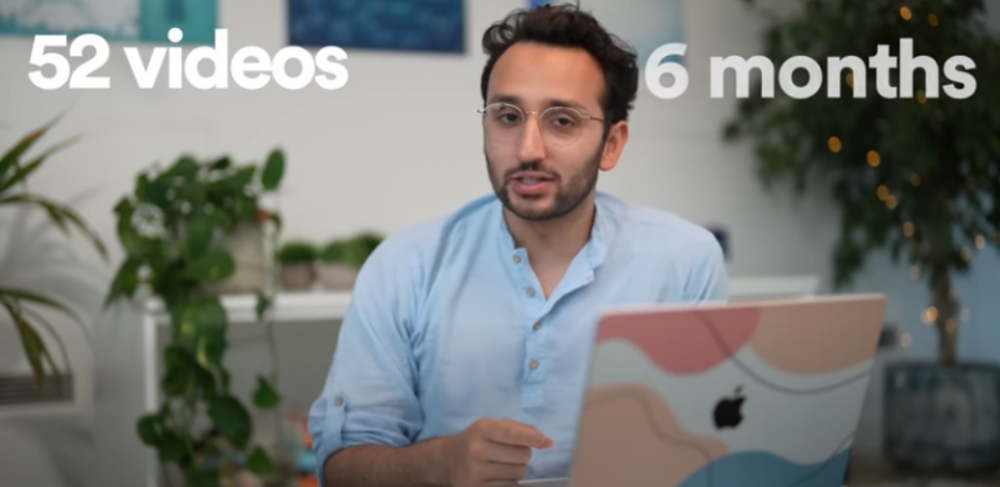
Ali's first 1,000 subscribers took 52 videos and 6 months. The typical channel with 1,000 subscribers contains 152 videos, according to Tubebuddy. It's time-consuming.
After monetizing, you'll need 15,000 views/month to make $5-$10/day.
How many views to go part-time?
Say you make $35,000/year at your day job. If you work 5 days/week, you make $7,000/year each day. If you want to drop down from 5 days to 4 days/week, you need to make an extra $7,000/year from YouTube, or $600/month.
What's the quit-your-job budget?
Silicon Valley Girl is in a highly successful niche targeting tech-focused folks in the west. When her channel had 500k views/month, she made roughly $3,000/month or $47,000/year, enough to quit your work.
Marina has another 1.5m subscriber channel in Russia, which has a lower rpm because fewer corporations advertise there than in the west. 2.3 million views/month is $4,000/month or $50,000/year, enough to quit your employment.
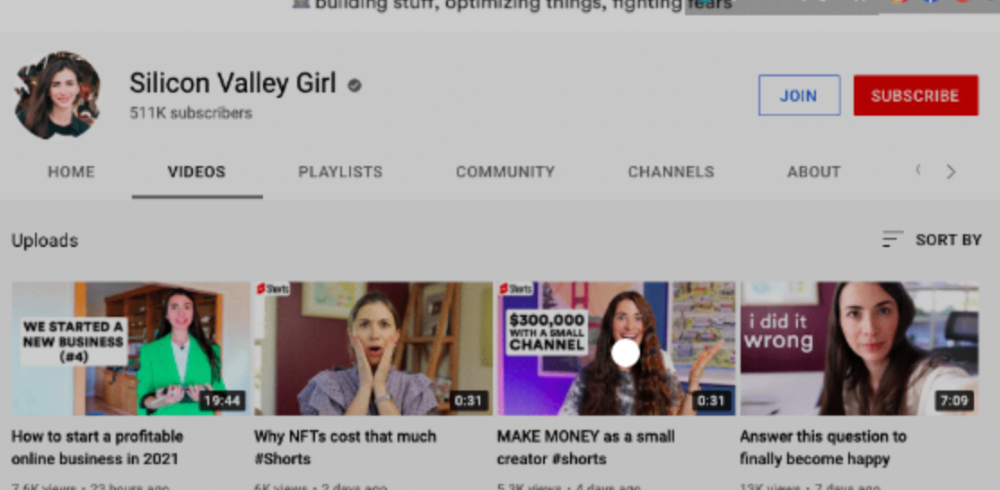
Marina is an intriguing example because she has three YouTube channels with the same skills, but one is 16x more profitable due to the niche she chose.
In Ali's case, he made 100+ videos when his channel was producing enough money to quit his job, roughly $4,000/month.
How many views make you rich?
Depending on how you define rich. Ali felt prosperous with over $100,000/year and 3–5m views/month.
Conclusion
YouTubers and artists don't treat their work like a company, which is a mistake. Businesses have been attempting to figure this out for decades, if not centuries.
We can learn from the business world how to monetize YouTube, Instagram, and Tiktok and make them into sustainable enterprises where we can hire people and delegate tasks.
Bonus
Watch Ali's video explaining all this:
This post is a summary. Read the full article here

Nikhil Vemu
3 years ago
7 Mac Apps That Are Exorbitantly Priced But Totally Worth It
Wish you more bang for your buck
By ‘Cost a Bomb’ I didn’t mean to exaggerate. It’s an idiom that means ‘To be very expensive’. In fact, no app on the planet costs a bomb lol.
So, to the point.
Chronicle
(Freemium. For Pro, $24.99 | Available on Setapp)
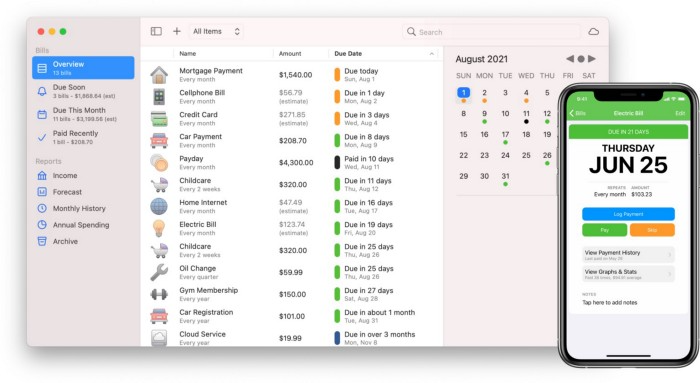
You probably have trouble keeping track of dozens of bills and subscriptions each month.
Try Chronicle.
Easy-to-use app
Add payment due dates and receive reminders,
Save payment documentation,
Analyze your spending by season, year, and month.
Observe expenditure trends and create new budgets.
Best of all, Chronicle features an integrated browser for fast payment and logging.
iOS and macOS sync.
SoundSource
($39 for lifetime)
Background Music, a free macOS program, was featured in #6 of this post last month.
It controls per-app volume, stereo balance, and audio over its max level.
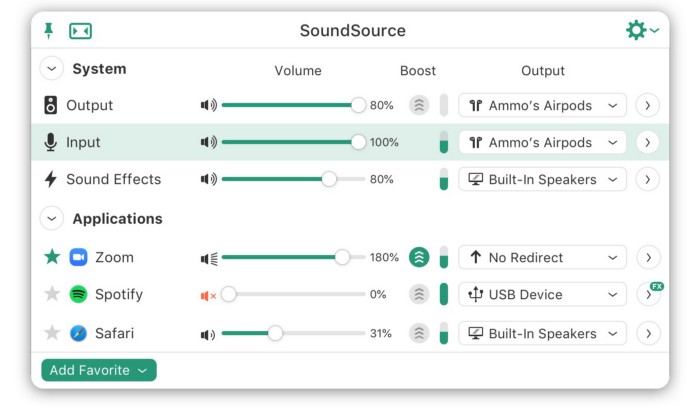
Background Music is fully supported. Additionally,
Connect various speakers to various apps (Wow! ),
change the audio sample rate for each app,
To facilitate access, add a floating SoundSource window.
Use its blocks in Shortcuts app,
On the menu bar, include meters for output/input devices and running programs.
PixelSnap
($39 for lifetime | Available on Setapp)
This software is heaven for UI designers.
It aids you.
quickly calculate screen distances (in pixels) ,
Drag an area around an object to determine its borders,
Measure the distances between the additional guides,
screenshots should be pixel-perfect.
What’s more.
You can
Adapt your tolerance for items with poor contrast and shadows.
Use your Touch Bar to perform important tasks, if you have one.
Mate Translation
($3.99 a month / $29.99 a year | Available on Setapp)
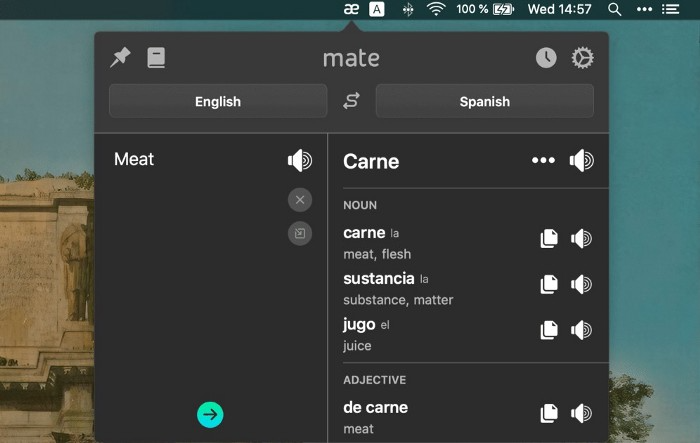
Mate Translate resembles a roided-up version of BarTranslate, which I wrote about in #1 of this piece last month.
If you translate often, utilize Mate Translate on macOS and Safari.
I'm really vocal about it.
It stays on the menu bar, and is accessible with a click or ⌥+shift+T hotkey.
It lets you
Translate in 103 different languages,
To translate text, double-click or right-click on it.
Totally translate websites. Additionally, Netflix subtitles,
Listen to their pronunciation to see how close it is to human.
iPhone and Mac sync Mate-ing history.
Swish
($16 for lifetime | Available on Setapp)
Swish is awesome!
Swipe, squeeze, tap, and hold movements organize chaotic desktop windows. Swish operates with mouse and trackpad.
Some gestures:
• Pinch Once: Close an app
• Pinch Twice: Quit an app
• Swipe down once: Minimise an app
• Pinch Out: Enter fullscreen mode
• Tap, Hold, & Swipe: Arrange apps in grids
 and many more...

After getting acquainted to the movements, your multitasking will improve.
Unite
($24.99 for lifetime | Available on Setapp)
It turns webapps into macOS apps. The end.
Unite's functionality is a million times better.
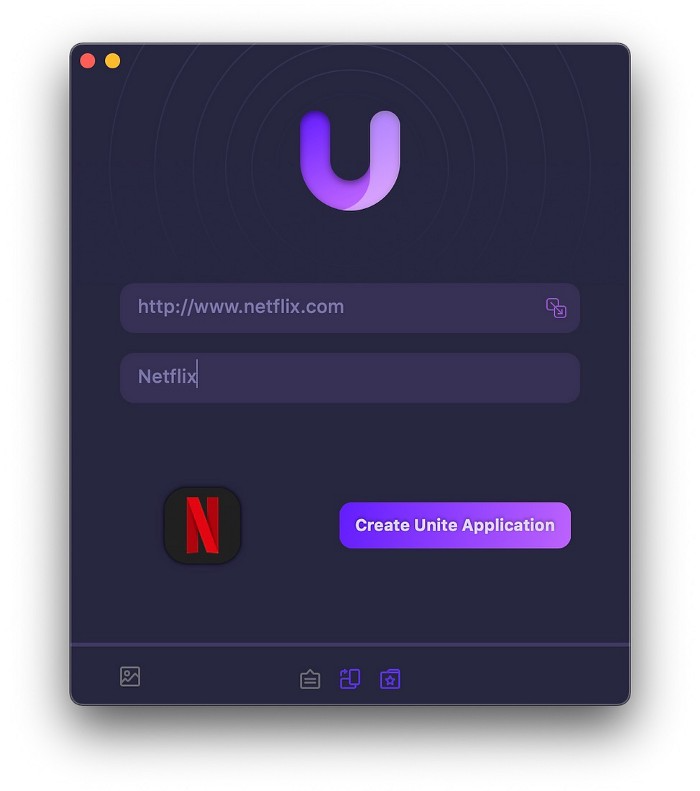
Provide extensive customization (incl. its icon, light and dark modes)
make menu bar applications,
Get badges for web notifications and automatically refresh websites,
Replace any dock icon in the window with it (Wow!) by selecting that portion of the window.
Use PiP (Picture-in-Picture) on video sites that support it.
Delete advertising,
Throughout macOS, use floating windows
and many more…
I feel $24.99 one-off for this tool is a great deal, considering all these features. What do you think?
CleanShot X
(Basic: $29 one-off. Pro: $8/month | Available on Setapp)
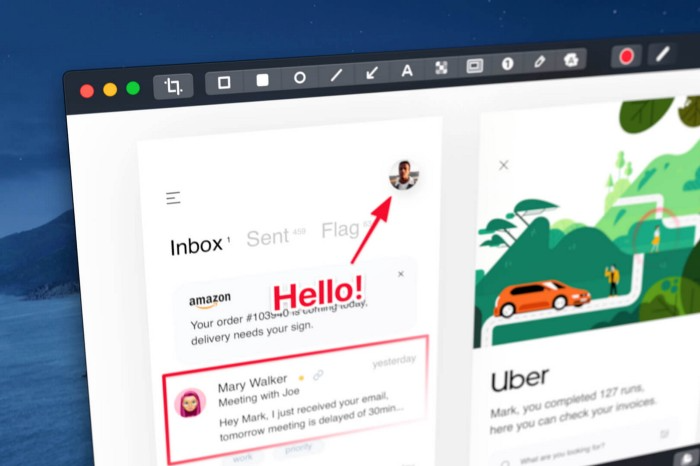
CleanShot X can achieve things the macOS screenshot tool cannot. Complete screenshot toolkit.
CleanShot X, like Pixel Snap 2 (#3), is fantastic.
Allows
Scroll to capture a long page,
screen recording,
With webcam on,
• With mic and system audio,
• Highlighting mouse clicks and hotkeys.
Maintain floating screenshots for reference
While capturing, conceal desktop icons and notifications.
Recognize text in screenshots (OCR),
You may upload and share screenshots using the built-in cloud.
These are just 6 in 50+ features, and you’re already saying Wow!