


More on Entrepreneurship/Creators

Owolabi Judah
3 years ago
How much did YouTube pay for 10 million views?
Ali's $1,054,053.74 YouTube Adsense haul.
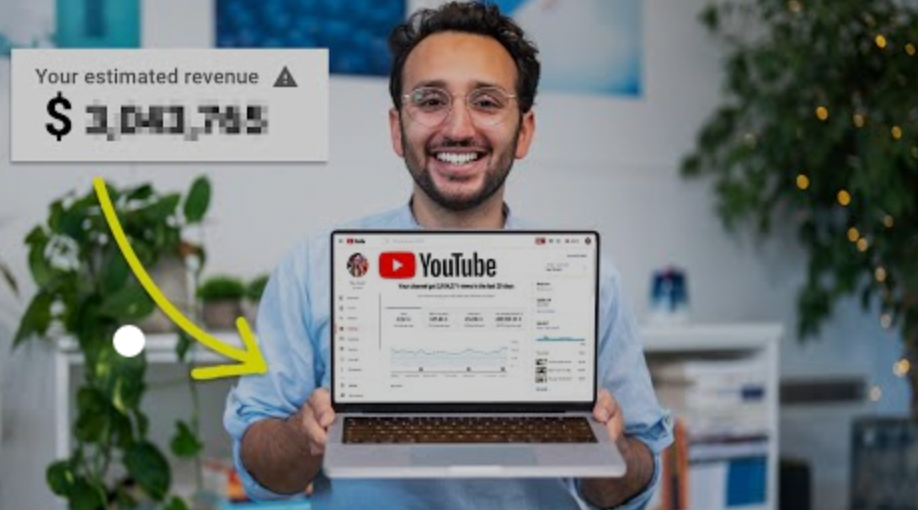
YouTuber, entrepreneur, and former doctor Ali Abdaal. He began filming productivity and financial videos in 2017. Ali Abdaal has 3 million YouTube subscribers and has crossed $1 million in AdSense revenue. Crazy, no?
Ali will share the revenue of his top 5 youtube videos, things he's learned that you can apply to your side hustle, and how many views it takes to make a livelihood off youtube.
First, "The Long Game."
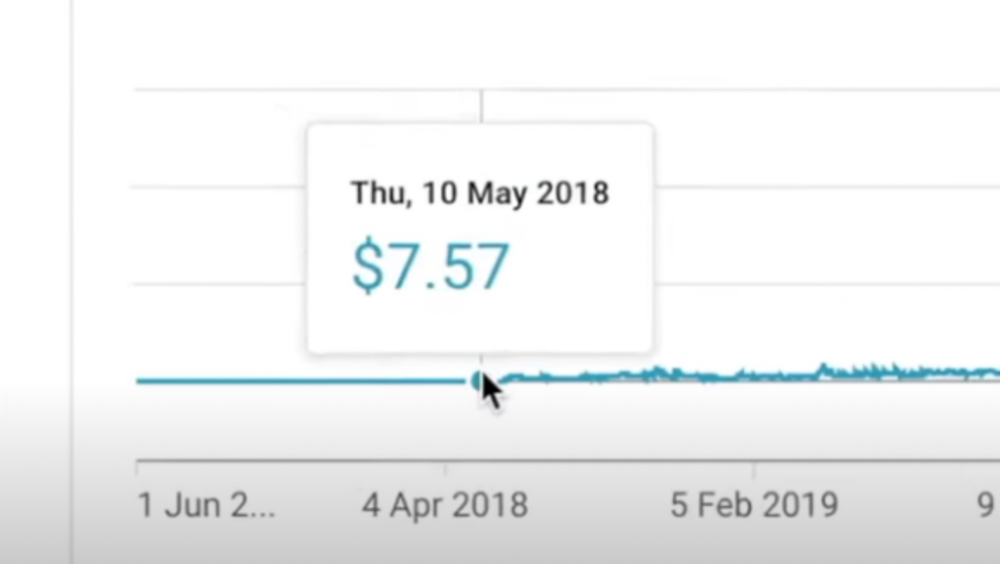
All good things take time to bear fruit. Compounding improves everything. Long-term work yields better returns. Ali made his first dollar after nine months and 85 videos.
Second, "One piece of content can transform your life, but you never know which one."
Had he abandoned YouTube at 84 videos without making any money, he wouldn't have filmed the 85th video that altered everything.
Third Lesson: Your Industry Choice Can Multiply.
The industry or niche you target as a business owner or side hustler can have a major impact on how much money you make.
Here are the top 5 videos.
1) 9.8m views: $191,258.16 for 9 passive income ideas
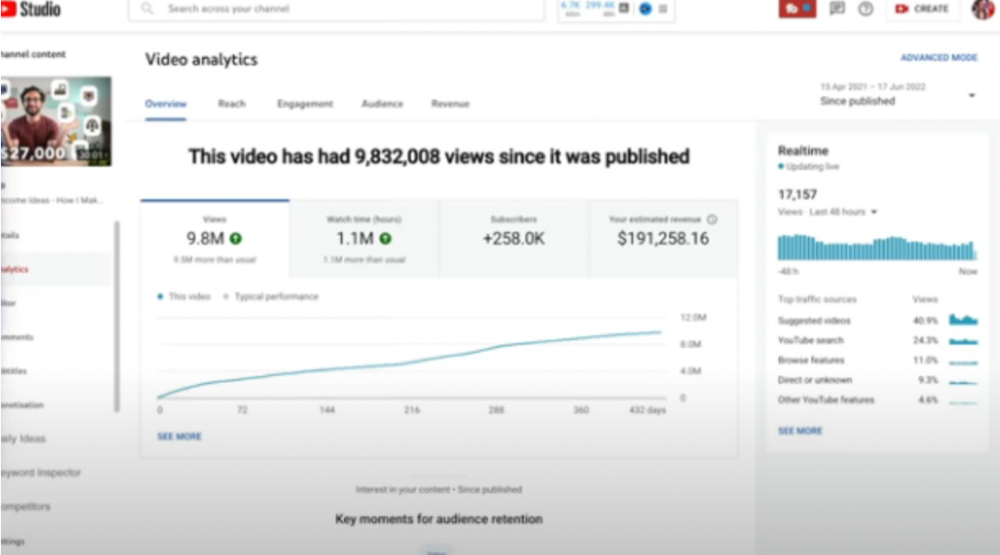
Ali made 2 points.
We should consider YouTube videos digital assets. They're investments, which make us money. His investments are yielding passive income.
Investing extra time and effort in your films can pay off.
2) How to Invest for Beginners — 5.2m Views: $87,200.08.
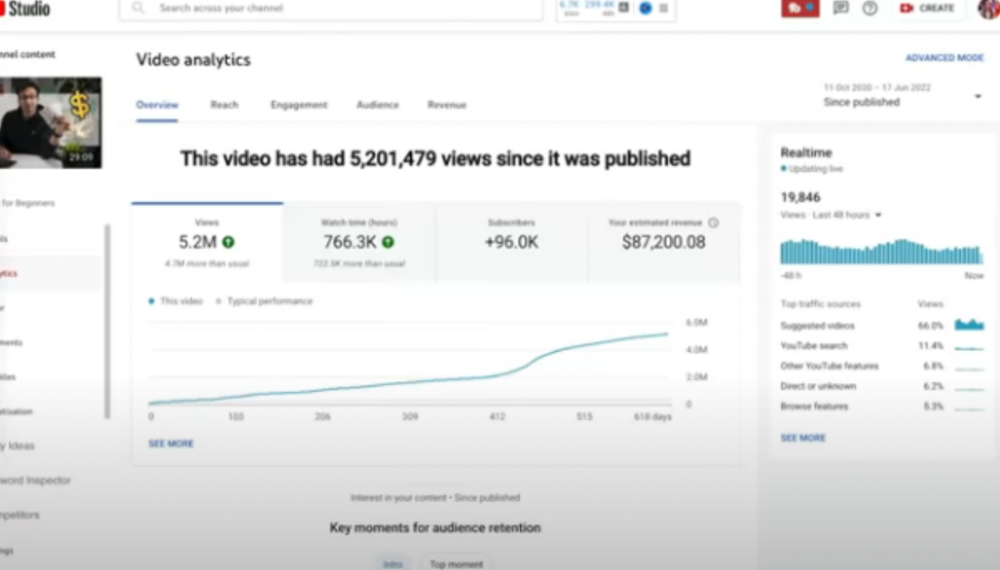
This video did poorly in the first several weeks after it was published; it was his tenth poorest performer. Don't worry about things you can't control. This applies to life, not just YouTube videos.
He stated we constantly have anxieties, fears, and concerns about things outside our control, but if we can find that line, life is easier and more pleasurable.
3) How to Build a Website in 2022— 866.3k views: $42,132.72.
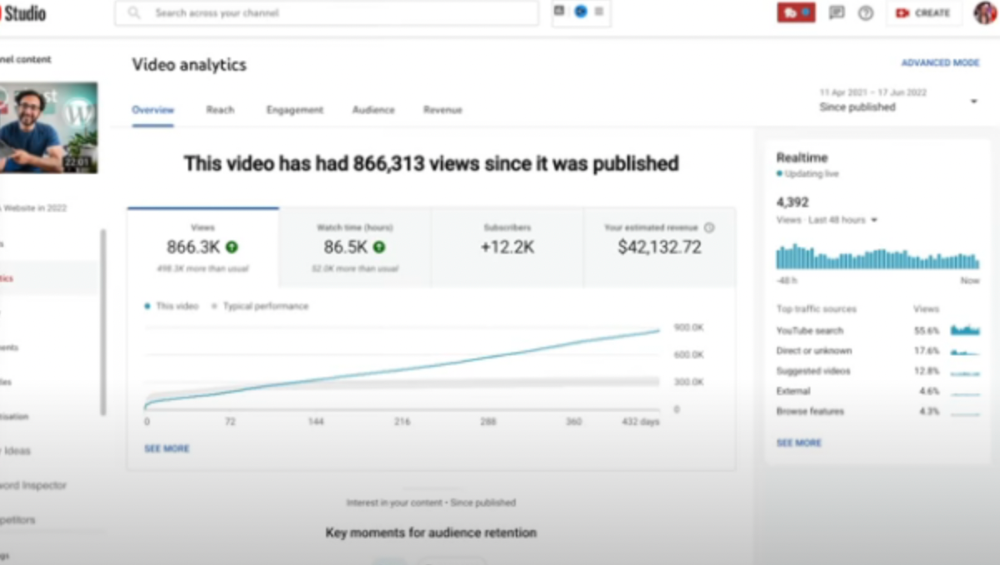
The RPM was $48.86 per thousand views, making it his highest-earning video. Squarespace, Wix, and other website builders are trying to put ads on it and competing against one other, so ad rates go up.
Because it was beyond his niche, Ali almost didn't make the video. He made the video because he wanted to help at least one person.
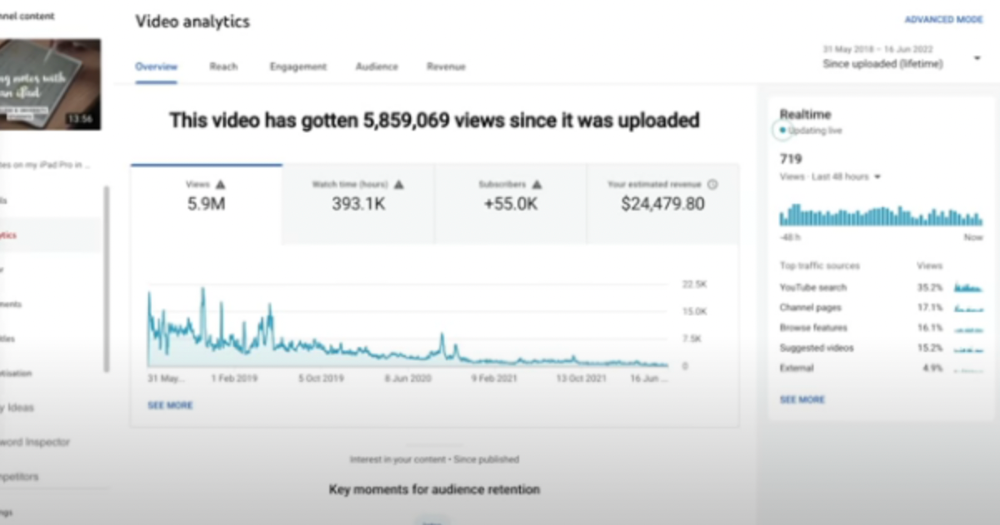
4) How I take notes on my iPad in medical school — 5.9m views: $24,479.80
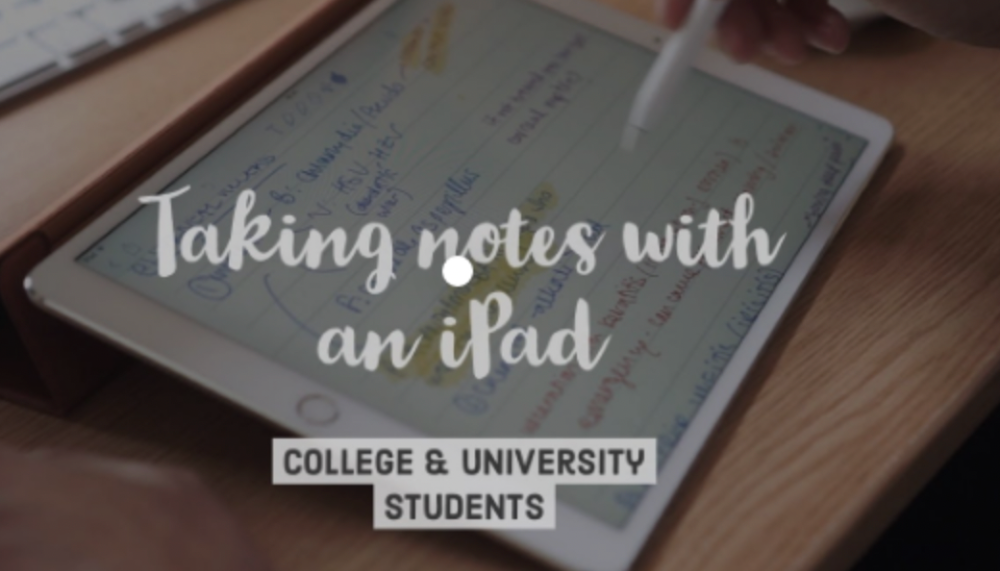
85th video. It's the video that affected Ali's YouTube channel and his life the most. The video's success wasn't certain.
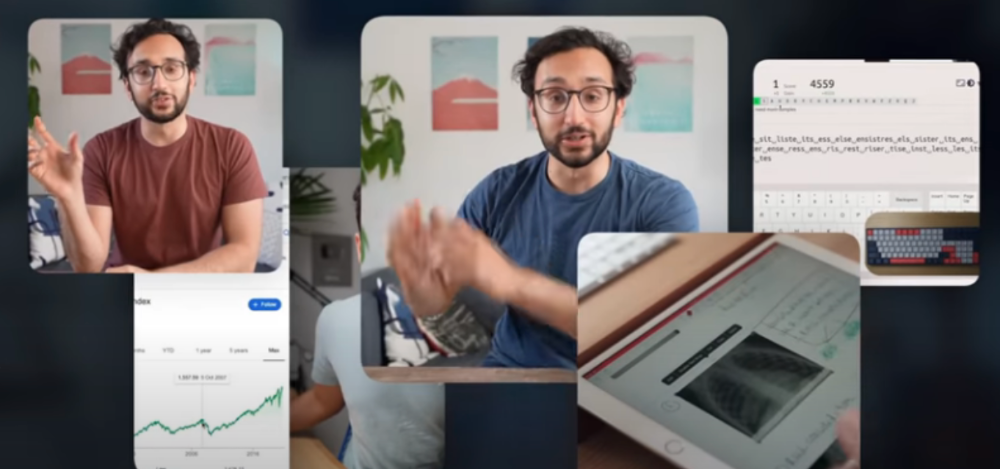
5) How I Type Fast 156 Words Per Minute — 8.2M views: $25,143.17
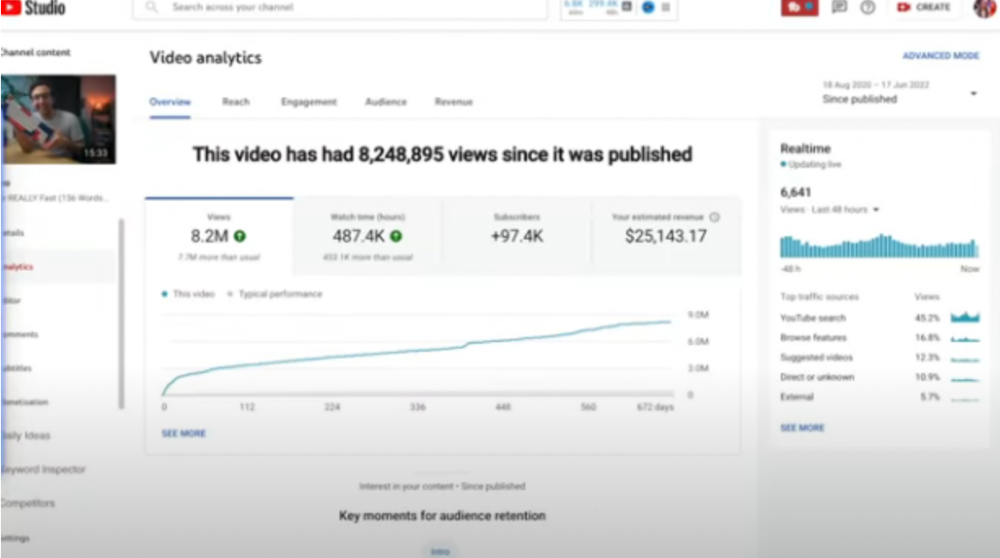
Ali didn't know this video would perform well; he made it because he can type fast and has been practicing for 10 years. So he made a video with his best advice.
How many views to different wealth levels?
It depends on geography, niche, and other monetization sources. To keep things simple, he would solely utilize AdSense.
How many views to generate money?
To generate money on Youtube, you need 1,000 subscribers and 4,000 hours of view time. How much work do you need to make pocket money?
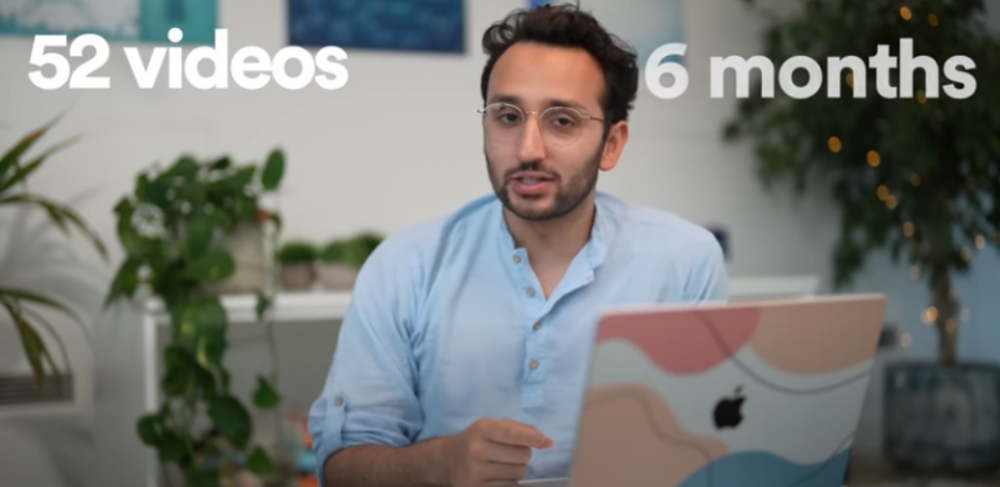
Ali's first 1,000 subscribers took 52 videos and 6 months. The typical channel with 1,000 subscribers contains 152 videos, according to Tubebuddy. It's time-consuming.
After monetizing, you'll need 15,000 views/month to make $5-$10/day.
How many views to go part-time?
Say you make $35,000/year at your day job. If you work 5 days/week, you make $7,000/year each day. If you want to drop down from 5 days to 4 days/week, you need to make an extra $7,000/year from YouTube, or $600/month.
What's the quit-your-job budget?
Silicon Valley Girl is in a highly successful niche targeting tech-focused folks in the west. When her channel had 500k views/month, she made roughly $3,000/month or $47,000/year, enough to quit your work.
Marina has another 1.5m subscriber channel in Russia, which has a lower rpm because fewer corporations advertise there than in the west. 2.3 million views/month is $4,000/month or $50,000/year, enough to quit your employment.
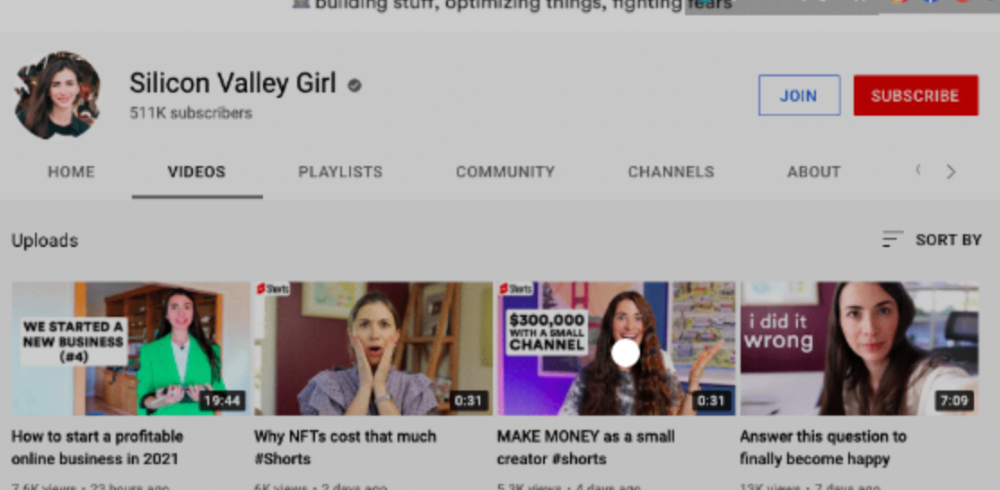
Marina is an intriguing example because she has three YouTube channels with the same skills, but one is 16x more profitable due to the niche she chose.
In Ali's case, he made 100+ videos when his channel was producing enough money to quit his job, roughly $4,000/month.
How many views make you rich?
Depending on how you define rich. Ali felt prosperous with over $100,000/year and 3–5m views/month.
Conclusion
YouTubers and artists don't treat their work like a company, which is a mistake. Businesses have been attempting to figure this out for decades, if not centuries.
We can learn from the business world how to monetize YouTube, Instagram, and Tiktok and make them into sustainable enterprises where we can hire people and delegate tasks.
Bonus
Watch Ali's video explaining all this:
This post is a summary. Read the full article here

Bernard Bado
3 years ago
Build This Before Someone Else Does!

Do you want to build and launch your own software company? To do this, all you need is a product that solves a problem.
Coming up with profitable ideas is not that easy. But you’re in luck because you got me!
I’ll give you the idea for free. All you need to do is execute it properly.
If you’re ready, let’s jump right into it! Starting with the problem.
Problem
Youtube has many creators. Every day, they think of new ways to entertain or inform us.
They work hard to make videos. Many of their efforts go to waste. They limit their revenue and reach.
Solution
Content repurposing solves this problem.
One video can become several TikToks. Creating YouTube videos from a podcast episode.
Or, one video might become a blog entry.
By turning videos into blog entries, Youtubers may develop evergreen SEO content, attract a new audience, and reach a non-YouTube audience.
Many YouTube creators want this easy feature.
Let's build it!
Implementation
We identified the problem, and we have a solution. All that’s left to do is see how it can be done.
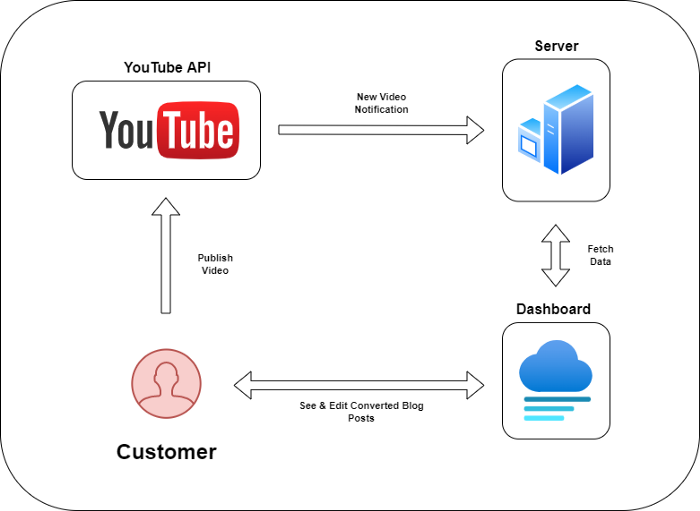
Monitoring new video uploads
First, watch when a friend uploads a new video. Everything should happen automatically without user input.
YouTube Webhooks make this easy. Our server listens for YouTube Webhook notifications.
After publishing a new video, we create a conversion job.
Creating a Blog Post from a Video
Next, turn a video into a blog article.
To convert, we must extract the video's audio (which can be achieved by using FFmpeg on the server).
Once we have the audio channel, we can use speech-to-text.
Services can accomplish this easily.
Speech-to-text on Google
Google Translate
Deepgram
Deepgram's affordability and integration make it my pick.
After conversion, the blog post needs formatting, error checking, and proofreading.
After this, a new blog post will appear in our web app's dashboard.
Completing a blog post
After conversion, users must examine and amend their blog posts.
Our application dashboard would handle all of this. It's a dashboard-style software where users can:
Link their Youtube account
Check out the converted videos in the future.
View the conversions that are ongoing.
Edit and format converted blog articles.
It's a web-based app.
It doesn't matter how it's made but I'd choose Next.js.
Next.js is a React front-end standard. Vercel serverless functions could conduct the conversions.
This would let me host the software for free and reduce server expenditures.
Taking It One Step Further
SaaS in a nutshell. Future improvements include integrating with WordPress or Ghost.
Our app users could then publish blog posts. Streamlining the procedure.
MVPs don't need this functionality.
Final Thoughts
Repurposing content helps you post more often, reach more people, and develop faster.
Many agencies charge a fortune for this service. Handmade means pricey.
Content creators will go crazy if you automate and cheaply solve this problem.
Just execute this idea!

Aaron Dinin, PhD
3 years ago
There Are Two Types of Entrepreneurs in the World Make sure you are aware of your type!
Know why it's important.

The entrepreneur I was meeting with said, "I should be doing crypto, or maybe AI? Aren't those the hot spots? I should look there for a startup idea.”
I shook my head. Yes, they're exciting, but that doesn't mean they're best for you and your business.
“There are different types of entrepreneurs?” he asked.
I said "obviously." Two types, actually. Knowing what type of entrepreneur you are helps you build the right startup.
The two types of businesspeople
The best way for me to describe the two types of entrepreneurs is to start by telling you exactly the kinds of entrepreneurial opportunities I never get excited about: future opportunities.
In the early 1990s, my older brother showed me the World Wide Web and urged me to use it. Unimpressed, I returned to my Super Nintendo.
My roommate tried to get me to join Facebook as a senior in college. I remember thinking, This is dumb. Who'll use it?
In 2011, my best friend tried to convince me to buy bitcoin and I laughed.
Heck, a couple of years ago I had to buy a new car, and I never even considered buying something that didn’t require fossilized dinosaur bones.
I'm no visionary. I don't anticipate the future. I focus on the present.
This tendency makes me a problem-solving entrepreneur. I identify entrepreneurial opportunities by spotting flaws and/or inefficiencies in the world and devising solutions.
There are other ways to find business opportunities. Visionary entrepreneurs also exist. I don't mean visionary in the hyperbolic sense that implies world-changing impact. I mean visionary as an entrepreneur who identifies future technological shifts that will change how people work and live and create new markets.
Problem-solving and visionary entrepreneurs are equally good. But the two approaches to building companies are very different. Knowing the type of entrepreneur you are will help you build a startup that fits your worldview.
What is the distinction?
Let's use some simple hypotheticals to compare problem-solving and visionary entrepreneurship.
Imagine a city office building without nearby restaurants. Those office workers love to eat. Sometimes they'd rather eat out than pack a lunch. As an entrepreneur, you can solve the lack of nearby restaurants. You'd open a restaurant near that office, say a pizza parlor, and get customers because you solved the lack of nearby restaurants. Problem-solving entrepreneurship.
Imagine a new office building in a developing area with no residents or workers. In this scenario, a large office building is coming. The workers will need to eat then. As a visionary entrepreneur, you're excited about the new market and decide to open a pizzeria near the construction to meet demand.
Both possibilities involve the same product. You opened a pizzeria. How you launched that pizza restaurant and what will affect its success are different.
Why is the distinction important?
Let's say you opened a pizzeria near an office. You'll probably get customers. Because people are nearby and demand isn't being met, someone from a nearby building will stop in within the first few days of your pizzeria's grand opening. This makes solving the problem relatively risk-free. You'll get customers unless you're a fool.
The market you're targeting existed before you entered it, so you're not guaranteed success. This means people in that market solved the lack of nearby restaurants. Those office workers are used to bringing their own lunches. Why should your restaurant change their habits? Even when they eat out, they're used to traveling far. They've likely developed pizza preferences.
To be successful with your problem-solving startup, you must convince consumers to change their behavior, which is difficult.
Unlike opening a pizza restaurant near a construction site. Once the building opens, workers won't have many preferences or standardized food-getting practices. Your pizza restaurant can become the incumbent quickly. You'll be the first restaurant in the area, so you'll gain a devoted following that makes your food a routine.
Great, right? It's easier than changing people's behavior. The benefit comes with a risk. Opening a pizza restaurant near a construction site increases future risk. What if builders run out of money? No one moves in? What if the building's occupants are the National Association of Pizza Haters? Then you've opened a pizza restaurant next to pizza haters.
Which kind of businessperson are you?
This isn't to say one type of entrepreneur is better than another. Each type of entrepreneurship requires different skills.
As my simple examples show, a problem-solving entrepreneur must operate in markets with established behaviors and habits. To be successful, you must be able to teach a market a new way of doing things.
Conversely, the challenge of being a visionary entrepreneur is that you have to be good at predicting the future and getting in front of that future before other people.
Both are difficult in different ways. So, smart entrepreneurs don't just chase opportunities. Smart entrepreneurs pursue opportunities that match their skill sets.
You might also like

Nir Zicherman
3 years ago
The Great Organizational Conundrum
Only two of the following three options can be achieved: consistency, availability, and partition tolerance

Someone told me that growing from 30 to 60 is the biggest adjustment for a team or business.
I remember thinking, That's random. Each company is unique. I've seen teams of all types confront the same issues during development periods. With new enterprises starting every year, we should be better at navigating growing difficulties.
As a team grows, its processes and systems break down, requiring reorganization or declining results. Why always? Why isn't there a perfect scaling model? Why hasn't that been found?
The Three Things Productive Organizations Must Have
Any company should be efficient and productive. Three items are needed:
First, it must verify that no two team members have conflicting information about the roadmap, strategy, or any input that could affect execution. Teamwork is required.
Second, it must ensure that everyone can receive the information they need from everyone else quickly, especially as teams become more specialized (an inevitability in a developing organization). It requires everyone's accessibility.
Third, it must ensure that the organization can operate efficiently even if a piece is unavailable. It's partition-tolerant.
From my experience with the many teams I've been on, invested in, or advised, achieving all three is nearly impossible. Why a perfect organization model cannot exist is clear after analysis.
The CAP Theorem: What is it?
Eric Brewer of Berkeley discovered the CAP Theorem, which argues that a distributed data storage should have three benefits. One can only have two at once.
The three benefits are consistency, availability, and partition tolerance, which implies that even if part of the system is offline, the remainder continues to work.
This notion is usually applied to computer science, but I've realized it's also true for human organizations. In a post-COVID world, many organizations are hiring non-co-located staff as they grow. CAP Theorem is more important than ever. Growing teams sometimes think they can develop ways to bypass this law, dooming themselves to a less-than-optimal team dynamic. They should adopt CAP to maximize productivity.
Path 1: Consistency and availability equal no tolerance for partitions
Let's imagine you want your team to always be in sync (i.e., for someone to be the source of truth for the latest information) and to be able to share information with each other. Only division into domains will do.
Numerous developing organizations do this, especially after the early stage (say, 30 people) when everyone may wear many hats and be aware of all the moving elements. After a certain point, it's tougher to keep generalists aligned than to divide them into specialized tasks.
In a specialized, segmented team, leaders optimize consistency and availability (i.e. every function is up-to-speed on the latest strategy, no one is out of sync, and everyone is able to unblock and inform everyone else).
Partition tolerance suffers. If any component of the organization breaks down (someone goes on vacation, quits, underperforms, or Gmail or Slack goes down), productivity stops. There's no way to give the team stability, availability, and smooth operation during a hiccup.
Path 2: Partition Tolerance and Availability = No Consistency
Some businesses avoid relying too heavily on any one person or sub-team by maximizing availability and partition tolerance (the organization continues to function as a whole even if particular components fail). Only redundancy can do that. Instead of specializing each member, the team spreads expertise so people can work in parallel. I switched from Path 1 to Path 2 because I realized too much reliance on one person is risky.
What happens after redundancy? Unreliable. The more people may run independently and in parallel, the less anyone can be the truth. Lack of alignment or updated information can lead to people executing slightly different strategies. So, resources are squandered on the wrong work.
Path 3: Partition and Consistency "Tolerance" equates to "absence"
The third, least-used path stresses partition tolerance and consistency (meaning answers are always correct and up-to-date). In this organizational style, it's most critical to maintain the system operating and keep everyone aligned. No one is allowed to read anything without an assurance that it's up-to-date (i.e. there’s no availability).
Always short-lived. In my experience, a business that prioritizes quality and scalability over speedy information transmission can get bogged down in heavy processes that hinder production. Large-scale, this is unsustainable.
Accepting CAP
When two puzzle pieces fit, the third won't. I've watched developing teams try to tackle these difficulties, only to find, as their ancestors did, that they can never be entirely solved. Idealized solutions fail in reality, causing lost effort, confusion, and lower production.
As teams develop and change, they should embrace CAP, acknowledge there is a limit to productivity in a scaling business, and choose the best two-out-of-three path.

Architectural Digest
3 years ago
Take a look at The One, a Los Angeles estate with a whopping 105,000 square feet of living area.
The interiors of the 105,000-square-foot property, which sits on a five-acre parcel in the wealthy Los Angeles suburb of Bel Air and is suitably titled The One, have been a well guarded secret. We got an intimate look inside this world-record-breaking property, as well as the creative and aesthetic geniuses behind it.
The estate appears to float above the city, surrounded on three sides by a moat and a 400-foot-long running track. Completed over eight years—and requiring 600 workers to build—the home was designed by architect Paul McClean and interior designer Kathryn Rotondi, who were enlisted by owner and developer Nile Niami to help it live up to its standard.
"This endeavor seemed both exhilarating and daunting," McClean says. However, the home's remarkable location and McClean's long-standing relationship with Niami persuaded him to "build something unique and extraordinary" rather than just take on the job.
And McClean has more than delivered.
The home's main entrance leads to a variety of meeting places with magnificent 360-degree views of the Pacific Ocean, downtown Los Angeles, and the San Gabriel Mountains, thanks to its 26-foot-high ceilings. There is water at the entrance area, as well as a sculpture and a bridge. "We often employ water in our design approach because it provides a sensory change that helps you acclimatize to your environment," McClean explains.
Niami wanted a neutral palette that would enable the environment and vistas to shine, so she used black, white, and gray throughout the house.
McClean has combined the home's inside with outside "to create that quintessential L.A. lifestyle but on a larger scale," he says, drawing influence from the local environment and history of Los Angeles modernism. "We separated the entertaining spaces from the living portions to make the house feel more livable. The former are on the lowest level, which serves as a plinth for the rest of the house and minimizes its apparent mass."
The home's statistics, in addition to its eye-catching style, are equally impressive. There are 42 bathrooms, 21 bedrooms, a 5,500-square-foot master suite, a 30-car garage gallery with two car-display turntables, a four-lane bowling alley, a spa level, a 30-seat movie theater, a "philanthropy wing (with a capacity of 200) for charity galas, a 10,000-square-foot sky deck, and five swimming pools.
Rotondi, the creator of KFR Design, collaborated with Niami on the interior design to create different spaces that flow into one another despite the house's grandeur. "I was especially driven to 'wow factor' components in the hospitality business," Rotondi says, citing top luxury hotel brands such as Aman, Bulgari, and Baccarat as sources of inspiration. Meanwhile, the home's color scheme, soft textures, and lighting are a nod to Niami and McClean's favorite Tom Ford boutique on Rodeo Drive.
The house boasts an extraordinary collection of art, including a butterfly work by Stephen Wilson on the lower level and a Niclas Castello bespoke panel in black and silver in the office, thanks to a cooperation between Creative Art Partners and Art Angels. There is also a sizable collection of bespoke furniture pieces from byShowroom.
A house of this size will never be erected again in Los Angeles, thanks to recently enacted city rules, so The One will truly be one of a kind. "For all of us, this project has been such a long and instructive trip," McClean says. "It was exciting to develop and approached with excitement, but I don't think any of us knew how much effort and time it would take to finish the project."

obimy.app
3 years ago
How TikTok helped us grow to 6 million users
This resulted to obimy's new audience.
Hi! obimy's official account. Here, we'll teach app developers and marketers. In 2022, our downloads increased dramatically, so we'll share what we learned.
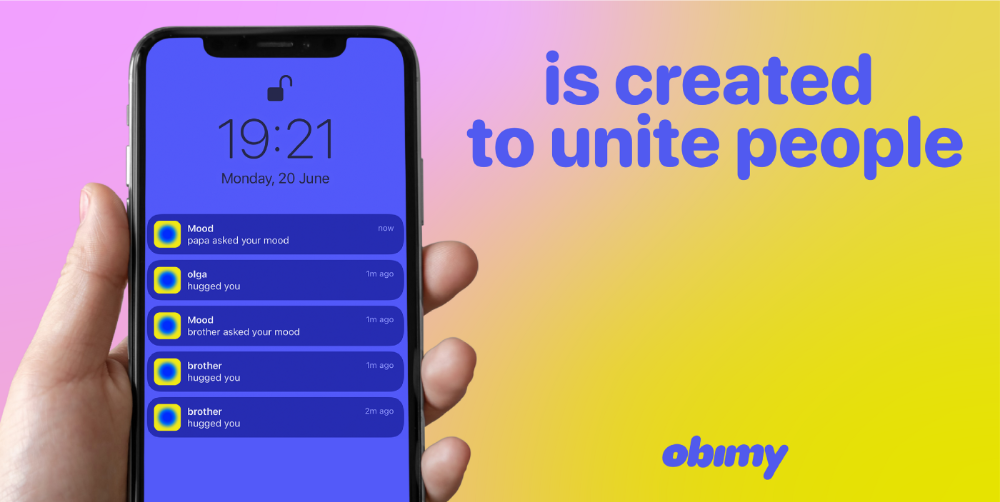
obimy is what we call a ‘senseger’. It's a new method to communicate digitally. Instead of text, obimy users connect through senses and moods. Feeling playful? Flirt with your partner, pat a pal, or dump water on a classmate. Each feeling is an interactive animation with vibration. It's a wordless app. App Store and Google Play have obimy.
We had 20,000 users in 2022. Two to five thousand of them opened the app monthly. Our DAU metric was 500.
We have 6 million users after 6 months. 500,000 individuals use obimy daily. obimy was the top lifestyle app this week in the U.S.
And TikTok helped.
TikTok fuels obimys' growth. It's why our app exploded. How and what did we learn? Our Head of Marketing, Anastasia Avramenko, knows.
our actions prior to TikTok
We wanted to achieve product-market fit through organic expansion. Quora, Reddit, Facebook Groups, Facebook Ads, Google Ads, Apple Search Ads, and social media activity were tested. Nothing worked. Our CPI was sometimes $4, so unit economics didn't work.
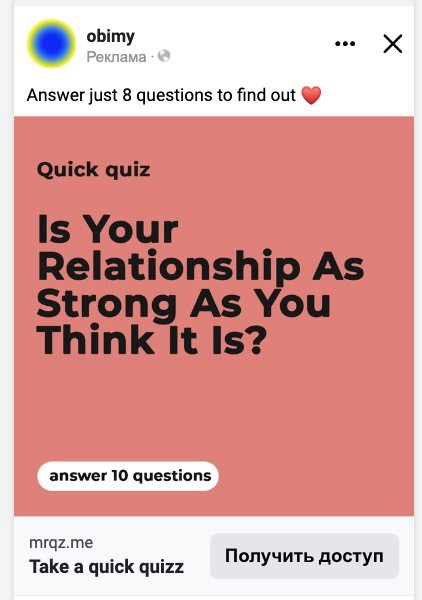
We studied our markets and made audience hypotheses. We promoted our goods and studied our audience through social media quizzes. Our target demographic was Americans in long-distance relationships. I designed quizzes like Test the Strength of Your Relationship to better understand the user base. After each quiz, we encouraged users to download the app to enhance their connection and bridge the distance.
We got 1,000 responses for $50. This helped us comprehend the audience's grief and coping strategies (aka our rivals). I based action items on answers given. If you can't embrace a loved one, use obimy.
We also tried Facebook and Google ads. From the start, we knew it wouldn't work.
We were desperate to discover a free way to get more users.
Our journey to TikTok
TikTok is a great venue for emerging creators. It also helped reach people. Before obimy, my TikTok videos garnered 12 million views without sponsored promotion.
We had to act. TikTok was required.
I wasn't a TikTok user before obimy. Initially, I uploaded promotional content. Call-to-actions appear strange next to dancing challenges and my money don't jiggle jiggle. I learned TikTok. Watch TikTok for an hour was on my to-do list. What a dream job!
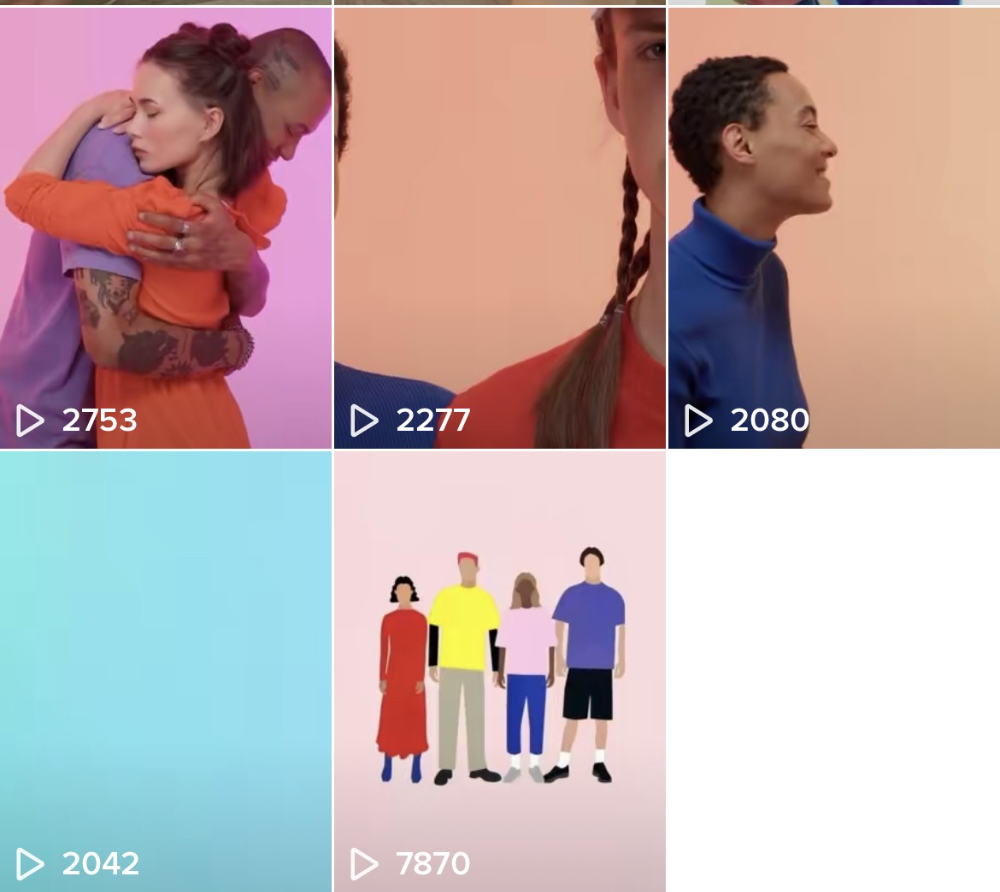
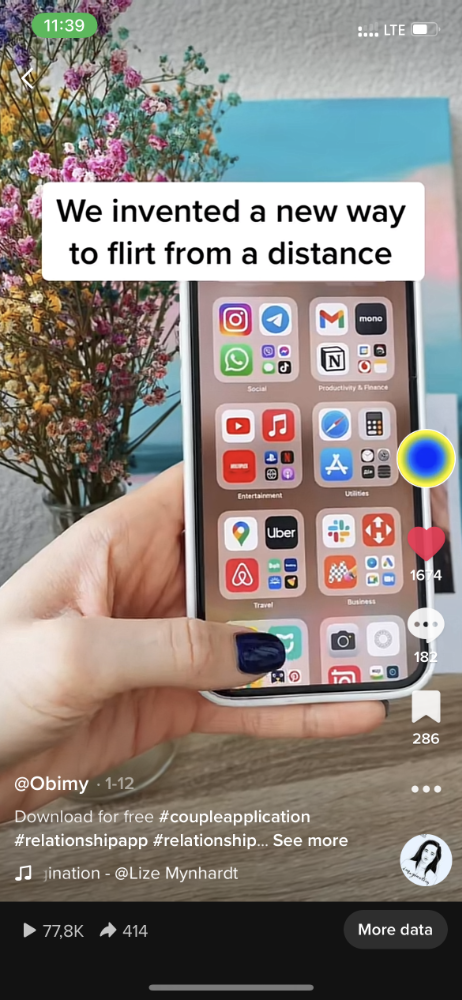
Our most popular movies presented the app alongside text outlining what it does. We started promoting them in Europe and the U.S. and got a 16% CTR and $1 CPI, an improvement over our previous efforts.
Somehow, we were expanding. So we came up with new hypotheses, calls to action, and content.
Four months passed, yet we saw no organic growth.
Russia attacked Ukraine.
Our app aimed to be helpful. For now, we're focusing on our Ukrainian audience. I posted sloppy TikToks illustrating how obimy can help during shelling or air raids.
In two hours, Kostia sent me our visitor count. Our servers crashed.
Initially, we had several thousand daily users. Over 200,000 users joined obimy in a week. They posted obimy videos on TikTok, drawing additional users. We've also resumed U.S. video promotion.
We gained 2,000,000 new members with less than $100 in ads, primarily in the U.S. and U.K.
TikTok helped.
The figures
We were confident we'd chosen the ideal tool for organic growth.
Over 45 million people have viewed our own videos plus a ton of user-generated content with the hashtag #obimy.
About 375 thousand people have liked all of our individual videos.
The number of downloads and the virality of videos are directly correlated.
Where are we now?
TikTok fuels our organic growth. We post 56 videos every week and pay to promote viral content.
We use UGC and influencers. We worked with Universal Music Italy on Eurovision. They offered to promote us through their million-follower TikTok influencers. We thought their followers would improve our audience, but it didn't matter. Integration didn't help us. Users that share obimy videos with their followers can reach several million views, which affects our download rate.
After the dust settled, we determined our key audience was 13-18-year-olds. They want to express themselves, but it's sometimes difficult. We're searching for methods to better engage with our users. We opened a Discord server to discuss anime and video games and gather app and content feedback.
TikTok helps us test product updates and hypotheses. Example: I once thought we might raise MAU by prompting users to add strangers as friends. Instead of asking our team to construct it, I made a TikTok urging users to share invite URLs. Users share links under every video we upload, embracing people worldwide.
Key lessons
Don't direct-sell. TikTok isn't for Instagram, Facebook, or YouTube promo videos. Conventional advertisements don't fit. Most users will swipe up and watch humorous doggos.
More product videos are better. Finally. So what?
Encourage interaction. Tagging friends in comments or making videos with the app promotes it more than any marketing spend.
Be odd and risqué. A user mistakenly sent a French kiss to their mom in one of our most popular videos.
TikTok helps test hypotheses and build your user base. It also helps develop apps. In our upcoming blog, we'll guide you through obimy's design revisions based on TikTok. Follow us on Twitter, Instagram, and TikTok.