


More on Web3 & Crypto

Ann
3 years ago
These new DeFi protocols are just amazing.
I've never seen this before.
Focus on native crypto development, not price activity or turmoil.
CT is boring now. Either folks are still angry about FTX or they're distracted by AI. Plus, it's year-end, and people rest for the holidays. 2022 was rough.
So DeFi fans can get inspired by something fresh. Who's building? As I read the Defillama daily roundup, many updates are still on FTX and its contagion.
I've used the same method on their Raises page. Not much happened :(. Maybe my high standards are to fault, but the business may be resting. OK.
The handful I locate might last us till the end of the year. (If another big blowup occurs.)
Hashflow
An on-chain monitor account I follow reported a huge transfer of $HFT from Binance to Jump Tradings.
I was intrigued. Stacking? So I checked and discovered out the project was launched through Binance Launchpad, which has introduced many 100x tokens (although momentarily) in the past, such as GALA and STEPN.
Hashflow appears to be pumpable. Binance launchpad, VC backers, CEX listing immediately. What's the protocol?
Hasflow is intriguing and timely, I discovered. After the FTX collapse, people looked more at DEXs.
Hashflow is a decentralized exchange that connects traders with professional market makers, according to its Binance launchpad description. Post-FTX, market makers lost their MM-ing chance with the collapse of the world's third-largest exchange. Jump and Wintermute back them?
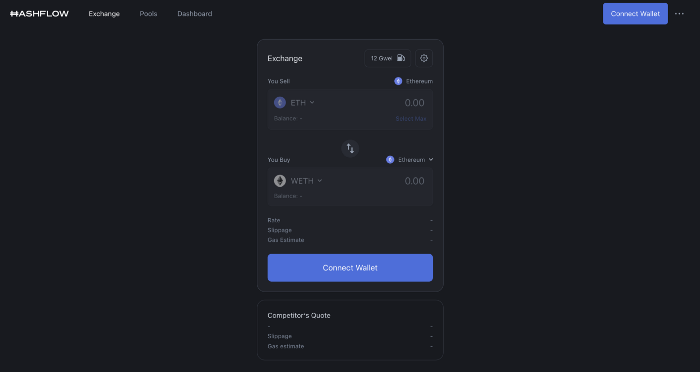
Why is that the case? Hashflow doesn't use bonding curves like standard AMM. On AMMs, you pay more for the following trade because the prior trade reduces liquidity (supply and demand). With market maker quotations, you get a CEX-like experience (fewer coins in the pool, higher price). Stable prices, no MEV frontrunning.
Hashflow is innovative because...
DEXs gained from the FTX crash, but let's be honest: DEXs aren't as good as CEXs. Hashflow will change this.
Hashflow offers MEV protection, which major dealers seek in DEXs. You can trade large amounts without front running and sandwich assaults.
Hasflow offers a user-friendly swapping platform besides MEV. Any chain can be traded smoothly. This is a benefit because DEXs lag CEXs in UX.
Status, timeline:
Wintermute wrote in August that prominent market makers will work on Hashflow. Binance launched a month-long farming session in December. Jump probably participated in this initial sell, therefore we witnessed a significant transfer after the introduction.
Binance began trading HFT token on November 11 (the day FTX imploded). coincidence?)
Tokens are used for community rewards. Perhaps they'd copy dYdX. (Airdrop?). Read their documents about their future plans. Tokenomics doesn't impress me. Governance, rewards, and NFT.
Their stat page details their activity. First came Ethereum, then Arbitrum. For a new protocol in a bear market, they handled a lot of unique users daily.
It’s interesting to see their future. Will they be thriving? Not only against DEXs, but also among the CEXs too.
STFX
I forget how I found STFX. Possibly a Twitter thread concerning Arbitrum applications. STFX was the only new protocol I found interesting.
STFX is a new concept and trader problem-solver. I've never seen this protocol.
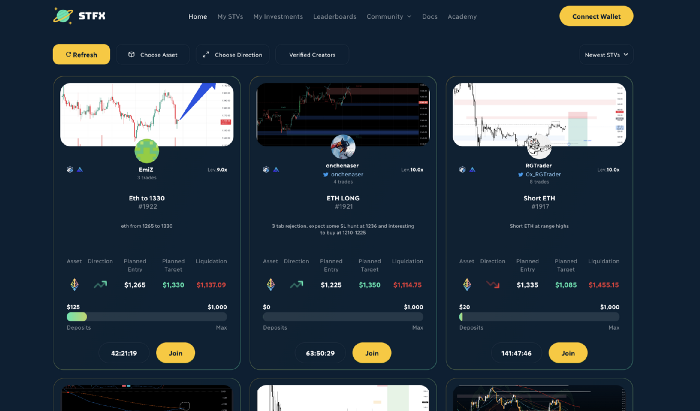
STFX allows you copy trades. You give someone your money to trade for you.
It's a marketplace. Traders are everywhere. You put your entry, exit, liquidation point, and trading theory. Twitter has a verification system for socials. Leaderboards display your trading skill.
This service could be popular. Staying disciplined is the hardest part of trading. Sometimes you take-profit too early or too late, or sell at a loss when an asset dumps, then it soon recovers (often happens in crypto.) It's hard to stick to entry-exit and liquidation plans.
What if you could hire someone to run your trade for a little commission? Set-and-forget.
Trading money isn't easy. Trust how? How do you know they won't steal your money?
Smart contracts.
STFX's trader is a vault maker/manager. One trade=one vault. User sets long/short, entrance, exit, and liquidation point. Anyone who agrees can exchange instantly. The smart contract will keep the fund during the trade and limit the manager's actions.
Here's STFX's transaction flow.
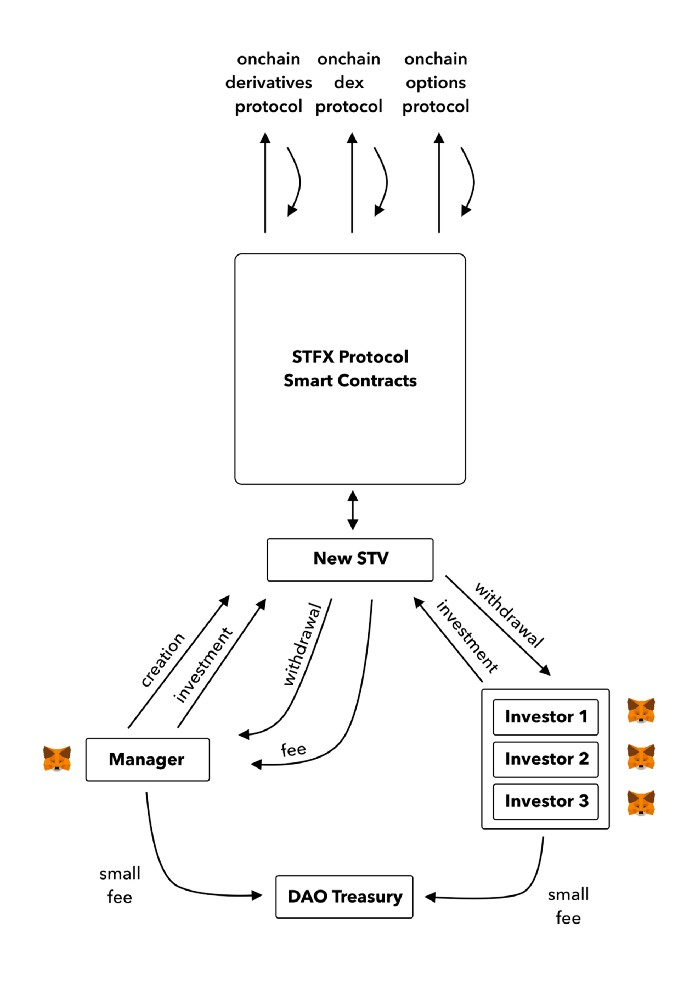
Managers and the treasury receive fees. It's a sustainable business strategy that benefits everyone.
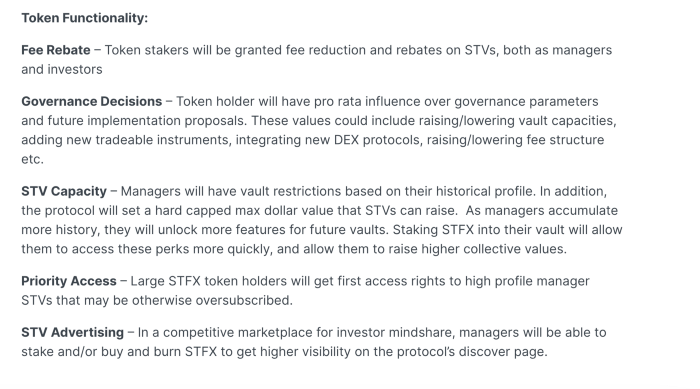
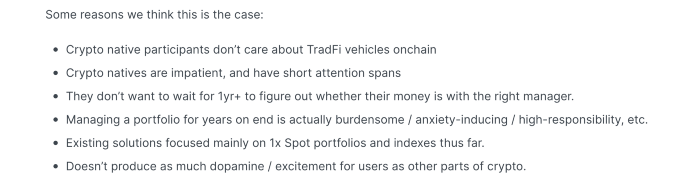
I'm impressed by $STFX's planned use. Brilliant priority access. A crypto dealer opens a vault here. Many would join. STFX tokens offer VIP access over those without tokens.
STFX provides short-term trading, which is mind-blowing to me. I agree with their platform's purpose. Crypto market pricing actions foster short-termism. When you trade, the turnover could be larger than long-term holding or trading. 2017 BTC buyers waited 5 years to complete their holdings.
STFX teams simply adapted. Volatility aids trading.
All things about STFX scream Degen. The protocol fully embraces the degen nature of some, if not most, crypto natives.
An enjoyable dApp. Leaderboards are fun for reputation-building. FLEXING COMPETITIONS. You can join for as low as $10. STFX uses Arbitrum, therefore gas costs are low. Alpha procedure completes the degen feeling.
Despite looking like they don't take themselves seriously, I sense a strong business plan below. There is a real demand for the solution STFX offers.

Onchain Wizard
3 years ago
Three Arrows Capital & Celsius Updates
I read 1k+ page 3AC liquidation documentation so you don't have to. Also sharing revised Celsius recovery plans.
3AC's liquidation documents:
Someone disclosed 3AC liquidation records in the BVI courts recently. I'll discuss the leak's timeline and other highlights.
Three Arrows Capital began trading traditional currencies in emerging markets in 2012. They switched to equities and crypto, then purely crypto in 2018.
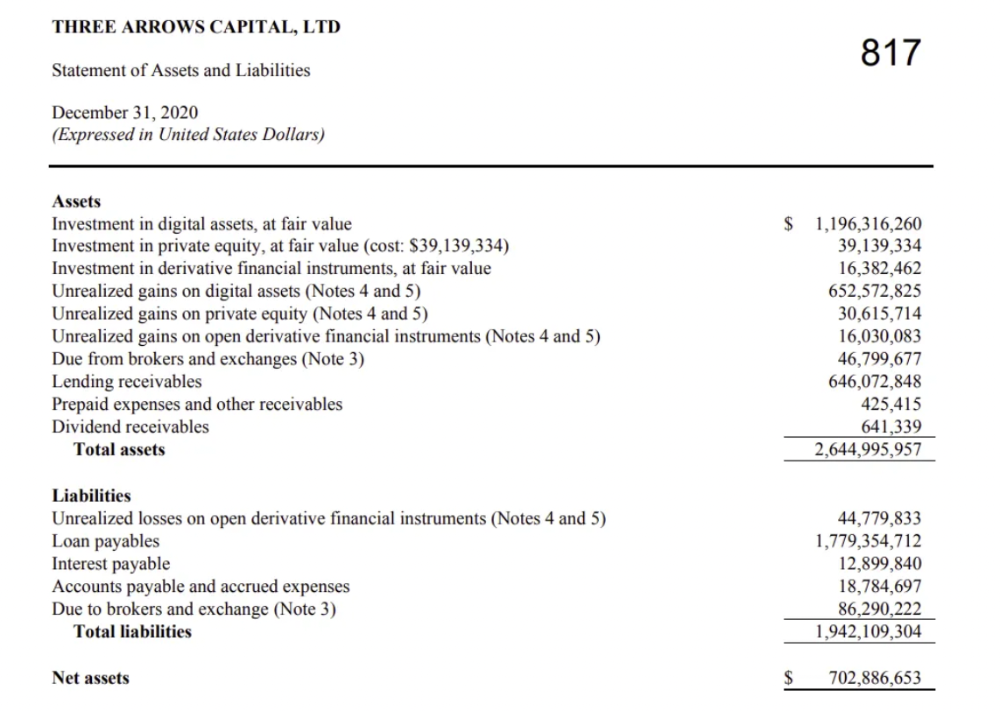
By 2020, the firm had $703mm in net assets and $1.8bn in loans (these guys really like debt).
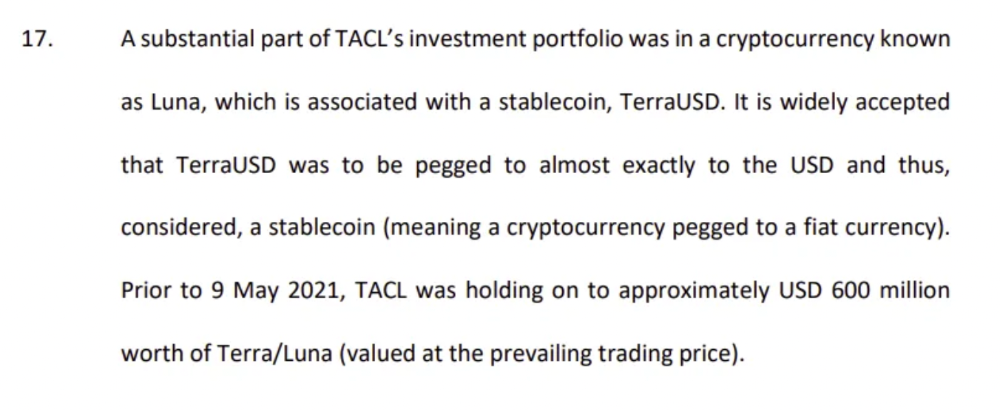
The firm's net assets under control reached $3bn in April 2022, according to the filings. 3AC had $600mm of LUNA/UST exposure before May 9th 2022, which put them over.
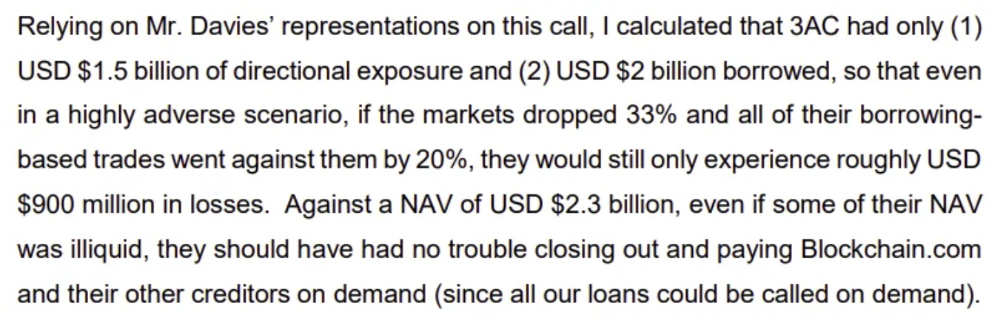
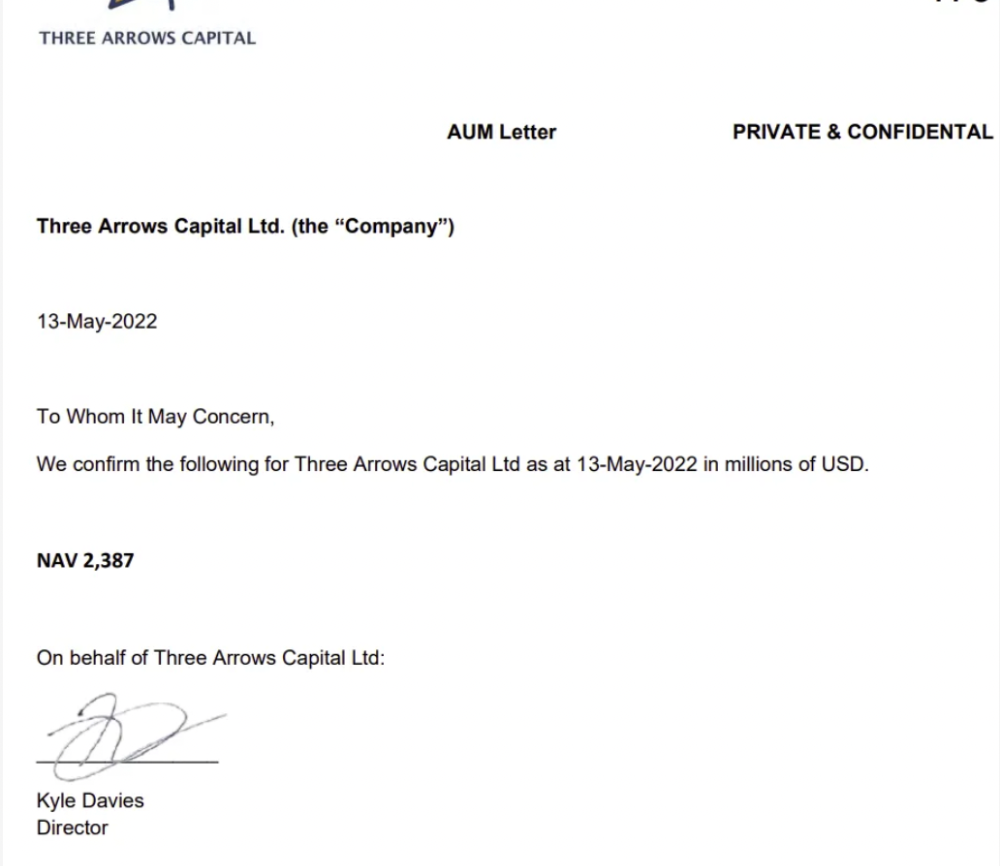
LUNA and UST go to zero quickly (I wrote about the mechanics of the blowup here). Kyle Davies, 3AC co-founder, told Blockchain.com on May 13 that they have $2.4bn in assets and $2.3bn NAV vs. $2bn in borrowings. As BTC and ETH plunged 33% and 50%, the company became insolvent by mid-2022.
3AC sent $32mm to Tai Ping Shen, a Cayman Islands business owned by Su Zhu and Davies' partner, Kelly Kaili Chen (who knows what is going on here).
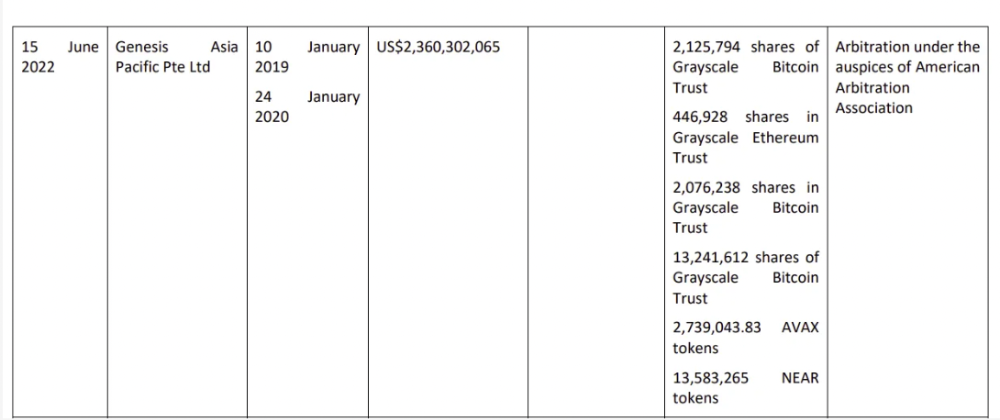
3AC had borrowed over $3.5bn in notional principle, with Genesis ($2.4bn) and Voyager ($650mm) having the most exposure.
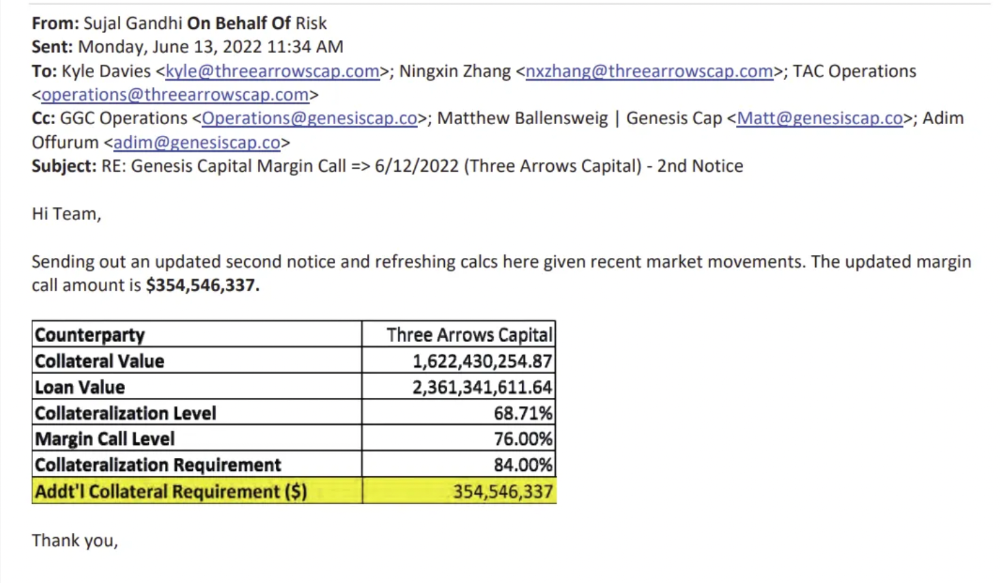
Genesis demanded $355mm in further collateral in June.
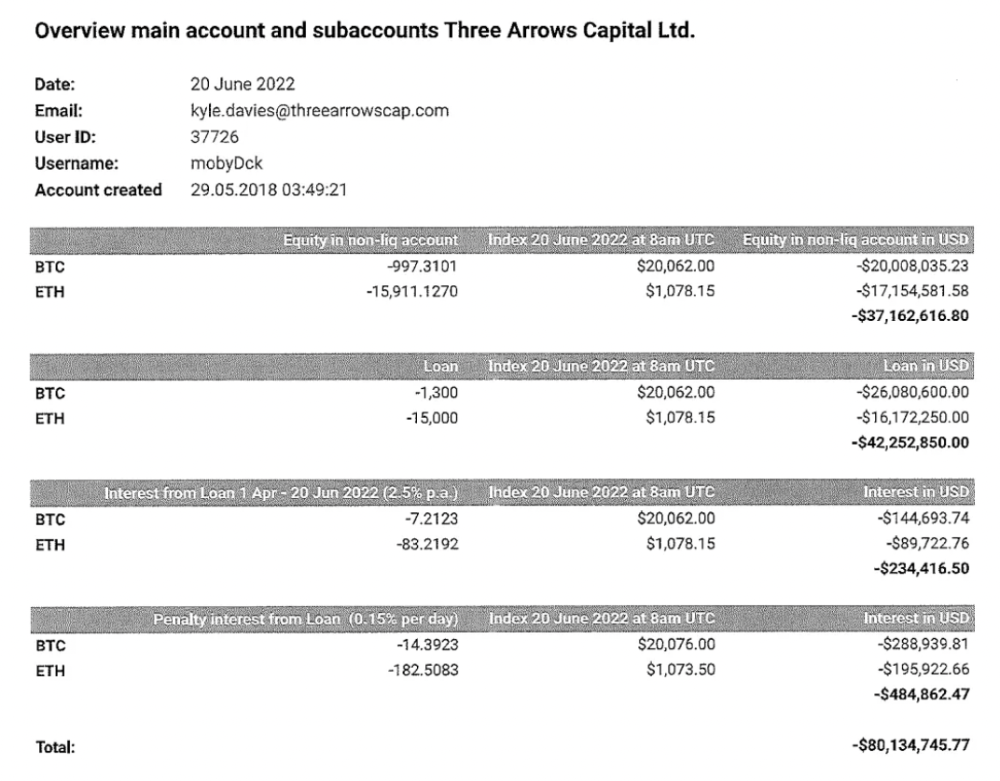
Deribit (another 3AC investment) called for $80 million in mid-June.
Even in mid-June, the corporation was trying to borrow more money to stay afloat. They approached Genesis for another $125mm loan (to pay another lender) and HODLnauts for BTC & ETH loans.
Pretty crazy. 3AC founders used borrowed money to buy a $50 million boat, according to the leak.
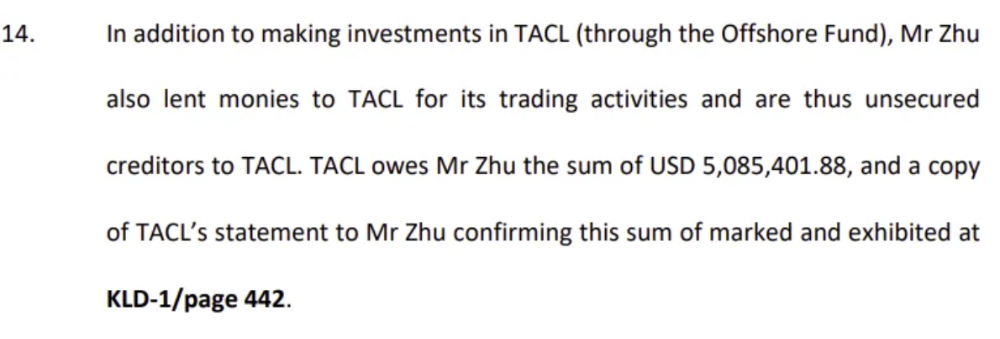
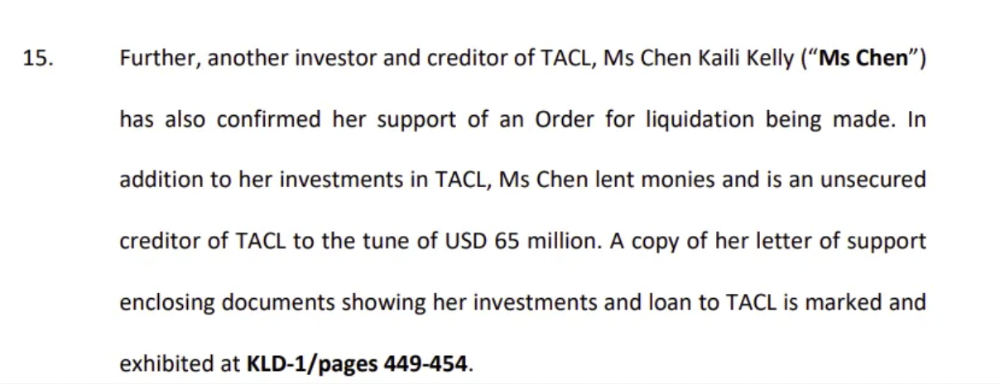
Su requesting for $5m + Chen Kaili Kelly asserting they loaned $65m unsecured to 3AC are identified as creditors.
Celsius:
This bankruptcy presentation shows the Celsius breakdown from March to July 14, 2022. From $22bn to $4bn, crypto assets plummeted from $14.6bn to $1.8bn (ouch). $16.5bn in user liabilities dropped to $4.72bn.
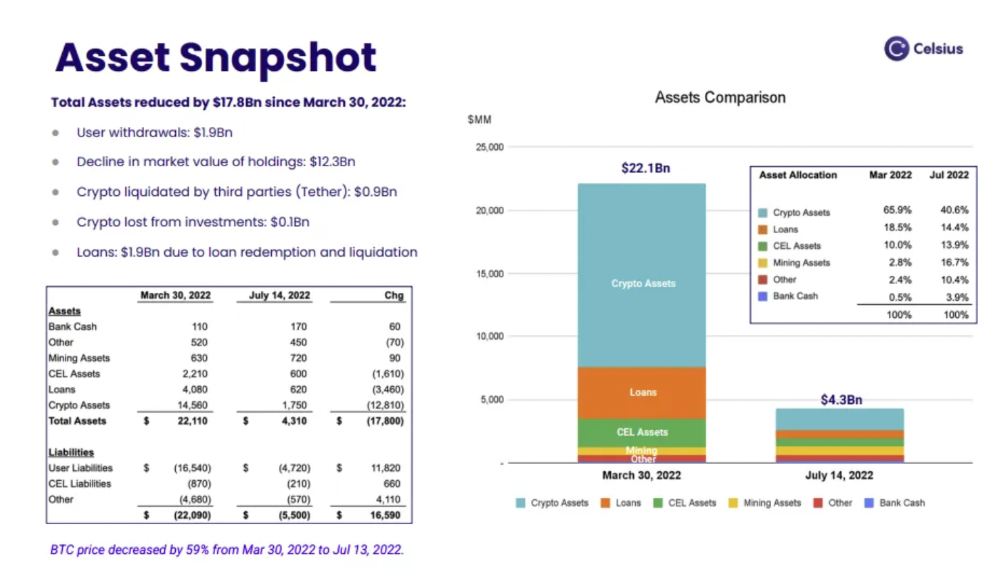
In my recent post, I examined if "forced selling" is over, with Celsius' crypto assets being a major overhang. In this presentation, it looks that Chapter 11 will provide clients the opportunity to accept cash at a discount or remain long crypto. Provided that a fresh source of money is unlikely to enter the Celsius situation, cash at a discount or crypto given to customers will likely remain a near-term market risk - cash at a discount will likely come from selling crypto assets, while customers who receive crypto could sell at any time. I'll share any Celsius updates I find.
Conclusion
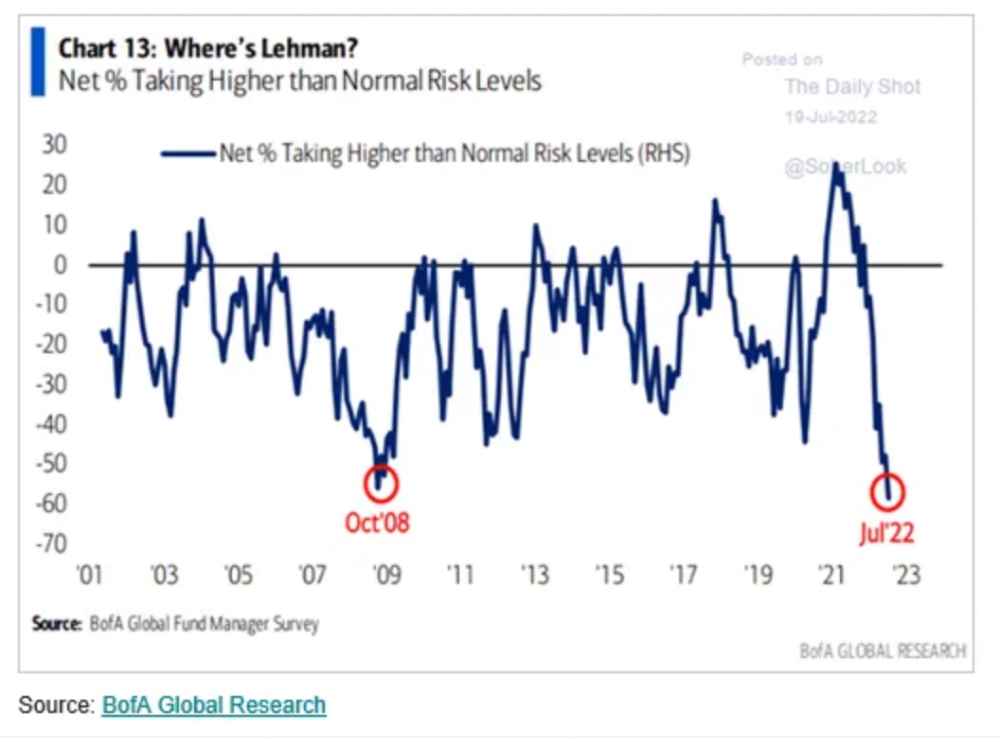
Only Celsius and the Mt Gox BTC unlock remain as forced selling catalysts. While everything went through a "relief" pump, with ETH up 75% from the bottom and numerous alts multiples higher, there are still macro dangers to equities + risk assets. There's a lot of wealth waiting to be deployed in crypto ($153bn in stables), but fund managers are risk apprehensive (lower than 2008 levels).
We're hopefully over crypto's "bottom," with peak anxiety and forced selling behind us, but we may chop around.
To see the full article, click here.

OnChain Wizard
3 years ago
How to make a >800 million dollars in crypto attacking the once 3rd largest stablecoin, Soros style
Everyone is talking about the $UST attack right now, including Janet Yellen. But no one is talking about how much money the attacker made (or how brilliant it was). Lets dig in.
Our story starts in late March, when the Luna Foundation Guard (or LFG) starts buying BTC to help back $UST. LFG started accumulating BTC on 3/22, and by March 26th had a $1bn+ BTC position. This is leg #1 that made this trade (or attack) brilliant.
The second leg comes in the form of the 4pool Frax announcement for $UST on April 1st. This added the second leg needed to help execute the strategy in a capital efficient way (liquidity will be lower and then the attack is on).
We don't know when the attacker borrowed 100k BTC to start the position, other than that it was sold into Kwon's buying (still speculation). LFG bought 15k BTC between March 27th and April 11th, so lets just take the average price between these dates ($42k).
So you have a ~$4.2bn short position built. Over the same time, the attacker builds a $1bn OTC position in $UST. The stage is now set to create a run on the bank and get paid on your BTC short. In anticipation of the 4pool, LFG initially removes $150mm from 3pool liquidity.
The liquidity was pulled on 5/8 and then the attacker uses $350mm of UST to drain curve liquidity (and LFG pulls another $100mm of liquidity).
But this only starts the de-pegging (down to 0.972 at the lows). LFG begins selling $BTC to defend the peg, causing downward pressure on BTC while the run on $UST was just getting started.
With the Curve liquidity drained, the attacker used the remainder of their $1b OTC $UST position ($650mm or so) to start offloading on Binance. As withdrawals from Anchor turned from concern into panic, this caused a real de-peg as people fled for the exits
So LFG is selling $BTC to restore the peg while the attacker is selling $UST on Binance. Eventually the chain gets congested and the CEXs suspend withdrawals of $UST, fueling the bank run panic. $UST de-pegs to 60c at the bottom, while $BTC bleeds out.
The crypto community panics as they wonder how much $BTC will be sold to keep the peg. There are liquidations across the board and LUNA pukes because of its redemption mechanism (the attacker very well could have shorted LUNA as well). BTC fell 25% from $42k on 4/11 to $31.3k
So how much did our attacker make? There aren't details on where they covered obviously, but if they are able to cover (or buy back) the entire position at ~$32k, that means they made $952mm on the short.
On the $350mm of $UST curve dumps I don't think they took much of a loss, lets assume 3% or just $11m. And lets assume that all the Binance dumps were done at 80c, thats another $125mm cost of doing business. For a grand total profit of $815mm (bf borrow cost).
BTC was the perfect playground for the trade, as the liquidity was there to pull it off. While having LFG involved in BTC, and foreseeing they would sell to keep the peg (and prevent LUNA from dying) was the kicker.
Lastly, the liquidity being low on 3pool in advance of 4pool allowed the attacker to drain it with only $350mm, causing the broader panic in both BTC and $UST. Any shorts on LUNA would've added a lot of P&L here as well, with it falling -65% since 5/7.
And for the reply guys, yes I know a lot of this involves some speculation & assumptions. But a lot of money was made here either way, and I thought it would be cool to dive into how they did it.
You might also like
Matthew Royse
3 years ago
These 10 phrases are unprofessional at work.
Successful workers don't talk this way.

"I know it's unprofessional, but I can't stop." — Author Sandy Hall
Do you realize your unprofessionalism? Do you care? Self-awareness?
Everyone can improve their unprofessionalism. Some workplace phrases and words shouldn't be said.
People often say out loud what they're thinking. They show insecurity, incompetence, and disrespect.
"Think before you speak," goes the saying.
Some of these phrases are "okay" in certain situations, but you'll lose colleagues' respect if you use them often.
Your word choice. Your tone. Your intentions. They matter.
Choose your words carefully to build work relationships and earn peer respect. You should build positive relationships with coworkers and clients.
These 10 phrases are unprofessional.
1. That Meeting Really Sucked
Wow! Were you there? You should be responsible if you attended. You can influence every conversation.
Alternatives
Improve the meeting instead of complaining afterward. Make it more meaningful and productive.
2. Not Sure if You Saw My Last Email
Referencing a previous email irritates people. Email follow-up can be difficult. Most people get tons of emails a day, so it may have been buried, forgotten, or low priority.
Alternatives
It's okay to follow up, but be direct, short, and let the recipient "save face"
3. Any Phrase About Sex, Politics, and Religion
Discussing sex, politics, and religion at work is foolish. If you discuss these topics, you could face harassment lawsuits.
Alternatives
Keep quiet about these contentious issues. Don't touch them.
4. I Know What I’m Talking About
Adding this won't persuade others. Research, facts, and topic mastery are key to persuasion. If you're knowledgeable, you don't need to say this.
Alternatives
Please don’t say it at all. Justify your knowledge.
5. Per Our Conversation
This phrase sounds like legal language. You seem to be documenting something legally. Cold, stern, and distant. "As discussed" sounds inauthentic.
Alternatives
It was great talking with you earlier; here's what I said.
6. Curse-Word Phrases
Swearing at work is unprofessional. You never know who's listening, so be careful. A child may be at work or on a Zoom or Teams call. Workplace cursing is unacceptable.
Alternatives
Avoid adult-only words.
7. I Hope This Email Finds You Well
This is a unique way to wish someone well. This phrase isn't as sincere as the traditional one. When you talk about the email, you're impersonal.
Alternatives
Genuinely care for others.
8. I Am Really Stressed
Happy, strong, stress-managing coworkers are valued. Manage your own stress. Exercise, sleep, and eat better.
Alternatives
Everyone has stress, so manage it. Don't talk about your stress.
9. I Have Too Much to Do
You seem incompetent. People think you can't say "no" or have poor time management. If you use this phrase, you're telling others you may need to change careers.
Alternatives
Don't complain about your workload; just manage it.
10. Bad Closing Salutations
"Warmly," "best," "regards," and "warm wishes" are common email closings. This conclusion sounds impersonal. Why use "warmly" for finance's payment status?
Alternatives
Personalize the closing greeting to the message and recipient. Use "see you tomorrow" or "talk soon" as closings.
Bringing It All Together
These 10 phrases are unprofessional at work. That meeting sucked, not sure if you saw my last email, and sex, politics, and religion phrases.
Also, "I know what I'm talking about" and any curse words. Also, avoid phrases like I hope this email finds you well, I'm stressed, and I have too much to do.
Successful workers communicate positively and foster professionalism. Don't waste chances to build strong work relationships by being unprofessional.
“Unprofessionalism damages the business reputation and tarnishes the trust of society.” — Pearl Zhu, an American author
This post is a summary. Read full article here
Maddie Wang
3 years ago
Easiest and fastest way to test your startup idea!

Here's the fastest way to validate company concepts.
I squandered a year after dropping out of Stanford designing a product nobody wanted.
But today, I’m at 100k!
Differences:
I was designing a consumer product when I dropped out.
I coded MVP, got 1k users, and got YC interview.
Nice, huh?
WRONG!
Still coding and getting users 12 months later
WOULD PEOPLE PAY FOR IT? was the riskiest assumption I hadn't tested.
When asked why I didn't verify payment, I said,
Not-ready products. Now, nobody cares. The website needs work. Include this. Increase usage…
I feared people would say no.
After 1 year of pushing it off, my team told me they were really worried about the Business Model. Then I asked my audience if they'd buy my product.
So?
No, overwhelmingly.
I felt like I wasted a year building a product no one would buy.
Founders Cafe was the opposite.
Before building anything, I requested payment.
40 founders were interviewed.
Then we emailed Stanford, YC, and other top founders, asking them to join our community.
BOOM! 10/12 paid!
Without building anything, in 1 day I validated my startup's riskiest assumption. NOT 1 year.
Asking people to pay is one of the scariest things.
I understand.
I asked Stanford queer women to pay before joining my gay sorority.
I was afraid I'd turn them off or no one would pay.
Gay women, like those founders, were in such excruciating pain that they were willing to pay me upfront to help.
You can ask for payment (before you build) to see if people have the burning pain. Then they'll pay!
Examples from Founders Cafe members:
😮 Using a fake landing page, a college dropout tested a product. Paying! He built it and made $3m!
😮 YC solo founder faked a Powerpoint demo. 5 Enterprise paid LOIs. $1.5m raised, built, and in YC!
😮 A Harvard founder can convert Figma to React. 1 day, 10 customers. Built a tool to automate Figma -> React after manually fulfilling requests. 1m+
Bad example:
😭 Stanford Dropout Spends 1 Year Building Product Without Payment Validation
Some people build for a year and then get paying customers.
What I'm sharing is my experience and what Founders Cafe members have told me about validating startup ideas.
Don't waste a year like I did.
After my first startup failed, I planned to re-enroll at Stanford/work at Facebook.
After people paid, I quit for good.
I've hit $100k!
Hope this inspires you to request upfront payment! It'll change your life

Jack Burns
3 years ago
Here's what to expect from NASA Artemis 1 and why it's significant.
NASA's Artemis 1 mission will help return people to the Moon after a half-century break. The mission is a shakedown cruise for NASA's Space Launch System and Orion Crew Capsule.
The spaceship will visit the Moon, deploy satellites, and enter orbit. NASA wants to practice operating the spacecraft, test the conditions people will face on the Moon, and ensure a safe return to Earth.
We asked Jack Burns, a space scientist at the University of Colorado Boulder and former member of NASA's Presidential Transition Team, to describe the mission, explain what the Artemis program promises for space exploration, and reflect on how the space program has changed in the half-century since humans last set foot on the moon.
What distinguishes Artemis 1 from other rockets?
Artemis 1 is the Space Launch System's first launch. NASA calls this a "heavy-lift" vehicle. It will be more powerful than Apollo's Saturn V, which transported people to the Moon in the 1960s and 1970s.
It's a new sort of rocket system with two strap-on solid rocket boosters from the space shuttle. It's a mix of the shuttle and Saturn V.
The Orion Crew Capsule will be tested extensively. It'll spend a month in the high-radiation Moon environment. It will also test the heat shield, which protects the capsule and its occupants at 25,000 mph. The heat shield must work well because this is the fastest capsule descent since Apollo.
This mission will also carry miniature Moon-orbiting satellites. These will undertake vital precursor science, including as examining further into permanently shadowed craters where scientists suspect there is water and measuring the radiation environment to see long-term human consequences.

Artemis 1 will launch, fly to the Moon, place satellites, orbit it, return to Earth, and splash down in the ocean. NASA.
What's Artemis's goal? What launches are next?
The mission is a first step toward Artemis 3, which will lead to the first human Moon missions since 1972. Artemis 1 is unmanned.
Artemis 2 will have astronauts a few years later. Like Apollo 8, it will be an orbital mission that circles the Moon and returns. The astronauts will orbit the Moon longer and test everything with a crew.
Eventually, Artemis 3 will meet with the SpaceX Starship on the Moon's surface and transfer people. Orion will stay in orbit while the lunar Starship lands astronauts. They'll go to the Moon's south pole to investigate the water ice there.
Artemis is reminiscent of Apollo. What's changed in 50 years?
Kennedy wanted to beat the Soviets to the Moon with Apollo. The administration didn't care much about space flight or the Moon, but the goal would place America first in space and technology.
You live and die by the sword if you do that. When the U.S. reached the Moon, it was over. Russia lost. We planted flags and did science experiments. Richard Nixon canceled the program after Apollo 11 because the political goals were attained.
Large rocket with two boosters between two gates
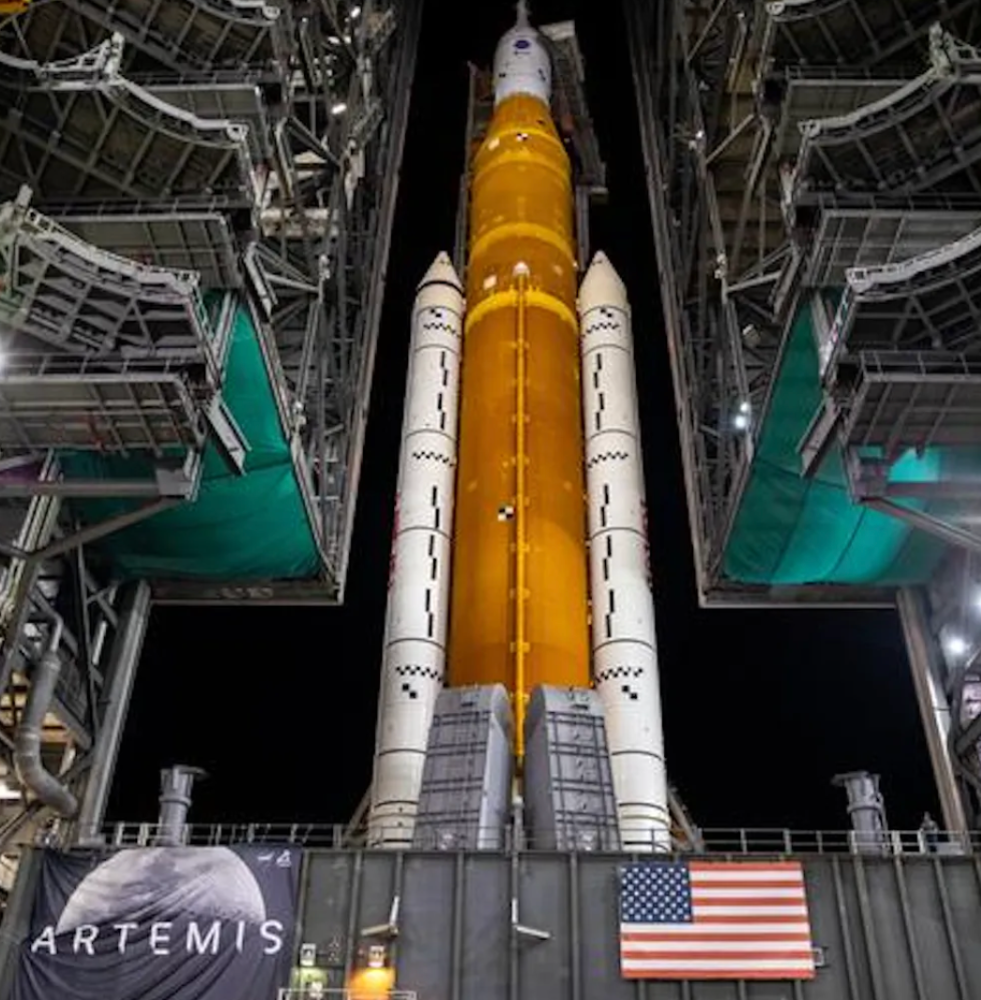
NASA's new Space Launch System is brought to a launchpad. NASA
50 years later... It's quite different. We're not trying to beat the Russians, Chinese, or anyone else, but to begin sustainable space exploration.
Artemis has many goals. It includes harnessing in-situ resources like water ice and lunar soil to make food, fuel, and building materials.
SpaceX is part of this first journey to the Moon's surface, therefore the initiative is also helping to develop a lunar and space economy. NASA doesn't own the Starship but is buying seats for astronauts. SpaceX will employ Starship to transport cargo, private astronauts, and foreign astronauts.
Fifty years of technology advancement has made getting to the Moon cheaper and more practical, and computer technology allows for more advanced tests. 50 years of technological progress have changed everything. Anyone with enough money can send a spacecraft to the Moon, but not humans.
Commercial Lunar Payload Services engages commercial companies to develop uncrewed Moon landers. We're sending a radio telescope to the Moon in January. Even 10 years ago, that was impossible.
Since humans last visited the Moon 50 years ago, technology has improved greatly.
What other changes does Artemis have in store?
The government says Artemis 3 will have at least one woman and likely a person of color.
I'm looking forward to seeing more diversity so young kids can say, "Hey, there's an astronaut that looks like me. I can do this. I can be part of the space program.”