


More on Leadership

Greg Satell
3 years ago
Focus: The Deadly Strategic Idea You've Never Heard Of (But Definitely Need To Know!

Steve Jobs' initial mission at Apple in 1997 was to destroy. He killed the Newton PDA and Macintosh clones. Apple stopped trying to please everyone under Jobs.
Afterward, there were few highly targeted moves. First, the pink iMac. Modest success. The iPod, iPhone, and iPad made Apple the world's most valuable firm. Each maneuver changed the company's center of gravity and won.
That's the idea behind Schwerpunkt, a German military term meaning "focus." Jobs didn't need to win everywhere, just where it mattered, so he focused Apple's resources on a few key goods. Finding your Schwerpunkt is more important than charts and analysis for excellent strategy.
Comparison of Relative Strength and Relative Weakness
The iPod, Apple's first major hit after Jobs' return, didn't damage Microsoft and the PC, but instead focused Apple's emphasis on a fledgling, fragmented market that generated "sucky" products. Apple couldn't have taken on the computer titans at this stage, yet it beat them.
The move into music players used Apple's particular capabilities, especially its ability to build simple, easy-to-use interfaces. Jobs' charisma and stature, along his understanding of intellectual property rights from Pixar, helped him build up iTunes store, which was a quagmire at the time.
In Good Strategy | Bad Strategy, management researcher Richard Rumelt argues that good strategy uses relative strength to counter relative weakness. To discover your main point, determine your abilities and where to effectively use them.
Steve Jobs did that at Apple. Microsoft and Dell, who controlled the computer sector at the time, couldn't enter the music player business. Both sought to produce iPod competitors but failed. Apple's iPod was nobody else's focus.
Finding The Center of Attention
In a military engagement, leaders decide where to focus their efforts by assessing commanders intent, the situation on the ground, the topography, and the enemy's posture on that terrain. Officers spend their careers learning about schwerpunkt.
Business executives must assess internal strengths including personnel, technology, and information, market context, competitive environment, and external partner ecosystems. Steve Jobs was a master at analyzing forces when he returned to Apple.
He believed Apple could integrate technology and design for the iPod and that the digital music player industry sucked. By analyzing competitors' products, he was convinced he could produce a smash by putting 1000 tunes in my pocket.
The only difficulty was there wasn't the necessary technology. External ecosystems were needed. On a trip to Japan to meet with suppliers, a Toshiba engineer claimed the company had produced a tiny memory drive approximately the size of a silver dollar.
Jobs knew the memory drive was his focus. He wrote a $10 million cheque and acquired exclusive technical rights. For a time, none of his competitors would be able to recreate his iPod with the 1000 songs in my pocket.
How to Enter the OODA Loop
John Boyd invented the OODA loop as a pilot to better his own decision-making. First OBSERVE your surroundings, then ORIENT that information using previous knowledge and experiences. Then you DECIDE and ACT, which changes the circumstance you must observe, orient, decide, and act on.
Steve Jobs used the OODA loop to decide to give Toshiba $10 million for a technology it had no use for. He compared the new information with earlier observations about the digital music market.
Then something much more interesting happened. The iPod was an instant hit, changing competition. Other computer businesses that competed in laptops, desktops, and servers created digital music players. Microsoft's Zune came out in 2006, Dell's Digital Jukebox in 2004. Both flopped.
By then, Apple was poised to unveil the iPhone, which would cause its competitors to Observe, Orient, Decide, and Act. Boyd named this OODA Loop infiltration. They couldn't gain the initiative by constantly reacting to Apple.
Microsoft and Dell were titans back then, but it's hard to recall. Apple went from near bankruptcy to crushing its competition via Schwerpunkt.
Rather than a destination, it is a journey
Trying to win everywhere is a strategic blunder. Win significant fights, not trivial skirmishes. Identifying a focal point to direct resources and efforts is the essence of Schwerpunkt.
When Steve Jobs returned to Apple, PC firms were competing, but he focused on digital music players, and the iPod made Apple a player. He launched the iPhone when his competitors were still reacting. When Steve Jobs said, "One more thing," at the end of a product presentation, he had a new focus.
Schwerpunkt isn't static; it's dynamic. Jobs' ability to observe, refocus, and modify the competitive backdrop allowed Apple to innovate consistently. His strategy was tailored to Apple's capabilities, customers, and ecosystem. Microsoft or Dell, better suited for the enterprise sector, couldn't succeed with a comparable approach.
There is no optimal strategy, only ones suited to a given environment, when relative strength might be used against relative weakness. Discovering the center of gravity where you can break through is more of a journey than a destination; it will become evident after you reach.

The woman
3 years ago
Why Google's Hiring Process is Brilliant for Top Tech Talent
Without a degree and experience, you can get a high-paying tech job.

Most organizations follow this hiring rule: you chat with HR, interview with your future boss and other senior managers, and they make the final hiring choice.
If you've ever applied for a job, you know how arduous it can be. A newly snapped photo and a glossy resume template can wear you out. Applying to Google can change this experience.
According to an Universum report, Google is one of the world's most coveted employers. It's not simply the search giant's name and reputation that attract candidates, but its role requirements or lack thereof.
Candidates no longer need a beautiful resume, cover letter, Ivy League laurels, or years of direct experience. The company requires no degree or experience.
Elon Musk started it. He employed the two-hands test to uncover talented non-graduates. The billionaire eliminated the requirement for experience.
Google is deconstructing traditional employment with programs like the Google Project Management Degree, a free online and self-paced professional credential course.
Google's hiring is interesting. After its certification course, applicants can work in project management. Instead of academic degrees and experience, the company analyzes coursework.
Google finds the best project managers and technical staff in exchange. Google uses three strategies to find top talent.
Chase down the innovators
Google eliminates restrictions like education, experience, and others to find the polar bear amid the snowfall. Google's free project management education makes project manager responsibilities accessible to everyone.
Many jobs don't require a degree. Overlooking individuals without a degree can make it difficult to locate a candidate who can provide value to a firm.
Firsthand knowledge follows the same rule. A lack of past information might be an employer's benefit. This is true for creative teams or businesses that prefer to innovate.
Or when corporations conduct differently from the competition. No-experience candidates can offer fresh perspectives. Fast Company reports that people with no sales experience beat those with 10 to 15 years of experience.
Give the aptitude test first priority.
Google wants the best candidates. Google wouldn't be able to receive more applications if it couldn't screen them for fit. Its well-organized online training program can be utilized as a portfolio.
Google learns a lot about an applicant through completed assignments. It reveals their ability, leadership style, communication capability, etc. The course mimics the job to assess candidates' suitability.
Basic screening questions might provide information to compare candidates. Any size small business can use screening questions and test projects to evaluate prospective employees.
Effective training for employees
Businesses must train employees regardless of their hiring purpose. Formal education and prior experience don't guarantee success. Maintaining your employees' professional knowledge gaps is key to their productivity and happiness. Top-notch training can do that. Learning and development are key to employee engagement, says Bob Nelson, author of 1,001 Ways to Engage Employees.
Google's online certification program isn't available everywhere. Improving the recruiting process means emphasizing aptitude over experience and a degree. Instead of employing new personnel and having them work the way their former firm trained them, train them how you want them to function.
If you want to know more about Google’s recruiting process, we recommend you watch the movie “Internship.”

Christian Soschner
3 years ago
Steve Jobs' Secrets Revealed
From 1984 until 2011, he ran Apple using the same template.

What is a founder CEO's most crucial skill?
Presentation, communication, and sales
As a Business Angel Investor, I saw many pitch presentations and met with investors one-on-one to promote my companies.
There is always the conception of “Investors have to invest,” so there is no need to care about the presentation.
It's false. Nobody must invest. Many investors believe that entrepreneurs must convince them to invest in their business.
Sometimes — like in 2018–2022 — too much money enters the market, and everyone makes good money.
Do you recall the Buy Now, Pay Later Movement? This amazing narrative had no return potential. Only buyers who couldn't acquire financing elsewhere shopped at these companies.
Klarna's failing business concept led to high valuations.
Investors become more cautious when the economy falters. 2022 sees rising inflation, interest rates, wars, and civil instability. It's like the apocalypse's four horsemen have arrived.
Storytelling is important in rough economies.
When investors draw back, how can entrepreneurs stand out?
In Q2/2022, every study I've read said:
Investors cease investing
Deals are down in almost all IT industries from previous quarters.
What do founders need to do?
Differentiate yourself.
Storytelling talents help.
The Steve Jobs Way
Every time I watch a Steve Jobs presentation, I'm enthralled.
I'm a techie. Everything technical interests me. But, I skim most presentations.
What's Steve Jobs's secret?
Steve Jobs created Apple in 1976 and made it a profitable software and hardware firm in the 1980s. Macintosh goods couldn't beat IBM's. This mistake sacked him in 1985.
Before rejoining Apple in 1997, Steve Jobs founded Next Inc. and Pixar.
From then on, Apple became America's most valuable firm.
Steve Jobs understood people's needs. He said:
“People don’t know what they want until you show it to them. That’s why I never rely on market research. Our task is to read things that are not yet on the page.”
In his opinion, people talk about problems. A lot. Entrepreneurs must learn what the population's pressing problems are and create a solution.
Steve Jobs showed people what they needed before they realized it.
I'll explain:
Present a Big Vision
Steve Jobs starts every presentation by describing his long-term goals for Apple.
1984's Macintosh presentation set up David vs. Goliath. In a George Orwell-style dystopia, IBM computers were bad. It was 1984.
Apple will save the world, like Jedis.
Why do customers and investors like Big Vision?
People want a wider perspective, I think. Humans love improving the planet.
Apple users often cite emotional reasons for buying the brand.
Revolutionizing several industries with breakthrough inventions
Establish Authority
Everyone knows Apple in 2022. It's hard to find folks who confuse Apple with an apple around the world.
Apple wasn't as famous as it is today until Steve Jobs left in 2011.
Most entrepreneurs lack experience. They may market their company or items to folks who haven't heard of it.
Steve Jobs presented the company's historical accomplishments to overcome opposition.
In his presentation of the first iPhone, he talked about the Apple Macintosh, which altered the computing sector, and the iPod, which changed the music industry.
People who have never heard of Apple feel like they're seeing a winner. It raises expectations that the new product will be game-changing and must-have.
The Big Reveal
A pitch or product presentation always has something new.
Steve Jobs doesn't only demonstrate the product. I don't think he'd skip the major point of a company presentation.
He consistently discusses present market solutions, their faults, and a better consumer solution.
No solution exists yet.
It's a multi-faceted play:
It's comparing the new product to something familiar. This makes novelty and the product more relatable.
Describe a desirable solution.
He's funny. He demonstrated an iPod with an 80s phone dial in his iPhone presentation.
Then he reveals the new product. Macintosh presented itself.
Show the benefits
He outlines what Apple is doing differently after demonstrating the product.
How do you distinguish from others? The Big Breakthrough Presentation.
A few hundred slides might list all benefits.
Everyone would fall asleep. Have you ever had similar presentations?
When the brain is overloaded with knowledge, the limbic system changes to other duties, like lunch planning.
What should a speaker do? There's a classic proverb:
“Tell me and I forget, teach me and I may remember, involve me and I learn” (— Not Benjamin Franklin).
Steve Jobs showcased the product live.
Again, using ordinary scenarios to highlight the product's benefits makes it relatable.
The 2010 iPad Presentation uses this technique.
Invite the Team and Let Them Run the Presentation
CEOs spend most time outside the organization. Many companies elect to have only one presenter.
It sends the incorrect message to investors. Product presentations should always include the whole team.
Let me explain why.
Companies needing investment money frequently have shaky business strategies or no product-market fit or robust corporate structure.
Investors solely bet on a team's ability to implement ideas and make a profit.
Early team involvement helps investors understand the company's drivers. Travel costs are worthwhile.
But why for product presentations?
Presenters of varied ages, genders, social backgrounds, and skillsets are relatable. CEOs want relatable products.
Some customers may not believe a white man's message. A black woman's message may be more accepted.
Make the story relatable when you have the best product that solves people's concerns.
Best example: 1984 Macintosh presentation with development team panel.
What is the largest error people make when companies fail?
Saving money on the corporate and product presentation.
Invite your team to five partner meetings when five investors are shortlisted.
Rehearse the presentation till it's natural. Let the team speak.
Successful presentations require structure, rehearsal, and a team. Steve Jobs nailed it.
You might also like
JEFF JOHN ROBERTS
3 years ago
What just happened in cryptocurrency? A plain-English Q&A about Binance's FTX takedown.
Crypto people have witnessed things. They've seen big hacks, mind-boggling swindles, and amazing successes. They've never seen a day like Tuesday, when the world's largest crypto exchange murdered its closest competition.
Here's a primer on Binance and FTX's lunacy and why it matters if you're new to crypto.
What happened?
CZ, a shrewd Chinese-Canadian billionaire, runs Binance. FTX, a newcomer, has challenged Binance in recent years. SBF (Sam Bankman-Fried)—a young American with wild hair—founded FTX (initials are a thing in crypto).
Last weekend, CZ complained about SBF's lobbying and then exploited Binance's market power to attack his competition.
How did CZ do that?
CZ invested in SBF's new cryptocurrency exchange when they were friends. CZ sold his investment in FTX for FTT when he no longer wanted it. FTX clients utilize those tokens to get trade discounts, although they are less liquid than Bitcoin.
SBF made a mistake by providing CZ just too many FTT tokens, giving him control over FTX. It's like Pepsi handing Coca-Cola a lot of stock it could sell at any time. CZ got upset with SBF and flooded the market with FTT tokens.
SBF owns a trading fund with many FTT tokens, therefore this was catastrophic. SBF sought to defend FTT's worth by selling other assets to buy up the FTT tokens flooding the market, but it didn't succeed, and as FTT's value plummeted, his liabilities exceeded his assets. By Tuesday, his companies were insolvent, so he sold them to his competition.
Crazy. How could CZ do that?
CZ likely did this to crush a rising competition. It was also personal. In recent months, regulators have been tough toward the crypto business, and Binance and FTX have been trying to stay on their good side. CZ believed SBF was poisoning U.S. authorities by saying CZ was linked to China, so CZ took retribution.
“We supported previously, but we won't pretend to make love after divorce. We're neutral. But we won't assist people that push against other industry players behind their backs," CZ stated in a tragic tweet on Sunday. He crushed his rival's company two days later.
So does Binance now own FTX?
No. Not yet. CZ has only stated that Binance signed a "letter of intent" to acquire FTX. CZ and SBF say Binance will protect FTX consumers' funds.
Who’s to blame?
You could blame CZ for using his control over FTX to destroy it. SBF is also being criticized for not disclosing the full overlap between FTX and his trading company, which controlled plenty of FTT. If he had been upfront, someone might have warned FTX about this vulnerability earlier, preventing this mess.
Others have alleged that SBF utilized customer monies to patch flaws in his enterprises' balance accounts. That happened to multiple crypto startups that collapsed this spring, which is unfortunate. These are allegations, not proof.
Why does this matter? Isn't this common in crypto?
Crypto is notorious for shady executives and pranks. FTX is the second-largest crypto business, and SBF was largely considered as the industry's golden boy who would help it get on authorities' good side. Thus far.
Does this affect cryptocurrency prices?
Short-term, it's bad. Prices fell on suspicions that FTX was in peril, then rallied when Binance rescued it, only to fall again later on Tuesday.
These occurrences have hurt FTT and SBF's Solana token. It appears like a huge token selloff is affecting the rest of the market. Bitcoin fell 10% and Ethereum 15%, which is bad but not catastrophic for the two largest coins by market cap.

Logan Rane
2 years ago
I questioned Chat-GPT for advice on the top nonfiction books. Here's What It Suggests
You have to use it.

Chat-GPT is a revolution.
All social media outlets are discussing it. How it will impact the future and different things.
True.
I've been using Chat-GPT for a few days, and it's a rare revolution. It's amazing and will only improve.
I asked Chat-GPT about the best non-fiction books. It advised this, albeit results rely on interests.
The Immortal Life of Henrietta Lacks
by Rebecca Skloot
Science, Biography
A impoverished tobacco farmer dies of cervical cancer in The Immortal Life of Henrietta Lacks. Her cell strand helped scientists treat polio and other ailments.
Rebecca Skloot discovers about Henrietta, her family, how the medical business exploited black Americans, and how her cells can live forever in a fascinating and surprising research.
You ought to read it.
if you want to discover more about the past of medicine.
if you want to discover more about American history.
Bad Blood: Secrets and Lies in a Silicon Valley Startup
by John Carreyrou
Tech, Bio
Bad Blood tells the terrifying story of how a Silicon Valley tech startup's blood-testing device placed millions of lives at risk.
John Carreyrou, a Pulitzer Prize-winning journalist, wrote this book.
Theranos and its wunderkind CEO, Elizabeth Holmes, climbed to popularity swiftly and then plummeted.
You ought to read it.
if you are a start-up employee.
specialists in medicine.
The Power of Now: A Guide to Spiritual Enlightenment
by Eckhart Tolle
Self-improvement, Spirituality
The Power of Now shows how to stop suffering and attain inner peace by focusing on the now and ignoring your mind.
The book also helps you get rid of your ego, which tries to control your ideas and actions.
If you do this, you may embrace the present, reduce discomfort, strengthen relationships, and live a better life.
You ought to read it.
if you're looking for serenity and illumination.
If you believe that you are ruining your life, stop.
if you're not happy.
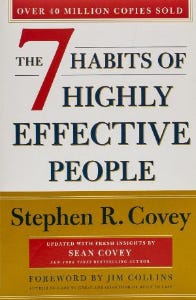
The 7 Habits of Highly Effective People
by Stephen R. Covey
Profession, Success
The 7 Habits of Highly Effective People is an iconic self-help book.
This vital book offers practical guidance for personal and professional success.
This non-fiction book is one of the most popular ever.
You ought to read it.
if you want to reach your full potential.
if you want to discover how to achieve all your objectives.
if you are just beginning your journey toward personal improvement.
Sapiens: A Brief History of Humankind
by Yuval Noah Harari
Science, History
Sapiens explains how our species has evolved from our earliest ancestors to the technology age.
How did we, a species of hairless apes without tails, come to control the whole planet?
It describes the shifts that propelled Homo sapiens to the top.
You ought to read it.
if you're interested in discovering our species' past.
if you want to discover more about the origins of human society and culture.
Hannah Elliott
3 years ago
Pebble Beach Auto Auctions Set $469M Record
The world's most prestigious vintage vehicle show included amazing autos and record-breaking sums.

This 1932 Duesenberg J Figoni Sports Torpedo earned Best of Show in 2022.
David Paul Morris (DPM)/Bloomberg
2022 Pebble Beach Concours d'Elegance winner was a pre-war roadster.
Lee Anderson's 1932 Duesenberg J Figoni Sports Torpedo won Best of Show at Pebble Beach Golf Links near Carmel, Calif., on Sunday. First American win since 2013.
Sandra Button, chairperson of the annual concours, said the car, whose chassis and body had been separated for years, "marries American force with European style." "Its resurrection story is passionate."
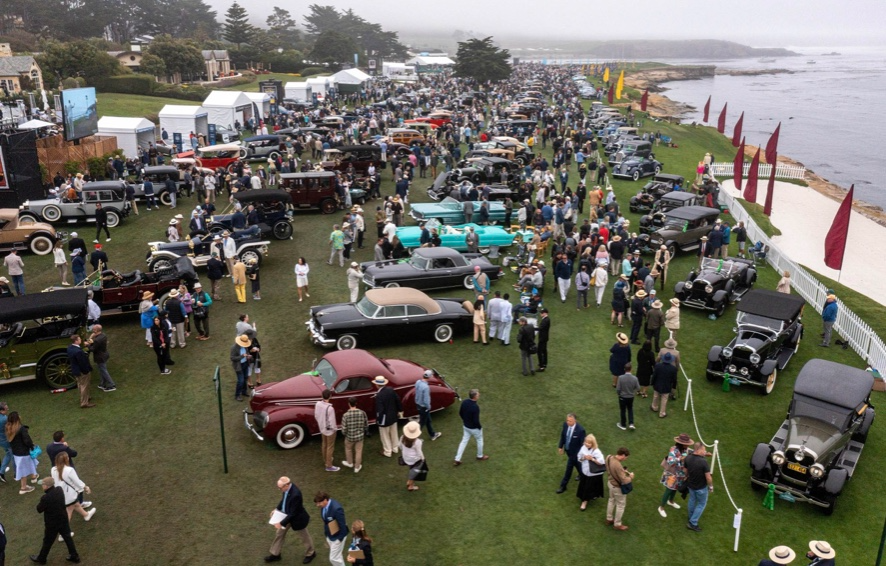
Pebble Beach Concours d'Elegance Auction
Since 1950, the Pebble Beach Concours d'Elegance has welcomed the world's most costly collectable vehicles for a week of parties, auctions, rallies, and high-roller meetings. The cold, dreary weather highlighted the automobiles' stunning lines and hues.
DPM/Bloomberg

A visitor photographs a 1948 Ferrari 166 MM Touring Barchetta. This is one of 25 Ferraris manufactured in the years after World War II. First shown at the 1948 Turin Salon. Others finished Mille Miglia and Le Mans, which set the tone for Ferrari racing for years.
DPM/Bloomberg
This year's frontrunners were ultra-rare pre-war and post-war automobiles with long and difficult titles, such a 1937 Talbot-Lago T150C-SS Figoni & Falaschi Teardrop Coupe and a 1951 Talbot-Lago T26 Grand Sport Stabilimenti Farina Cabriolet.
The hefty, enormous coaches inspire visions of golden pasts when mysterious saloons swept over the road with otherworldly style, speed, and grace. Only the richest and most powerful people, like Indian maharaja and Hollywood stars, owned such vehicles.
Antonio Chopitea, a Peruvian sugar tycoon, ordered a new Duesenberg in Paris. Hemmings says the two-tone blue beauty was moved to the US and dismantled in the 1960s. Body and chassis were sold separately and rejoined decades later in a three-year, prize-winning restoration.
The concours is the highlight of Monterey Car Week, a five-day Super Bowl for car enthusiasts. Early events included Porsche and Ferrari displays, antique automobile races, and new-vehicle debuts. Many auto executives call Monterey Car Week the "new auto show."
Many visitors were drawn to the record-breaking auctions.

A 1969 Porsche 908/02 auctioned for $4.185 million. Flat-eight air-cooled engine, 90.6-inch wheelbase, 1,320-pound weight. Vic Elford, Richard Attwood, Rudi Lins, Gérard Larrousse, Kurt Ahrens Jr., Masten Gregory, and Pedro Rodriguez drove it, according to Gooding.
DPM/Bloomberg
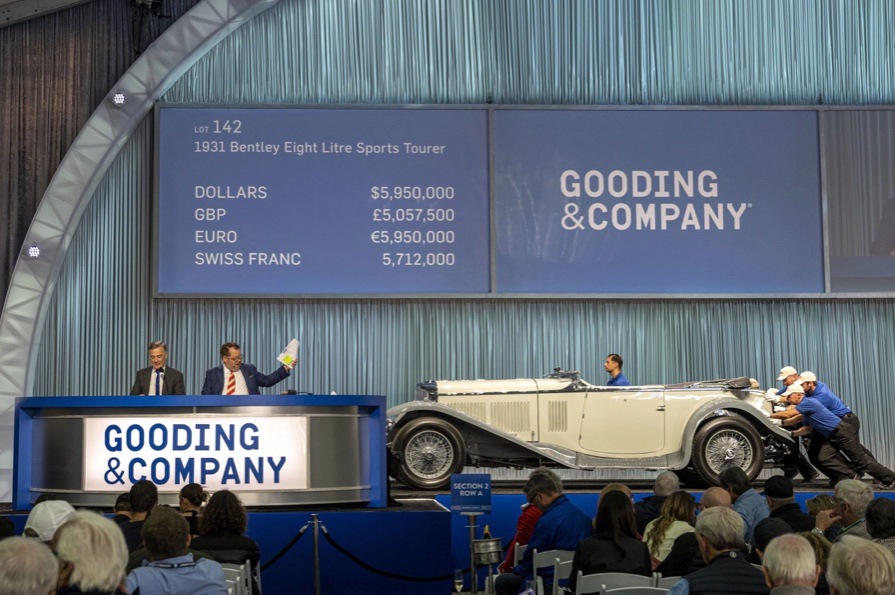
The 1931 Bentley Eight Liter Sports Tourer doesn't meet its reserve. Gooding & Co., the official auction house of the concours, made more than $105 million and had an 82% sell-through rate. This powerful open-top tourer is one of W.O. Bentley's 100 automobiles. Only 80 remain.
DPM/Bloomberg
The final auction on Aug. 21 brought in $456.1 million, breaking the previous high of $394.48 million established in 2015 in Monterey. “The week put an exclamation point on what has been an exceptional year for the collector automobile market,” Hagerty analyst John Wiley said.
Many cars that go unsold at public auction are sold privately in the days after. After-sales pushed the week's haul to $469 million on Aug. 22, up 18.9% from 2015's record.
In today's currencies, 2015's record sales amount to $490 million, Wiley noted. The dollar is degrading faster than old autos.
Still, 113 million-dollar automobiles sold. The average car sale price was $583,211, up from $446,042 last year, while multimillion-dollar hammer prices made up around 75% of total sales.
Industry insiders and market gurus expected that stock market volatility, the crisis in Ukraine, and the dollar-euro exchange rate wouldn't influence the world's biggest spenders.
Classic.com's CEO said there's no hint of a recession in an e-mail. Big sales and crowds.

Ticket-holders wore huge hats, flowery skirts, and other Kentucky Derby-esque attire. Coffee, beverages, and food are extra.
DPM/Bloomberg
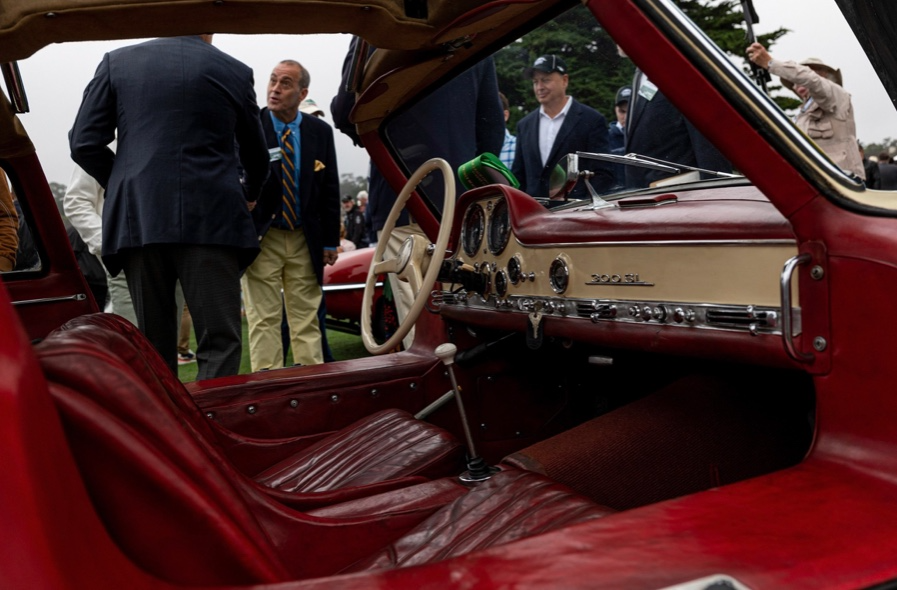
Mercedes-Benz 300 SL Gullwing, 1955. Mercedes produced the two-seat gullwing coupe from 1954–1957 and the roadster from 1957–1963. It was once West Germany's fastest and most powerful automobile. You'd be hard-pressed to locate one for less $1 million.
DPM/Bloomberg
1955 Ferrari 410 Sport sold for $22 million at RM Sotheby's. It sold a 1937 Mercedes-Benz 540K Sindelfingen Roadster for $9.9 million and a 1924 Hispano-Suiza H6C Transformable Torpedo for $9.245 million. The family-run mansion sold $221.7 million with a 90% sell-through rate, up from $147 million in 2021. This year, RM Sotheby's cars averaged $1.3 million.
Not everyone saw such great benefits.
Gooding & Co., the official auction house of the concours, made more than $105 million and had an 82% sell-through rate. 1937 Bugatti Type 57SC Atalante, 1990 Ferrari F40, and 1994 Bugatti EB110 Super Sport were top sellers.

The 1969 Autobianchi A112 Bertone. This idea two-seater became a Hot Wheels toy but was never produced. It has a four-speed manual drive and an inline-four mid-engine arrangement like the Lamborghini Miura.
DPM/Bloomberg
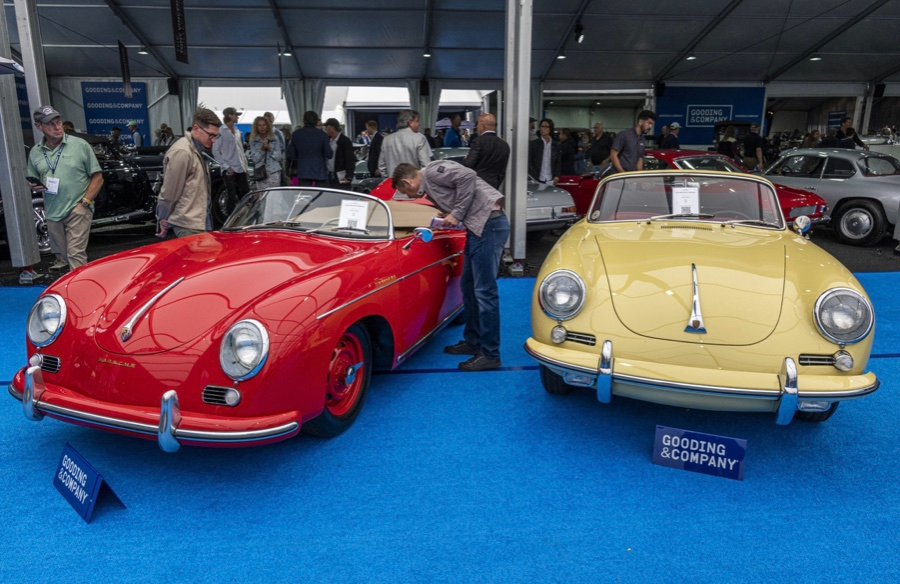
1956 Porsche 356 A Speedster at Gooding & Co. The Porsche 356 is a lightweight, rear-engine, rear-wheel drive vehicle that lacks driving power but is loved for its rounded, Beetle-like hardtop coupé and open-top versions.
DPM/Bloomberg
Mecum sold $50.8 million with a 64% sell-through rate, down from $53.8 million and 77% in 2021. Its top lot, a 1958 Ferrari 250 GT 'Tour de France' Alloy Coupe, sold for $2.86 million, but its average price was $174,016.
Bonhams had $27.8 million in sales with an 88% sell-through rate. The same sell-through generated $35.9 million in 2021.
Gooding & Co. and RM Sotheby's posted all 10 top sales, leaving Bonhams, Mecum, and Hagerty-owned Broad Arrow fighting for leftovers. Six of the top 10 sellers were Ferraris, which remain the gold standard for collectable automobiles. Their prices have grown over decades.
Classic.com's Calle claimed RM Sotheby's "stole the show," but "BroadArrow will be a force to reckon with."
Although pre-war cars were hot, '80s and '90s cars showed the most appreciation and attention. Generational transition and new buyer profile."
2022 Pebble Beach Concours d'Elegance judges inspect 1953 Siata 208. The rounded coupe was introduced at the 1952 Turin Auto Show in Italy and is one of 18 ever produced. It sports a 120hp Fiat engine, five-speed manual transmission, and alloy drum brakes. Owners liked their style, but not their reliability.
DPM/Bloomberg
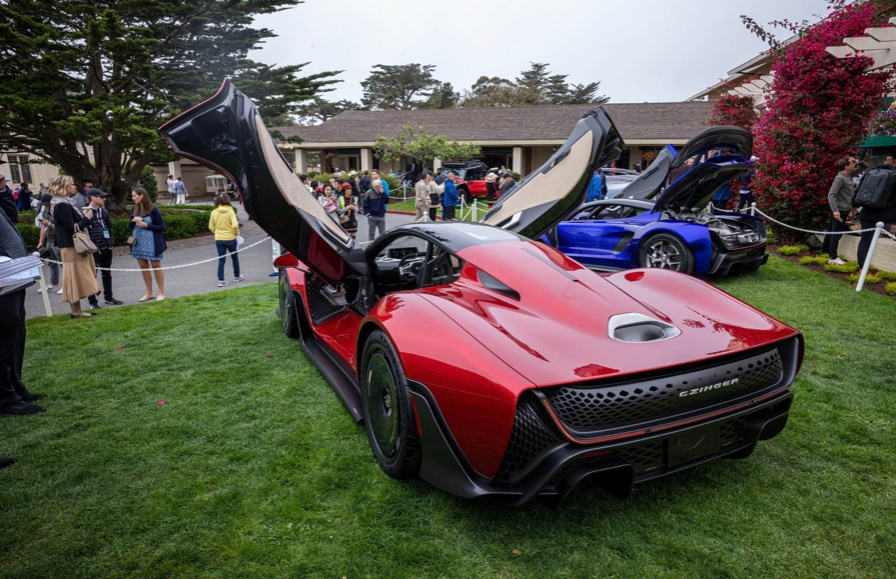
The Czinger 21 CV Max at Pebble Beach. Monterey Car Week concentrates on historic and classic automobiles, but modern versions like this Czinger hypercar also showed.
DPM/Bloomberg
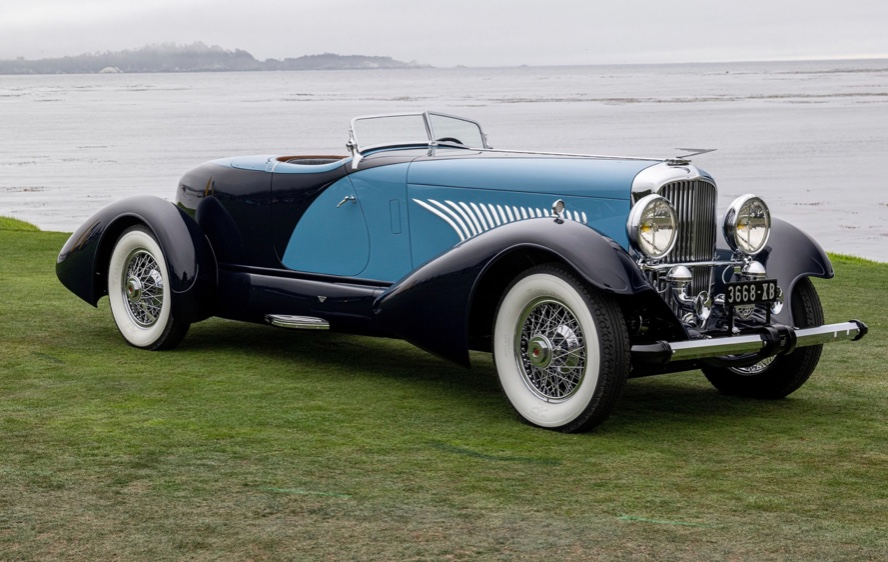
The 1932 Duesenberg J Figoni Sports Torpedo won Best in Show in 2022. Lee and Penny Anderson of Naples, Fla., own the once-separate-chassis-from-body automobile.
DPM/Bloomberg