


More on Entrepreneurship/Creators

Sanjay Priyadarshi
3 years ago
Meet a Programmer Who Turned Down Microsoft's $10,000,000,000 Acquisition Offer
Failures inspire young developers
Jason citron created many products.
These products flopped.
Microsoft offered $10 billion for one of these products.
He rejected the offer since he was so confident in his success.
Let’s find out how he built a product that is currently valued at $15 billion.
Early in his youth, Jason began learning to code.
Jason's father taught him programming and IT.
His father wanted to help him earn money when he needed it.
Jason created video games and websites in high school.
Jason realized early on that his IT and programming skills could make him money.
Jason's parents misjudged his aptitude for programming.
Jason frequented online programming communities.
He looked for web developers. He created websites for those people.
His parents suspected Jason sold drugs online. When he said he used programming to make money, they were shocked.
They helped him set up a PayPal account.
Florida higher education to study video game creation
Jason never attended an expensive university.
He studied game design in Florida.
“Higher Education is an interesting part of society… When I work with people, the school they went to never comes up… only thing that matters is what can you do…At the end of the day, the beauty of silicon valley is that if you have a great idea and you can bring it to the life, you can convince a total stranger to give you money and join your project… This notion that you have to go to a great school didn’t end up being a thing for me.”
Jason's life was altered by Steve Jobs' keynote address.
After graduating, Jason joined an incubator.
Jason created a video-dating site first.
Bad idea.
Nobody wanted to use it when it was released, so they shut it down.
He made a multiplayer game.
It was released on Bebo. 10,000 people played it.
When Steve Jobs unveiled the Apple app store, he stopped playing.
The introduction of the app store resembled that of a new gaming console.
Jason's life altered after Steve Jobs' 2008 address.
“Whenever a new video game console is launched, that’s the opportunity for a new video game studio to get started, it’s because there aren’t too many games available…When a new PlayStation comes out, since it’s a new system, there’s only a handful of titles available… If you can be a launch title you can get a lot of distribution.”
Apple's app store provided a chance to start a video game company.
They released an app after 5 months of work.
Aurora Feint is the game.
Jason believed 1000 players in a week would be wonderful. A thousand players joined in the first hour.
Over time, Aurora Feints' game didn't gain traction. They don't make enough money to keep playing.
They could only make enough for one month.
Instead of buying video games, buy technology
Jason saw that they established a leaderboard, chat rooms, and multiplayer capabilities and believed other developers would want to use these.
They opted to sell the prior game's technology.
OpenFeint.
Assisting other game developers
They had no money in the bank to create everything needed to make the technology user-friendly.
Jason and Daniel designed a website saying:
“If you’re making a video game and want to have a drop in multiplayer support, you can use our system”
TechCrunch covered their website launch, and they gained a few hundred mailing list subscribers.
They raised seed funding with the mailing list.
Nearly all iPhone game developers started adopting the Open Feint logo.
“It was pretty wild… It was really like a whole social platform for people to play with their friends.”
What kind of a business model was it?
OpenFeint originally planned to make the software free for all games. As the game gained popularity, they demanded payment.
They later concluded it wasn't a good business concept.
It became free eventually.
Acquired for $104 million
Open Feint's users and employees grew tremendously.
GREE bought OpenFeint for $104 million in April 2011.
GREE initially committed to helping Jason and his team build a fantastic company.
Three or four months after the acquisition, Jason recognized they had a different vision.
He quit.
Jason's Original Vision for the iPad
Jason focused on distribution in 2012 to help businesses stand out.
The iPad market and user base were growing tremendously.
Jason said the iPad may replace mobile gadgets.
iPad gamers behaved differently than mobile gamers.
People sat longer and experienced more using an iPad.
“The idea I had was what if we built a gaming business that was more like traditional video games but played on tablets as opposed to some kind of mobile game that I’ve been doing before.”
Unexpected insight after researching the video game industry
Jason learned from studying the gaming industry that long-standing companies had advantages beyond a single release.
Previously, long-standing video game firms had their own distribution system. This distribution strategy could buffer time between successful titles.
Sony, Microsoft, and Valve all have gaming consoles and online stores.
So he built a distribution system.
He created a group chat app for gamers.
He envisioned a team-based multiplayer game with text and voice interaction.
His objective was to develop a communication network, release more games, and start a game distribution business.
Remaking the video game League of Legends
Jason and his crew reimagined a League of Legends game mode for 12-inch glass.
They adapted the game for tablets.
League of Legends was PC-only.
So they rebuilt it.
They overhauled the game and included native mobile experiences to stand out.
Hammer and Chisel was the company's name.
18 people worked on the game.
The game was funded. The game took 2.5 years to make.
Was the game a success?
July 2014 marked the game's release. The team's hopes were dashed.
Critics initially praised the game.
Initial installation was widespread.
The game failed.
As time passed, the team realized iPad gaming wouldn't increase much and mobile would win.
Jason was given a fresh idea by Stan Vishnevskiy.
Stan Vishnevskiy was a corporate engineer.
He told Jason about his plan to design a communication app without a game.
This concept seeded modern strife.
“The insight that he really had was to put a couple of dots together… we’re seeing our customers communicating around our own game with all these different apps and also ourselves when we’re playing on PC… We should solve that problem directly rather than needing to build a new game…we should start making it on PC.”
So began Discord.
Online socializing with pals was the newest trend.
Jason grew up playing video games with his friends.
He never played outside.
Jason had many great moments playing video games with his closest buddy, wife, and brother.
Discord was about providing a location for you and your group to speak and hang out.
Like a private cafe, bedroom, or living room.
Discord was developed for you and your friends on computers and phones.
You can quickly call your buddies during a game to conduct a conference call. Put the call on speaker and talk while playing.
Discord wanted to give every player a unique experience. Because coordinating across apps was a headache.
The entire team started concentrating on Discord.
Jason decided Hammer and Chisel would focus on their chat app.
Jason didn't want to make a video game.
How Discord attracted the appropriate attention
During the first five months, the entire team worked on the game and got feedback from friends.
This ensures product improvement. As a result, some teammates' buddies started utilizing Discord.
The team knew it would become something, but the result was buggy. App occasionally crashed.
Jason persuaded a gamer friend to write on Reddit about the software.
New people would find Discord. Why not?
Reddit users discovered Discord and 50 started using it frequently.
Discord was launched.
Rejecting the $10 billion acquisition proposal
Discord has increased in recent years.
It sends billions of messages.
Discord's users aren't tracked. They're privacy-focused.
Purchase offer
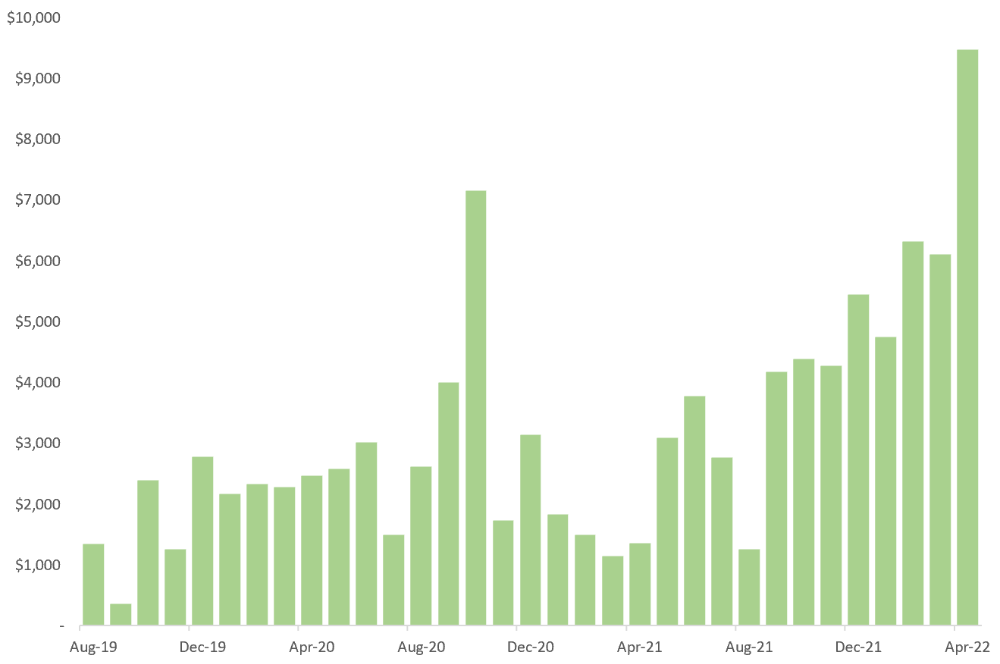
Covid boosted Discord's user base.
Weekly, billions of messages were transmitted.
Microsoft offered $10 billion for Discord in 2021.
Jason sold Open Feint for $104m in 2011.
This time, he believed in the product so much that he rejected Microsoft's offer.
“I was talking to some people in the team about which way we could go… The good thing was that most of the team wanted to continue building.”
Last time, Discord was valued at $15 billion.
Discord raised money on March 12, 2022.
The $15 billion corporation raised $500 million in 2021.
Sanjay Priyadarshi
3 years ago
Using Ruby code, a programmer created a $48,000,000,000 product that Elon Musk admired.
Unexpected Success

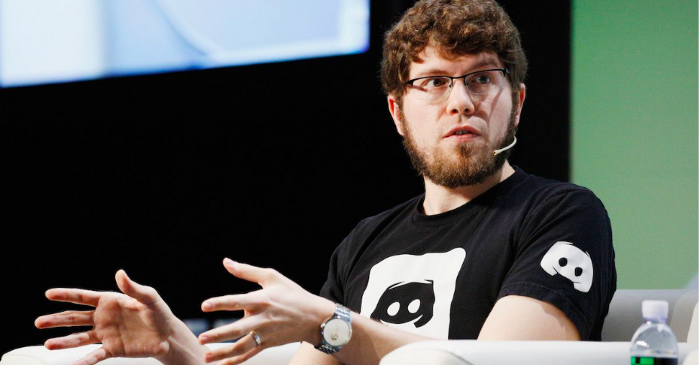
Shopify CEO and co-founder Tobias Lutke. Shopify is worth $48 billion.
World-renowned entrepreneur Tobi
Tobi never expected his first online snowboard business to become a multimillion-dollar software corporation.
Tobi founded Shopify to establish a 20-person company.
The publicly traded corporation employs over 10,000 people.
Here's Tobi Lutke's incredible story.
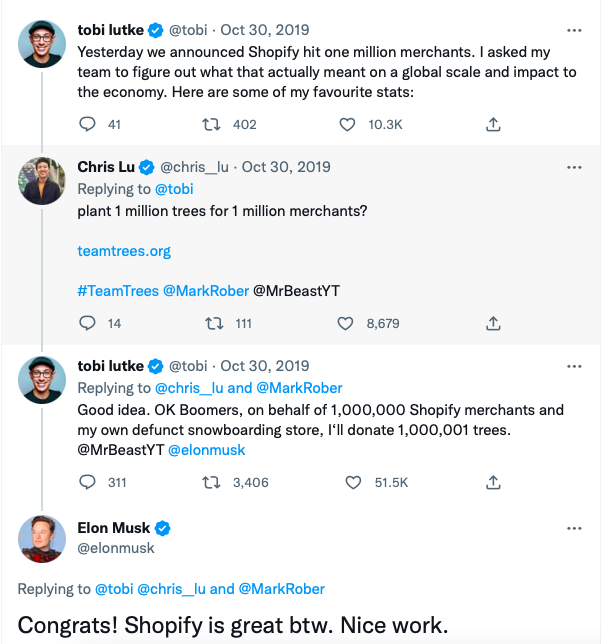
Elon Musk tweeted his admiration for the Shopify creator.
30-October-2019.
Musk praised Shopify founder Tobi Lutke on Twitter.
Happened:
Explore this programmer's journey.
What difficulties did Tobi experience as a young child?
Germany raised Tobi.
Tobi's parents realized he was smart but had trouble learning as a toddler.
Tobi was learning disabled.
Tobi struggled with school tests.
Tobi's learning impairments were undiagnosed.
Tobi struggled to read as a dyslexic.
Tobi also found school boring.
Germany's curriculum didn't inspire Tobi's curiosity.
“The curriculum in Germany was taught like here are all the solutions you might find useful later in life, spending very little time talking about the problem…If I don’t understand the problem I’m trying to solve, it’s very hard for me to learn about a solution to a problem.”
Studying computer programming
After tenth grade, Tobi decided school wasn't for him and joined a German apprenticeship program.
This curriculum taught Tobi software engineering.
He was an apprentice in a small Siemens subsidiary team.
Tobi worked with rebellious Siemens employees.
Team members impressed Tobi.
Tobi joined the team for this reason.
Tobi was pleased to get paid to write programming all day.
His life could not have been better.
Devoted to snowboarding
Tobi loved snowboarding.
He drove 5 hours to ski at his folks' house.
His friends traveled to the US to snowboard when he was older.
However, the cheap dollar conversion rate led them to Canada.
2000.
Tobi originally decided to snowboard instead than ski.
Snowboarding captivated him in Canada.
On the trip to Canada, Tobi encounters his wife.
Tobi meets his wife Fiona McKean on his first Canadian ski trip.
They maintained in touch after the trip.
Fiona moved to Germany after graduating.
Tobi was a startup coder.
Fiona found work in Germany.
Her work included editing, writing, and academics.
“We lived together for 10 months and then she told me that she need to go back for the master's program.”
With Fiona, Tobi immigrated to Canada.
Fiona invites Tobi.
Tobi agreed to move to Canada.
Programming helped Tobi move in with his girlfriend.
Tobi was an excellent programmer, therefore what he did in Germany could be done anywhere.
He worked remotely for his German employer in Canada.
Tobi struggled with remote work.
Due to poor communication.
No slack, so he used email.
Programmers had trouble emailing.
Tobi's startup was developing a browser.
After the dot-com crash, individuals left that startup.
It ended.
Tobi didn't intend to work for any major corporations.
Tobi left his startup.
He believed he had important skills for any huge corporation.
He refused to join a huge corporation.
Because of Siemens.
Tobi learned to write professional code and about himself while working at Siemens in Germany.
Siemens culture was odd.
Employees were distrustful.
Siemens' rigorous dress code implies that the corporation doesn't trust employees' attire.
It wasn't Tobi's place.
“There was so much bad with it that it just felt wrong…20-year-old Tobi would not have a career there.”
Focused only on snowboarding
Tobi lived in Ottawa with his girlfriend.
Canada is frigid in winter.
Ottawa's winters last.
Almost half a year.
Tobi wanted to do something worthwhile now.
So he snowboarded.
Tobi began snowboarding seriously.
He sought every snowboarding knowledge.
He researched the greatest snowboarding gear first.
He created big spreadsheets for snowboard-making technologies.
Tobi grew interested in selling snowboards while researching.
He intended to sell snowboards online.
He had no choice but to start his own company.
A small local company offered Tobi a job.
Interested.
He must sign papers to join the local company.
He needed a work permit when he signed the documents.
Tobi had no work permit.
He was allowed to stay in Canada while applying for permanent residency.
“I wasn’t illegal in the country, but my state didn’t give me a work permit. I talked to a lawyer and he told me it’s going to take a while until I get a permanent residency.”
Tobi's lawyer told him he cannot get a work visa without permanent residence.
His lawyer said something else intriguing.
Tobis lawyer advised him to start a business.
Tobi declined this local company's job offer because of this.
Tobi considered opening an internet store with his technical skills.
He sold snowboards online.
“I was thinking of setting up an online store software because I figured that would exist and use it as a way to sell snowboards…make money while snowboarding and hopefully have a good life.”
What brought Tobi and his co-founder together, and how did he support Tobi?
Tobi lived with his girlfriend's parents.
In Ottawa, Tobi encounters Scott Lake.
Scott was Tobis girlfriend's family friend and worked for Tobi's future employer.
Scott and Tobi snowboarded.
Tobi pitched Scott his snowboard sales software idea.
Scott liked the idea.
They planned a business together.
“I was looking after the technology and Scott was dealing with the business side…It was Scott who ended up developing relationships with vendors and doing all the business set-up.”
Issues they ran into when attempting to launch their business online
Neither could afford a long-term lease.
That prompted their online business idea.
They would open a store.
Tobi anticipated opening an internet store in a week.
Tobi seeks open-source software.
Most existing software was pricey.
Tobi and Scott couldn't afford pricey software.
“In 2004, I was sitting in front of my computer absolutely stunned realising that we hadn’t figured out how to create software for online stores.”
They required software to:
to upload snowboard images to the website.
people to look up the types of snowboards that were offered on the website. There must be a search feature in the software.
Online users transmit payments, and the merchant must receive them.
notifying vendors of the recently received order.
No online selling software existed at the time.
Online credit card payments were difficult.
How did they advance the software while keeping expenses down?
Tobi and Scott needed money to start selling snowboards.
Tobi and Scott funded their firm with savings.
“We both put money into the company…I think the capital we had was around CAD 20,000(Canadian Dollars).”
Despite investing their savings.
They minimized costs.
They tried to conserve.
No office rental.
They worked in several coffee shops.
Tobi lived rent-free at his girlfriend's parents.
He installed software in coffee cafes.
How were the software issues handled?
Tobi found no online snowboard sales software.
Two choices remained:
Change your mind and try something else.
Use his programming expertise to produce something that will aid in the expansion of this company.
Tobi knew he was the sole programmer working on such a project from the start.
“I had this realisation that I’m going to be the only programmer who has ever worked on this, so I don’t have to choose something that lots of people know. I can choose just the best tool for the job…There is been this programming language called Ruby which I just absolutely loved ”
Ruby was open-source and only had Japanese documentation.
Latin is the source code.
Tobi used Ruby twice.
He assumed he could pick the tool this time.
Why not build with Ruby?
How did they find their first time operating a business?
Tobi writes applications in Ruby.
He wrote the initial software version in 2.5 months.
Tobi and Scott founded Snowdevil to sell snowboards.
Tobi coded for 16 hours a day.
His lifestyle was unhealthy.
He enjoyed pizza and coke.
“I would never recommend this to anyone, but at the time there was nothing more interesting to me in the world.”
Their initial purchase and encounter with it
Tobi worked in cafes then.
“I was working in a coffee shop at this time and I remember everything about that day…At some time, while I was writing the software, I had to type the email that the software would send to tell me about the order.”
Tobi recalls everything.
He checked the order on his laptop at the coffee shop.
Pennsylvanian ordered snowboard.
Tobi walked home and called Scott. Tobi told Scott their first order.
They loved the order.
How were people made aware about Snowdevil?
2004 was very different.
Tobi and Scott attempted simple website advertising.
Google AdWords was new.
Ad clicks cost 20 cents.
Online snowboard stores were scarce at the time.
Google ads propelled the snowdevil brand.
Snowdevil prospered.
They swiftly recouped their original investment in the snowboard business because to its high profit margin.
Tobi and Scott struggled with inventories.
“Snowboards had really good profit margins…Our biggest problem was keeping inventory and getting it back…We were out of stock all the time.”
Selling snowboards returned their investment and saved them money.
They did not appoint a business manager.
They accomplished everything alone.
Sales dipped in the spring, but something magical happened.
Spring sales plummeted.
They considered stocking different boards.
They naturally wanted to add boards and grow the business.
However, magic occurred.
Tobi coded and improved software while running Snowdevil.
He modified software constantly. He wanted speedier software.
He experimented to make the software more resilient.
Tobi received emails requesting the Snowdevil license.
They intended to create something similar.
“I didn’t stop programming, I was just like Ok now let me try things, let me make it faster and try different approaches…Increasingly I got people sending me emails and asking me If I would like to licence snowdevil to them. People wanted to start something similar.”
Software or skateboards, your choice
Scott and Tobi had to choose a hobby in 2005.
They might sell alternative boards or use software.
The software was a no-brainer from demand.
Daniel Weinand is invited to join Tobi's business.
Tobis German best friend is Daniel.
Tobi and Scott chose to use the software.
Tobi and Scott kept the software service.
Tobi called Daniel to invite him to Canada to collaborate.
Scott and Tobi had quit snowboarding until then.
How was Shopify launched, and whence did the name come from?
The three chose Shopify.
Named from two words.
First:
Shop
Final part:
Simplify
Shopify
Shopify's crew has always had one goal:
creating software that would make it simple and easy for people to launch online storefronts.
Launched Shopify after raising money for the first time.
Shopify began fundraising in 2005.
First, they borrowed from family and friends.
They needed roughly $200k to run the company efficiently.
$200k was a lot then.
When questioned why they require so much money. Tobi told them to trust him with their goals. The team raised seed money from family and friends.
Shopify.com has a landing page. A demo of their goal was on the landing page.
In 2006, Shopify had about 4,000 emails.
Shopify rented an Ottawa office.
“We sent a blast of emails…Some people signed up just to try it out, which was exciting.”
How things developed after Scott left the company
Shopify co-founder Scott Lake left in 2008.
Scott was CEO.
“He(Scott) realized at some point that where the software industry was going, most of the people who were the CEOs were actually the highly technical person on the founding team.”
Scott leaving the company worried Tobi.
Tobis worried about finding a new CEO.
To Tobi:
A great VC will have the network to identify the perfect CEO for your firm.
Tobi started visiting Silicon Valley to meet with venture capitalists to recruit a CEO.
Initially visiting Silicon Valley
Tobi came to Silicon Valley to start a 20-person company.
This company creates eCommerce store software.
Tobi never wanted a big corporation. He desired a fulfilling existence.
“I stayed in a hostel in the Bay Area. I had one roommate who was also a computer programmer. I bought a bicycle on Craiglist. I was there for a week, but ended up staying two and a half weeks.”
Tobi arrived unprepared.
When venture capitalists asked him business questions.
He answered few queries.
Tobi didn't comprehend VC meetings' terminology.
He wrote the terms down and looked them up.
Some were fascinated after he couldn't answer all these queries.
“I ended up getting the kind of term sheets people dream about…All the offers were conditional on moving our company to Silicon Valley.”
Canada received Tobi.
He wanted to consult his team before deciding. Shopify had five employees at the time.
2008.
A global recession greeted Tobi in Canada. The recession hurt the market.
His term sheets were useless.
The economic downturn in the world provided Shopify with a fantastic opportunity.
The global recession caused significant job losses.
Fired employees had several ideas.
They wanted online stores.
Entrepreneurship was desired. They wanted to quit work.
People took risks and tried new things during the global slump.
Shopify subscribers skyrocketed during the recession.
“In 2009, the company reached neutral cash flow for the first time…We were in a position to think about long-term investments, such as infrastructure projects.”
Then, Tobi Lutke became CEO.
How did Tobi perform as the company's CEO?
“I wasn’t good. My team was very patient with me, but I had a lot to learn…It’s a very subtle job.”
2009–2010.
Tobi limited the company's potential.
He deliberately restrained company growth.
Tobi had one costly problem:
Whether Shopify is a venture or a lifestyle business.
The company's annual revenue approached $1 million.
Tobi battled with the firm and himself despite good revenue.
His wife was supportive, but the responsibility was crushing him.
“It’s a crushing responsibility…People had families and kids…I just couldn’t believe what was going on…My father-in-law gave me money to cover the payroll and it was his life-saving.”
Throughout this trip, everyone supported Tobi.
They believed it.
$7 million in donations received
Tobi couldn't decide if this was a lifestyle or a business.
Shopify struggled with marketing then.
Later, Tobi tried 5 marketing methods.
He told himself that if any marketing method greatly increased their growth, he would call it a venture, otherwise a lifestyle.
The Shopify crew brainstormed and voted on marketing concepts.
Tested.
“Every single idea worked…We did Adwords, published a book on the concept, sponsored a podcast and all the ones we tracked worked.”
To Silicon Valley once more
Shopify marketing concepts worked once.
Tobi returned to Silicon Valley to pitch investors.
He raised $7 million, valuing Shopify at $25 million.
All investors had board seats.
“I find it very helpful…I always had a fantastic relationship with everyone who’s invested in my company…I told them straight that I am not going to pretend I know things, I want you to help me.”
Tobi developed skills via running Shopify.
Shopify had 20 employees.
Leaving his wife's parents' home
Tobi left his wife's parents in 2014.
Tobi had a child.
Shopify has 80,000 customers and 300 staff in 2013.
Public offering in 2015
Shopify investors went public in 2015.
Shopify powers 4.1 million e-Commerce sites.
Shopify stores are 65% US-based.
It is currently valued at $48 billion.

Alex Mathers
25 years ago
400 articles later, nobody bothered to read them.

Writing for readers:
14 years of daily writing.
I post practically everything on social media. I authored hundreds of articles, thousands of tweets, and numerous volumes to almost no one.
Tens of thousands of readers regularly praise me.
I despised writing. I'm stuck now.
I've learned what readers like and what doesn't.
Here are some essential guidelines for writing with impact:
Readers won't understand your work if you can't.
Though obvious, this slipped me up. Share your truths.
Stories engage human brains.
Showing the journey of a person from worm to butterfly inspires the human spirit.
Overthinking hinders powerful writing.
The best ideas come from inner understanding in between thoughts.
Avoid writing to find it. Write.
Writing a masterpiece isn't motivating.
Write for five minutes to simplify. Step-by-step, entertaining, easy steps.
Good writing requires a willingness to make mistakes.
So write loads of garbage that you can edit into a good piece.
Courageous writing.
A courageous story will move readers. Personal experience is best.
Go where few dare.
Templates, outlines, and boundaries help.
Limitations enhance writing.
Excellent writing is straightforward and readable, removing all the unnecessary fat.
Use five words instead of nine.
Use ordinary words instead of uncommon ones.
Readers desire relatability.
Too much perfection will turn it off.
Write to solve an issue if you can't think of anything to write.
Instead, read to inspire. Best authors read.
Every tweet, thread, and novel must have a central idea.
What's its point?
This can make writing confusing.
️ Don't direct your reader.
Readers quit reading. Demonstrate, describe, and relate.
Even if no one responds, have fun. If you hate writing it, the reader will too.
You might also like

Sammy Abdullah
3 years ago
How to properly price SaaS
Price Intelligently put out amazing content on pricing your SaaS product. This blog's link to the whole report is worth reading. Our key takeaways are below.

Don't base prices on the competition. Competitor-based pricing has clear drawbacks. Their pricing approach is yours. Your company offers customers something unique. Otherwise, you wouldn't create it. This strategy is static, therefore you can't add value by raising prices without outpricing competitors. Look, but don't touch is the competitor-based moral. You want to know your competitors' prices so you're in the same ballpark, but they shouldn't guide your selections. Competitor-based pricing also drives down prices.
Value-based pricing wins. This is customer-based pricing. Value-based pricing looks outward, not inward or laterally at competitors. Your clients are the best source of pricing information. By valuing customer comments, you're focusing on buyers. They'll decide if your pricing and packaging are right. In addition to asking consumers about cost savings or revenue increases, look at data like number of users, usage per user, etc.
Value-based pricing increases prices. As you learn more about the client and your worth, you'll know when and how much to boost rates. Every 6 months, examine pricing.
Cloning top customers. You clone your consumers by learning as much as you can about them and then reaching out to comparable people or organizations. You can't accomplish this without knowing your customers. Segmenting and reproducing them requires as much detail as feasible. Offer pricing plans and feature packages for 4 personas. The top plan should state Contact Us. Your highest-value customers want more advice and support.
Question your 4 personas. What's the one item you can't live without? Which integrations matter most? Do you do analytics? Is support important or does your company self-solve? What's too cheap? What's too expensive?
Not everyone likes per-user pricing. SaaS organizations often default to per-user analytics. About 80% of companies utilizing per-user pricing should use an alternative value metric because their goods don't give more value with more users, so charging for them doesn't make sense.
At least 3:1 LTV/CAC. Break even on the customer within 2 years, and LTV to CAC is greater than 3:1. Because customer acquisition costs are paid upfront but SaaS revenues accrue over time, SaaS companies face an early financial shortfall while paying back the CAC.
ROI should be >20:1. Indeed. Ensure the customer's ROI is 20x the product's cost. Microsoft Office costs $80 a year, but consumers would pay much more to maintain it.
A/B Testing. A/B testing is guessing. When your pricing page varies based on assumptions, you'll upset customers. You don't have enough customers anyway. A/B testing optimizes landing pages, design decisions, and other site features when you know the problem but not pricing.
Don't discount. It cheapens the product, makes it permanent, and increases churn. By discounting, you're ruining your pricing analysis.

Scott Galloway
3 years ago
Don't underestimate the foolish
ZERO GRACE/ZERO MALICE
Big companies and wealthy people make stupid mistakes too.
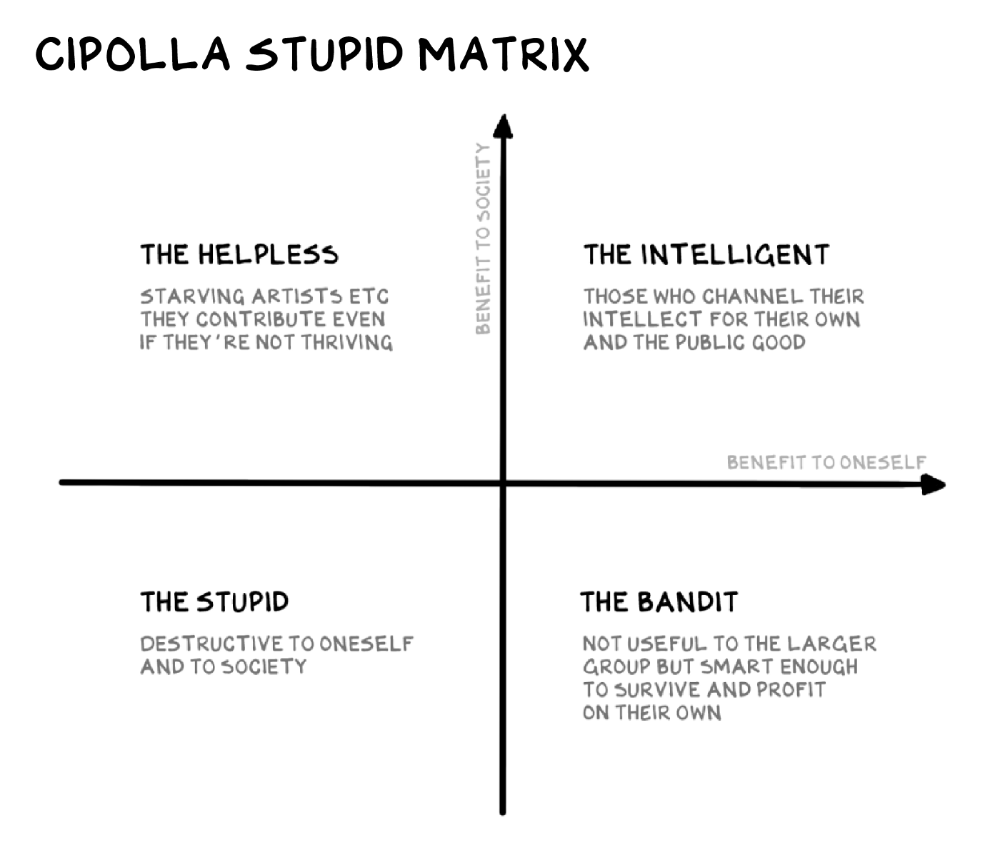
Your ancestors kept snakes and drank bad water. You (probably) don't because you've learnt from their failures via instinct+, the ultimate life-lessons streaming network in your head. Instincts foretell the future. If you approach a lion, it'll eat you. Our society's nuanced/complex decisions have surpassed instinct. Human growth depends on how we handle these issues. 80% of people believe they are above-average drivers, yet few believe they make many incorrect mistakes that make them risky. Stupidity hurts others like death. Basic Laws of Human Stupidity by Carlo Cipollas:
Everyone underestimates the prevalence of idiots in our society.
Any other trait a person may have has no bearing on how likely they are to be stupid.
A dumb individual is one who harms someone without benefiting themselves and may even lose money in the process.
Non-dumb people frequently underestimate how destructively powerful stupid people can be.
The most dangerous kind of person is a moron.
Professor Cippola defines stupid as bad for you and others. We underestimate the corporate world's and seemingly successful people's ability to make bad judgments that harm themselves and others. Success is an intoxication that makes you risk-aggressive and blurs your peripheral vision.
Stupid companies and decisions:
Big Dumber
Big-company bad ideas have more bulk and inertia. The world's most valuable company recently showed its board a VR headset. Jony Ive couldn't destroy Apple's terrible idea in 2015. Mr. Ive said that VR cut users off from the outer world, made them seem outdated, and lacked practical uses. Ives' design team doubted users would wear headsets for lengthy periods.
VR has cost tens of billions of dollars over a decade to prove nobody wants it. The next great SaaS startup will likely come from Florence, not Redmond or San Jose.
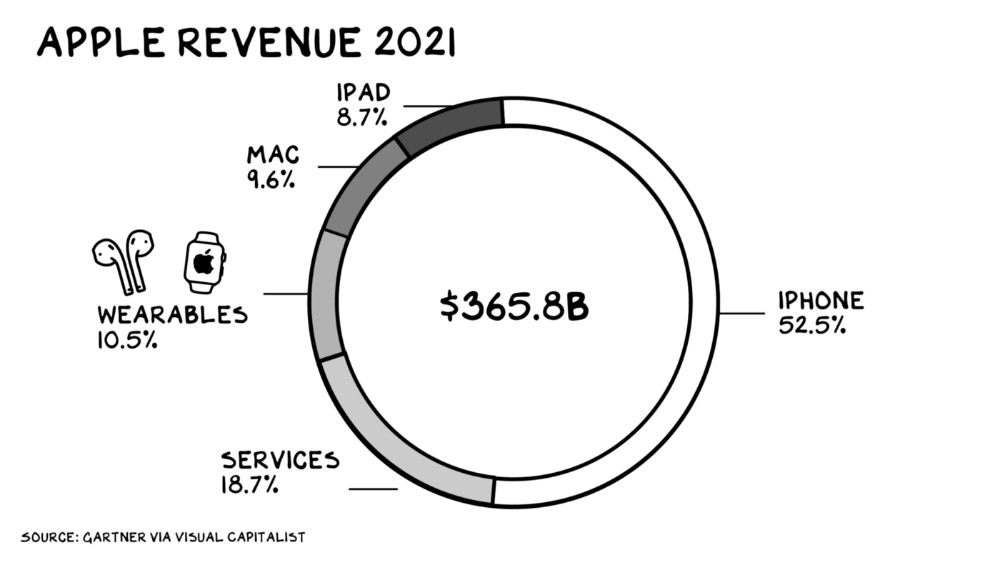
Apple Watch and Airpods have made the Cupertino company the world's largest jewelry maker. 10.5% of Apple's income, or $38 billion, comes from wearables in 2021. (seven times the revenue of Tiffany & Co.). Jewelry makes you more appealing and useful. Airpods and Apple Watch do both.
Headsets make you less beautiful and useful and promote isolation, loneliness, and unhappiness among American teenagers. My sons pretend they can't hear or see me when on their phones. VR headsets lack charisma.
Coinbase disclosed a plan to generate division and tension within its workplace weeks after Apple was pitched $2,000 smokes. The crypto-trading platform is piloting a program that rates staff after every interaction. If a coworker says anything you don't like, you should tell them how to improve. Everyone gets a 110-point scorecard. Coworkers should evaluate a person's rating while deciding whether to listen to them. It's ridiculous.
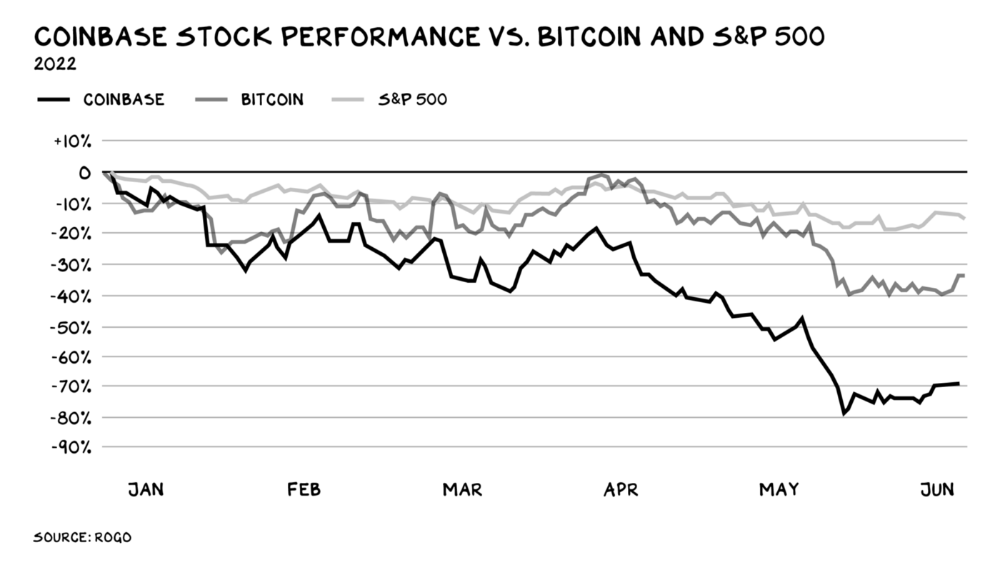
Organizations leverage our superpower of cooperation. This encourages non-cooperation, period. Bridgewater's founder Ray Dalio designed the approach to promote extreme transparency. Dalio has 223 billion reasons his managerial style works. There's reason to suppose only a small group of people, largely traders, will endure a granular scorecard. Bridgewater has 20% first-year turnover. Employees cry in bathrooms, and sex scandals are settled by ignoring individuals with poor believability levels. Coinbase might take solace that the stock is 80% below its initial offering price.
Poor Stupid
Fools' ledgers are valuable. More valuable are lists of foolish rich individuals.
Robinhood built a $8 billion corporation on financial ignorance. The firm's median account value is $240, and its stock has dropped 75% since last summer. Investors, customers, and society lose. Stupid. Luna published a comparable list on the blockchain, grew to $41 billion in market cap, then plummeted.
A podcast presenter is recruiting dentists and small-business owners to invest in Elon Musk's Twitter takeover. Investors pay a 7% fee and 10% of the upside for the chance to buy Twitter at a 35% premium to the current price. The proposal legitimizes CNBC's Trade Like Chuck advertising (Chuck made $4,600 into $460,000 in two years). This is stupid because it adds to the Twitter deal's desperation. Mr. Musk made an impression when he urged his lawyers to develop a legal rip-cord (There are bots on the platform!) to abandon the share purchase arrangement (for less than they are being marketed by the podcaster). Rolls-Royce may pay for this list of the dumb affluent because it includes potential Cullinan buyers.
Worst company? Flowcarbon, founded by WeWork founder Adam Neumann, operates at the convergence of carbon and crypto to democratize access to offsets and safeguard the earth's natural carbon sinks. Can I get an ayahuasca Big Gulp?
Neumann raised $70 million with their yogababble drink. More than half of the consideration came from selling GNT. Goddess Nature Token. I hope the company gets an S-1. Or I'll start a decentralized AI Meta Renewable NFTs company. My Community Based Ebitda coin will fund the company. Possible.
Stupidity inside oneself
This weekend, I was in NYC with my boys. My 14-year-old disappeared. He's realized I'm not cool and is mad I let the charade continue. When out with his dad, he likes to stroll home alone and depart before me. Friends told me hell would return, but I was surprised by how fast the eye roll came.
Not so with my 11-year-old. We went to The Edge, a Hudson Yards observation platform where you can see the city from 100 storeys up for $38. This is hell's seventh ring. Leaning into your boys' interests is key to engaging them (dad tip). Neither loves Crossfit, WW2 history, or antitrust law.
We take selfies on the Thrilling Glass Floor he spots. Dad, there's a bar! Coke? I nod, he rushes to the bar, stops, runs back for money, and sprints back. Sitting on stone seats, drinking Atlanta Champagne, he turns at me and asks, Isn't this amazing? I'll never reach paradise.
Later that night, the lads are asleep and I've had two Zacapas and Cokes. I SMS some friends about my day and how I feel about sons/fatherhood/etc. How I did. They responded and approached. The next morning, I'm sober, have distance from my son, and feel ashamed by my texts. Less likely to impulsively share my emotions with others. Stupid again.

Stephen Moore
3 years ago
Trading Volume on OpenSea Drops by 99% as the NFT Boom Comes to an End
Wasn't that a get-rich-quick scheme?

OpenSea processed $2.7 billion in NFT transactions in May 2021.
Fueled by a crypto bull run, rumors of unfathomable riches, and FOMO, Bored Apes, Crypto Punks, and other JPEG-format trash projects flew off the virtual shelves, snatched up by retail investors and celebrities alike.
Over a year later, those shelves are overflowing and warehouses are backlogged. Since March, I've been writing less. In May and June, the bubble was close to bursting.
Apparently, the boom has finally peaked.
This bubble has punctured, and deflation has begun. On Aug. 28, OpenSea processed $9.34 million.
From that euphoric high of $2.7 billion, $9.34 million represents a spectacular decline of 99%.
OpenSea contradicts the data. A trading platform spokeswoman stated the comparison is unfair because it compares the site's highest and lowest trading days. They're the perfect two data points to assess the drop. OpenSea chooses to use ETH volume measures, which ignore crypto's shifting price. Since January 2022, monthly ETH volume has dropped 140%, according to Dune.
Unconvincing counterargument.
Further OpenSea indicators point to declining NFT demand:
Since January 2022, daily user visits have decreased by 50%.
Daily transactions have decreased by 50% since the beginning of the year in the same manner.
Off-platform, the floor price of Bored Apes has dropped from 145 ETH to 77 ETH. (At $4,800, a reduction from $700,000 to $370,000). Google search data shows waning popular interest.
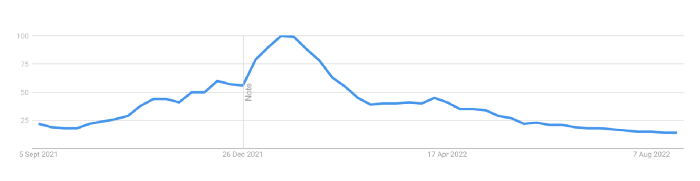
It is a trend that will soon vanish, just like laser eyes.
NFTs haven't moved since the new year. Eminem and Snoop Dogg can utilize their apes in music videos or as 3D visuals to perform at the VMAs, but the reality is that NFTs have lost their public appeal and the market is trying to regain its footing.
They've lost popularity because?
Breaking records. The technology still lacks genuine use cases a year and a half after being popular.
They're pricey prestige symbols that have made a few people rich through cunning timing or less-than-savory scams or rug pulling. Over $10.5 billion has been taken through frauds, most of which are NFT enterprises promising to be the next Bored Apes, according to Web3 is going wonderfully. As the market falls, many ordinary investors realize they purchased into a self-fulfilling ecosystem that's halted. Many NFTs are sold between owner-held accounts to boost their price, data suggests. Most projects rely on social media excitement to debut with a high price before the first owners sell and chuckle to the bank. When they don't, the initiative fails, leaving investors high and dry.
NFTs are fading like laser eyes. Most people pushing the technology don't believe in it or the future it may bring. No, they just need a Kool-Aid-drunk buyer.
Everybody wins. When your JPEGs are worth 99% less than when you bought them, you've lost.
When demand reaches zero, many will lose.