


More on Personal Growth

Tim Denning
3 years ago
Read These Books on Personal Finance to Boost Your Net Worth
And retire sooner.

Books can make you filthy rich.
If you apply what you learn. In 2011, I was broke and had broken dreams.
Someone suggested I read finance books. One Up On Wall Street was his first recommendation.
Finance books were my crack.
I've read every money book since then. Some are good, but most stink.
These books will make you rich.
The Almanack of Naval Ravikant by Eric Jorgenson
This isn't a cliche book.
This book was inspired by a How to Get Rich tweet thread.
It’s one of the best tweets I’ve ever read.
Naval thinks differently. He nukes ordinary ideas. I've never heard better money advice.
Eric Jorgenson wrote a book about this tweet thread with Navals permission. A must-read, easy-to-digest book.
Best quote
Seek wealth, not money or status. Wealth is having assets that earn while you sleep. Money is how we transfer time and wealth. Status is your place in the social hierarchy — Naval
Morgan Housel's The Psychology of Money
Many finance books advise investing like a dunce.
They almost all peddle the buy an index fund BS. Different book.
It's about money-making psychology. Because any fool can get rich and drunk on their ego. Few can consistently make money.
Each chapter is short. A single-page chapter breaks all book publishing rules.
Best quote
Spending money to show people how much money you have is the fastest way to have less money — Morgan Housel
J.L. Collins' The Simple Path to Wealth
Most of the best money books were written by bloggers.
JL Collins blogs. This easy-to-read book was written for his daughter.
This book popularized the phrase F You Money. With enough money in your bank account and investment portfolio, you can say F You more.
A bad boss is an example. You can leave instead of enduring his wrath.
You can then sit at home and look for another job while financially secure. JL says its mind-freedom is powerful.
Best phrasing
You own the things you own and they in turn own you — J.L. Collins
Tony Robbins' Unshakeable
I like Tony. This book makes me sweaty.
Tony interviews the world's top financiers. He interviews people who rarely do so.
This book taught me all-weather portfolio. It's a way to invest in different asset classes in good, bad, recession, or depression times.
Look at it:
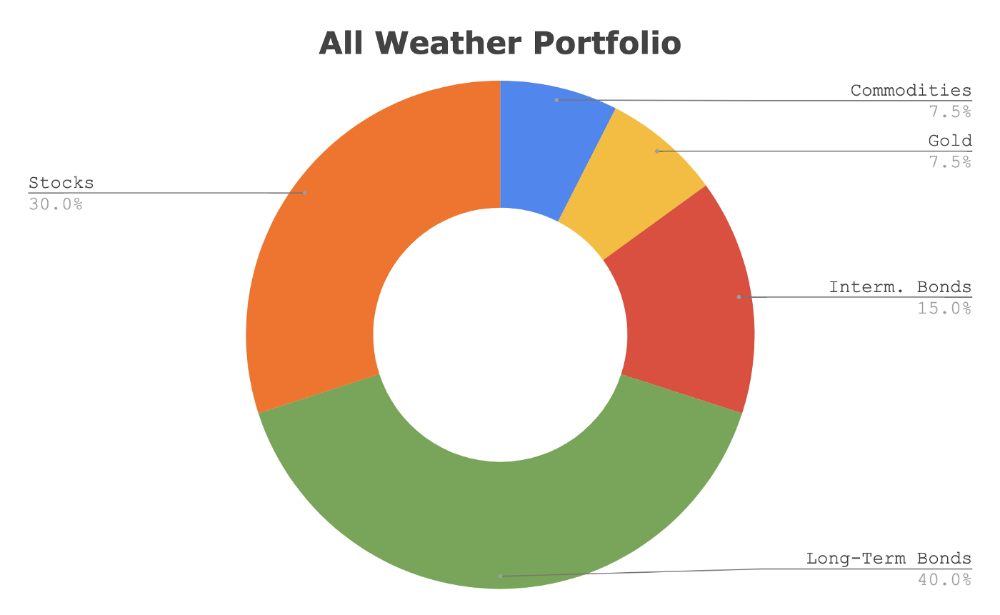
Investing isn’t about buying one big winner — that’s gambling. It’s about investing in a diversified portfolio of assets.
Best phrasing
The best opportunities come in times of maximum pessimism — Tony Robbins
Ben Graham's The Intelligent Investor
This book helped me distinguish between a spectator and an investor.
Spectators are those who shout that crypto, NFTs, or XYZ platform will die.
Tourists. They want attention and to say "I told you so." They make short-term and long-term predictions like fortunetellers. LOL. Idiots.
Benjamin Graham teaches smart investing. You'll buy a long-term asset. To be confident in recessions, use dollar-cost averaging.
Best phrasing
Those who do not remember the past are condemned to repeat it. — Benjamin Graham
The Napoleon Hill book Think and Grow Rich
This classic book introduced positive thinking to modern self-help.
Lazy pessimists can't become rich. No way.
Napoleon said, "Thoughts create reality."
No surprise that he discusses obsession and focus in this book. They are the fastest ways to make more money to invest in time and wealth-protecting assets.
Best phrasing
The starting point of all achievement is DESIRE. Keep this constantly in mind. Weak desire brings weak results, just as a small fire makes a small amount of heat — Napoleon Hill
Ramit Sethi's book I Will Teach You To Be Rich
This book is mostly good. The part about credit cards is trash.
Avoid credit card temptations. I don't care about their airline points.
This book teaches you to master money basics (that many people mess up) then automate it so your monkey brain doesn't ruin your financial future.
The book includes great negotiation tactics to help you make more money in less time.
Best quote
The 85 Percent Solution: Getting started is more important than becoming an expert — Ramit Sethi
David Bach's The Automatic Millionaire
You've probably met a six- or seven-figure earner who's broke. All their money goes to useless things like cars.
Money isn't as essential as what you do with it. David teaches how to automate your earnings for more money.
Compounding works once investing is automated. So you get rich.
His strategy eliminates luck and (almost) guarantees millionaire status.
Best phrasing
Every time you earn one dollar, make sure to pay yourself first — David Bach
Thomas J. Stanley's The Millionaire Next Door
Thomas defies the definition of rich.
He spends much of the book highlighting millionaire traits he's studied.
Rich people are quiet, so you wouldn't know they're wealthy. They don't earn much money or drive a BMW.
Thomas will give you the math to get started.
Best phrasing
I am not impressed with what people own. But I’m impressed with what they achieve. I’m proud to be a physician. Always strive to be the best in your field…. Don’t chase money. If you are the best in your field, money will find you. — Thomas J. Stanley
by Bill Perkins "Die With Zero"
Let’s end with one last book.
Bill's book angered many people. He says we spend too much time saving for retirement and die rich. That bank money is lost time.
Your grandkids could use the money. When children inherit money, they become lazy, entitled a-holes.
Bill wants us to spend our money on life-enhancing experiences. Stop saving money like monopoly monkeys.
Best phrasing
You should be focusing on maximizing your life enjoyment rather than on maximizing your wealth. Those are two very different goals. Money is just a means to an end: Having money helps you to achieve the more important goal of enjoying your life. But trying to maximize money actually gets in the way of achieving the more important goal — Bill Perkins

Daniel Vassallo
3 years ago
Why I quit a $500K job at Amazon to work for myself
I quit my 8-year Amazon job last week. I wasn't motivated to do another year despite promotions, pay, recognition, and praise.
In AWS, I built developer tools. I could have worked in that field forever.
I became an Amazon developer. Within 3.5 years, I was promoted twice to senior engineer and would have been promoted to principal engineer if I stayed. The company said I had great potential.
Over time, I became a reputed expert and leader within the company. I was respected.
First year I made $75K, last year $511K. If I stayed another two years, I could have made $1M.
Despite Amazon's reputation, my work–life balance was good. I no longer needed to prove myself and could do everything in 40 hours a week. My team worked from home once a week, and I rarely opened my laptop nights or weekends.
My coworkers were great. I had three generous, empathetic managers. I’m very grateful to everyone I worked with.
Everything was going well and getting better. My motivation to go to work each morning was declining despite my career and income growth.
Another promotion, pay raise, or big project wouldn't have boosted my motivation. Motivation was also waning. It was my freedom.
Demotivation
My motivation was high in the beginning. I worked with someone on an internal tool with little scrutiny. I had more freedom to choose how and what to work on than in recent years. Me and another person improved it, talked to users, released updates, and tested it. Whatever we wanted, we did. We did our best and were mostly self-directed.
In recent years, things have changed. My department's most important project had many stakeholders and complex goals. What I could do depended on my ability to convince others it was the best way to achieve our goals.
Amazon was always someone else's terms. The terms started out simple (keep fixing it), but became more complex over time (maximize all goals; satisfy all stakeholders). Working in a large organization imposed restrictions on how to do the work, what to do, what goals to set, and what business to pursue. This situation forced me to do things I didn't want to do.
Finding New Motivation
What would I do forever? Not something I did until I reached a milestone (an exit), but something I'd do until I'm 80. What could I do for the next 45 years that would make me excited to wake up and pay my bills? Is that too unambitious? Nope. Because I'm motivated by two things.
One is an external carrot or stick. I'm not forced to file my taxes every April, but I do because I don't want to go to jail. Or I may not like something but do it anyway because I need to pay the bills or want a nice car. Extrinsic motivation
One is internal. When there's no carrot or stick, this motivates me. This fuels hobbies. I wanted a job that was intrinsically motivated.
Is this too low-key? Extrinsic motivation isn't sustainable. Getting promoted felt good for a week, then it was over. When I hit $100K, I admired my W2 for a few days, but then it wore off. Same thing happened at $200K, $300K, $400K, and $500K. Earning $1M or $10M wouldn't change anything. I feel the same about every material reward or possession. Getting them feels good at first, but quickly fades.
Things I've done since I was a kid, when no one forced me to, don't wear off. Coding, selling my creations, charting my own path, and being honest. Why not always use my strengths and motivation? I'm lucky to live in a time when I can work independently in my field without large investments. So that’s what I’m doing.
What’s Next?
I'm going all-in on independence and will make a living from scratch. I won't do only what I like, but on my terms. My goal is to cover my family's expenses before my savings run out while doing something I enjoy. What more could I want from my work?
You can now follow me on Twitter as I continue to document my journey.
This post is a summary. Read full article here

Maria Urkedal York
3 years ago
When at work, don't give up; instead, think like a designer.
How to reframe irritation and go forward

“… before you can figure out where you are going, you need to know where you are, and once you know and accept where you are, you can design your way to where you want to be.” — Bill Burnett and Dave Evans
“You’ve been here before. But there are some new ingredients this time. What can tell yourself that will make you understand that now isn’t just like last year? That there’s something new in this August.”
My coach paused. I sighed, inhaled deeply, and considered her question.
What could I say? I simply needed a plan from her so everything would fall into place and I could be the happy, successful person I want to be.
Time passed. My mind was exhausted from running all morning, all summer, or the last five years, searching for what to do next and how to get there.
Calmer, I remembered that my coach's inquiry had benefited me throughout the summer. The month before our call, I read Designing Your Work Life — How to Thrive and Change and Find Happiness at Work from Standford University’s Bill Burnett and Dave Evans.
A passage in their book felt like a lifeline: “We have something important to say to you: Wherever you are in your work life, whatever job you are doing, it’s good enough. For now. Not forever. For now.”
As I remembered this book on the coaching call, I wondered if I could embrace where I am in August and say my job life is good enough for now. Only temporarily.
I've done that since. I'm getting unstuck.
Here's how you can take the first step in any area where you feel stuck.
How to acquire the perspective of "Good enough for now" for yourself
We’ve all heard the advice to just make the best of a bad situation. That´s not bad advice, but if you only make the best of a bad situation, you are still in a bad situation. It doesn’t get to the root of the problem or offer an opportunity to change the situation. You’re more cheerfully navigating lousiness, which is an improvement, but not much of one and rather hard to sustain over time.” — Bill Burnett and Dave Evans
Reframing Burnett at Evans says good enough for now is the key to being happier at work. Because, as they write, a designer always has options.
Choosing to believe things are good enough for now is liberating. It helps us feel less victimized and less judged. Accepting our situation helps us become unstuck.
Let's break down the process, which designers call constructing your way ahead, into steps you can take today.
Writing helps get started. First, write down your challenge and why it's essential to you. If pen and paper help, try this strategy:
Make the decision to accept the circumstance as it is. Designers always begin by acknowledging the truth of the situation. You now refrain from passing judgment. Instead, you simply describe the situation as accurately as you can. This frees us from negative thought patterns that prevent us from seeing the big picture and instead keep us in a tunnel of negativity.
Look for a reframing right now. Begin with good enough for the moment. Take note of how your body feels as a result. Tell yourself repeatedly that whatever is occurring is sufficient for the time being. Not always, but just now. If you want to, you can even put it in writing and repeatedly breathe it in, almost like a mantra.
You can select a reframe that is more relevant to your situation once you've decided that you're good enough for now and have allowed yourself to believe it. Try to find another perspective that is possible, for instance, if you feel unappreciated at work and your perspective of I need to use and be recognized for all my new skills in my job is making you sad and making you want to resign. For instance, I can learn from others at work and occasionally put my new abilities to use.
After that, leave your mind and act in accordance with your new perspective. Utilize the designer's bias for action to test something out and create a prototype that you can learn from. Your beginning point for creating experiences that will support the new viewpoint derived from the aforementioned point is the new perspective itself. By doing this, you recognize a circumstance at work where you can provide value to yourself or your workplace and then take appropriate action. Send two or three coworkers from whom you wish to learn anything an email, for instance, asking them to get together for coffee or a talk.
Choose tiny, doable actions. You prioritize them at work.
Let's assume you're feeling disconnected at work, so you make a list of folks you may visit each morning or invite to lunch. If you're feeling unmotivated and tired, take a daily walk and treat yourself to a decent coffee.
This may be plenty for now. If you want to take this procedure further, use Burnett and Evans' internet tools and frameworks.
Developing the daily practice of reframing
“We’re not discontented kids in the backseat of the family minivan, but how many of us live our lives, especially our work lives, as if we are?” — Bill Burnett and Dave Evans
I choose the good enough for me perspective every day, often. No quick fix. Am a failing? Maybe a little bit, but I like to think of it more as building muscle.
This way, every time I tell myself it's ok, I hear you. For now, that muscle gets stronger.
Hopefully, reframing will become so natural for us that it will become a habit, and not a technique anymore.
If you feel like you’re stuck in your career or at work, the reframe of Good enough, for now, might be valuable, so just go ahead and try it out right now.
And while you’re playing with this, why not think of other areas of your life too, like your relationships, where you live — even your writing, and see if you can feel a shift?
You might also like

Vitalik
4 years ago
An approximate introduction to how zk-SNARKs are possible (part 2)
If tasked with the problem of coming up with a zk-SNARK protocol, many people would make their way to this point and then get stuck and give up. How can a verifier possibly check every single piece of the computation, without looking at each piece of the computation individually? But it turns out that there is a clever solution.
Polynomials
Polynomials are a special class of algebraic expressions of the form:
- x+5
- x^4
- x^3+3x^2+3x+1
- 628x^{271}+318x^{270}+530x^{269}+…+69x+381
i.e. they are a sum of any (finite!) number of terms of the form cx^k
There are many things that are fascinating about polynomials. But here we are going to zoom in on a particular one: polynomials are a single mathematical object that can contain an unbounded amount of information (think of them as a list of integers and this is obvious). The fourth example above contained 816 digits of tau, and one can easily imagine a polynomial that contains far more.
Furthermore, a single equation between polynomials can represent an unbounded number of equations between numbers. For example, consider the equation A(x)+ B(x) = C(x). If this equation is true, then it's also true that:
- A(0)+B(0)=C(0)
- A(1)+B(1)=C(1)
- A(2)+B(2)=C(2)
- A(3)+B(3)=C(3)
And so on for every possible coordinate. You can even construct polynomials to deliberately represent sets of numbers so you can check many equations all at once. For example, suppose that you wanted to check:
- 12+1=13
- 10+8=18
- 15+8=23
- 15+13=28
You can use a procedure called Lagrange interpolation to construct polynomials A(x) that give (12,10,15,15) as outputs at some specific set of coordinates (eg. (0,1,2,3)), B(x) the outputs (1,8,8,13) on thos same coordinates, and so forth. In fact, here are the polynomials:
- A(x)=-2x^3+\frac{19}{2}x^2-\frac{19}{2}x+12
- B(x)=2x^3-\frac{19}{2}x^2+\frac{29}{2}x+1
- C(x)=5x+13
Checking the equation A(x)+B(x)=C(x) with these polynomials checks all four above equations at the same time.
Comparing a polynomial to itself
You can even check relationships between a large number of adjacent evaluations of the same polynomial using a simple polynomial equation. This is slightly more advanced. Suppose that you want to check that, for a given polynomial F, F(x+2)=F(x)+F(x+1) with the integer range {0,1…89} (so if you also check F(0)=F(1)=1, then F(100) would be the 100th Fibonacci number)
As polynomials, F(x+2)-F(x+1)-F(x) would not be exactly zero, as it could give arbitrary answers outside the range x={0,1…98}. But we can do something clever. In general, there is a rule that if a polynomial P is zero across some set S=\{x_1,x_2…x_n\} then it can be expressed as P(x)=Z(x)*H(x), where Z(x)=(x-x_1)*(x-x_2)*…*(x-x_n) and H(x) is also a polynomial. In other words, any polynomial that equals zero across some set is a (polynomial) multiple of the simplest (lowest-degree) polynomial that equals zero across that same set.
Why is this the case? It is a nice corollary of polynomial long division: the factor theorem. We know that, when dividing P(x) by Z(x), we will get a quotient Q(x) and a remainder R(x) is strictly less than that of Z(x). Since we know that P is zero on all of S, it means that R has to be zero on all of S as well. So we can simply compute R(x) via polynomial interpolation, since it's a polynomial of degree at most n-1 and we know n values (the zeros at S). Interpolating a polynomial with all zeroes gives the zero polynomial, thus R(x)=0 and H(x)=Q(x).
Going back to our example, if we have a polynomial F that encodes Fibonacci numbers (so F(x+2)=F(x)+F(x+1) across x=\{0,1…98\}), then I can convince you that F actually satisfies this condition by proving that the polynomial P(x)=F(x+2)-F(x+1)-F(x) is zero over that range, by giving you the quotient:
H(x)=\frac{F(x+2)-F(x+1)-F(x)}{Z(x)}
Where Z(x) = (x-0)*(x-1)*…*(x-98).
You can calculate Z(x) yourself (ideally you would have it precomputed), check the equation, and if the check passes then F(x) satisfies the condition!
Now, step back and notice what we did here. We converted a 100-step-long computation into a single equation with polynomials. Of course, proving the N'th Fibonacci number is not an especially useful task, especially since Fibonacci numbers have a closed form. But you can use exactly the same basic technique, just with some extra polynomials and some more complicated equations, to encode arbitrary computations with an arbitrarily large number of steps.
see part 3

Ben Carlson
3 years ago
Bear market duration and how to invest during one
Bear markets don't last forever, but that's hard to remember. Jamie Cullen's illustration
A bear market is a 20% decline from peak to trough in stock prices.
The S&P 500 was down 24% from its January highs at its low point this year. Bear market.
The U.S. stock market has had 13 bear markets since WWII (including the current one). Previous 12 bear markets averaged –32.7% losses. From peak to trough, the stock market averaged 12 months. The average time from bottom to peak was 21 months.
In the past seven decades, a bear market roundtrip to breakeven has averaged less than three years.
Long-term averages can vary widely, as with all historical market data. Investors can learn from past market crashes.
Historical bear markets offer lessons.
Bear market duration
A bear market can cost investors money and time. Most of the pain comes from stock market declines, but bear markets can be long.
Here are the longest U.S. stock bear markets since World war 2:
Stock market crashes can make it difficult to break even. After the 2008 financial crisis, the stock market took 4.5 years to recover. After the dotcom bubble burst, it took seven years to break even.
The longer you're underwater in the market, the more suffering you'll experience, according to research. Suffering can lead to selling at the wrong time.
Bear markets require patience because stocks can take a long time to recover.
Stock crash recovery
Bear markets can end quickly. The Corona Crash in early 2020 is an example.
The S&P 500 fell 34% in 23 trading sessions, the fastest bear market from a high in 90 years. The entire crash lasted one month. Stocks broke even six months after bottoming. Stocks rose 100% from those lows in 15 months.
Seven bear markets have lasted two years or less since 1945.
The 2020 recovery was an outlier, but four other bear markets have made investors whole within 18 months.
During a bear market, you don't know if it will end quickly or feel like death by a thousand cuts.
Recessions vs. bear markets
Many people believe the U.S. economy is in or heading for a recession.
I agree. Four-decade high inflation. Since 1945, inflation has exceeded 5% nine times. Each inflationary spike caused a recession. Only slowing economic demand seems to stop price spikes.
This could happen again. Stocks seem to be pricing in a recession.
Recessions almost always cause a bear market, but a bear market doesn't always equal a recession. In 1946, the stock market fell 27% without a recession in sight. Without an economic slowdown, the stock market fell 22% in 1966. Black Monday in 1987 was the most famous stock market crash without a recession. Stocks fell 30% in less than a week. Many believed the stock market signaled a depression. The crash caused no slowdown.
Economic cycles are hard to predict. Even Wall Street makes mistakes.
Bears vs. bulls
Bear markets for U.S. stocks always end. Every stock market crash in U.S. history has been followed by new all-time highs.
How should investors view the recession? Investing risk is subjective.
You don't have as long to wait out a bear market if you're retired or nearing retirement. Diversification and liquidity help investors with limited time or income. Cash and short-term bonds drag down long-term returns but can ensure short-term spending.
Young people with years or decades ahead of them should view this bear market as an opportunity. Stock market crashes are good for net savers in the future. They let you buy cheap stocks with high dividend yields.
You need discipline, patience, and planning to buy stocks when it doesn't feel right.
Bear markets aren't fun because no one likes seeing their portfolio fall. But stock market downturns are a feature, not a bug. If stocks never crashed, they wouldn't offer such great long-term returns.

Deon Ashleigh
3 years ago
You can dominate your daily productivity with these 9 little-known Google Calendar tips.
Calendars are great unpaid employees.
After using Notion to organize my next three months' goals, my days were a mess.
I grew very chaotic afterward. I was overwhelmed, unsure of what to do, and wasting time attempting to plan the day after it had started.
Imagine if our skeletons were on the outside. Doesn’t work.
The goals were too big; I needed to break them into smaller chunks. But how?
Enters Google Calendar
RescueTime’s recommendations took me seven hours to make a daily planner. This epic narrative begins with a sheet of paper and concludes with a daily calendar that helps me focus and achieve more goals. Ain’t nobody got time for “what’s next?” all day.
Onward!
Return to the Paleolithic Era
Plan in writing.
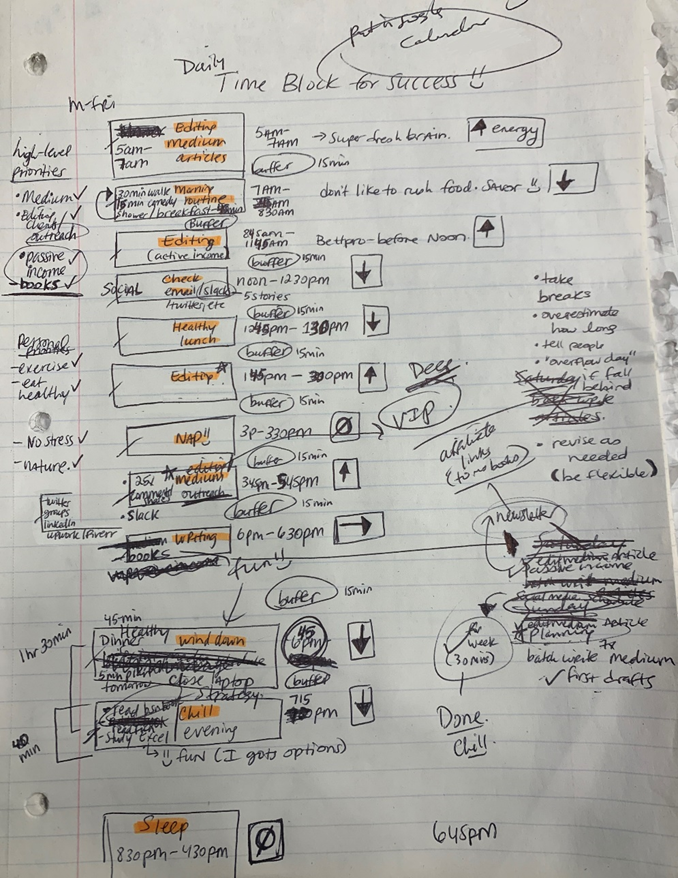
Not on the list, but it helped me plan my day. Physical writing boosts creativity and recall.
Find My Heart
i.e. prioritize
RescueTime suggested I prioritize before planning. Personal and business goals were proposed.
My top priorities are to exercise, eat healthily, spend time in nature, and avoid stress.
Priorities include writing and publishing Medium articles, conducting more freelance editing and Medium outreach, and writing/editing sci-fi books.
These eight things will help me feel accomplished every day.
Make a baby calendar.
Create daily calendar templates.
Make family, pleasure, etc. calendars.
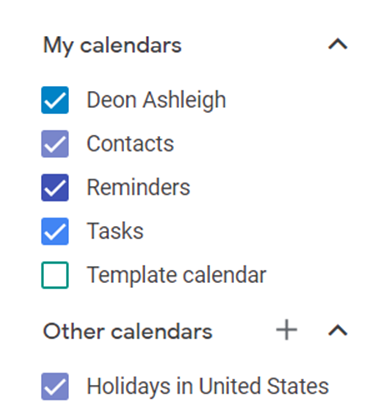
Google Calendar instructions:
Other calendars
Press the “+” button
Create a new calendar
Create recurring events for each day
My calendar, without the template:
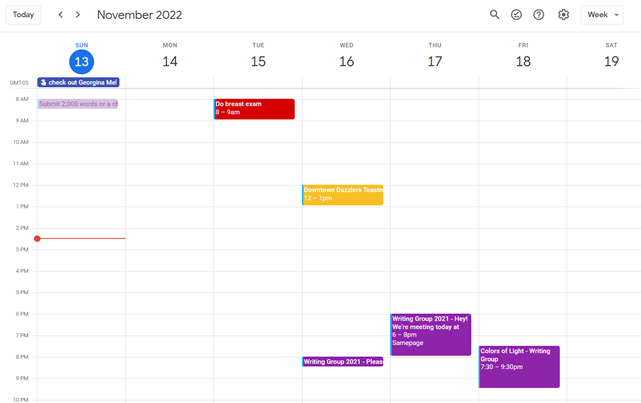
Empty, so I can fill it with vital tasks.
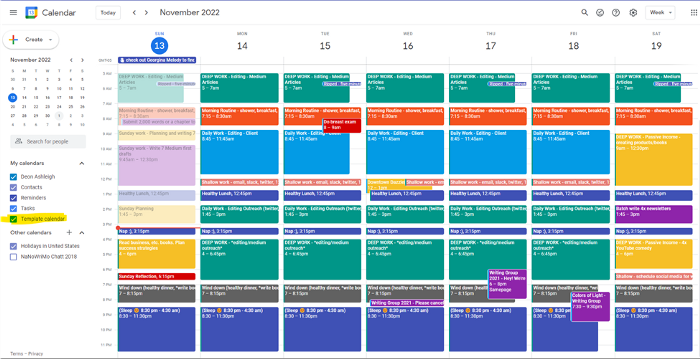
With the template:
My daily skeleton corresponds with my priorities. I've been overwhelmed for years because I lack daily, weekly, monthly, and yearly structure.
Google Calendars helps me reach my goals and focus my energy.
Get your colored pencils ready
Time-block color-coding.
Color labeling lets me quickly see what's happening. Maybe you are too.
Google Calendar instructions:
Determine which colors correspond to each time block.
When establishing new events, select a color.
Save
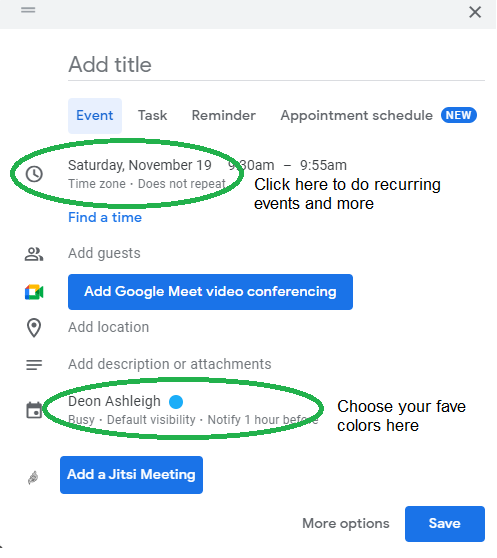
My calendar is color-coded as follows:
Yellow — passive income or other future-related activities
Red — important activities, like my monthly breast exam
Flamingo — shallow work, like emails, Twitter, etc.
Blue — all my favorite activities, like walking, watching comedy, napping, and sleeping. Oh, and eating.
Green — money-related events required for this adulting thing
Purple — writing-related stuff
Associating a time block with a color helps me stay focused. Less distractions mean faster work.
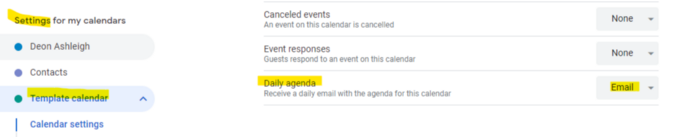
Open My Email
aka receive a daily email from Google Calendar.
Google Calendar sends a daily email feed of your calendars. I sent myself the template calendar in this email.
Google Calendar instructions:
Access settings
Select the calendar that you want to send (left side)
Go down the page to see more alerts
Under the daily agenda area, click Email.
Get in Touch With Your Red Bull Wings — Naturally
aka audit your energy levels.
My daily planner has arrows. These indicate how much energy each activity requires or how much I have.
Rightward arrow denotes medium energy.
I do my Medium and professional editing in the morning because it's energy-intensive.
Niharikaa Sodhi recommends morning Medium editing.
I’m a morning person. As long as I go to bed at a reasonable time, 5 a.m. is super wild GO-TIME. It’s like the world was just born, and I marvel at its wonderfulness.
Freelance editing lets me do what I want. An afternoon snooze will help me finish on time.
Ditch Schedule View
aka focus on the weekly view.
RescueTime advocated utilizing the weekly view of Google Calendar, so I switched.
When you launch the phone app or desktop calendar, a red line shows where you are in the day.
I'll follow the red line's instructions. My digital supervisor is easy to follow.
In the image above, it's almost 3 p.m., therefore the red line implies it's time to snooze.
I won't forget this block ;).
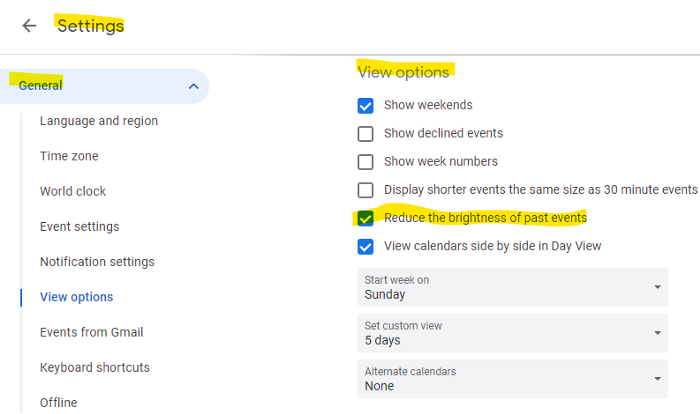
Reduce the Lighting
aka dim previous days.
This is another Google Calendar feature I didn't know about. Once the allotted time passes, the time block dims. This keeps me present.
Google Calendar instructions:
Access settings
remaining general
To view choices, click.
Check Diminish the glare of the past.
Bonus
Two additional RescueTimes hacks:
Maintain a space between tasks
I left 15 minutes between each time block to transition smoothly. This relates to my goal of less stress. If I set strict start and end times, I'll be stressed.
With a buffer, I can breathe, stroll around, and start the following time block fresh.
Find a time is related to the buffer.
This option allows you conclude small meetings five minutes early and longer ones ten. Before the next meeting, relax or go wild.
Decide on a backup day.
This productivity technique is amazing.
Spend this excess day catching up on work. It helps reduce tension and clutter.
That's all I can say about Google Calendar's functionality.