


Take a look at The One, a Los Angeles estate with a whopping 105,000 square feet of living area.
The interiors of the 105,000-square-foot property, which sits on a five-acre parcel in the wealthy Los Angeles suburb of Bel Air and is suitably titled The One, have been a well guarded secret. We got an intimate look inside this world-record-breaking property, as well as the creative and aesthetic geniuses behind it.
The estate appears to float above the city, surrounded on three sides by a moat and a 400-foot-long running track. Completed over eight years—and requiring 600 workers to build—the home was designed by architect Paul McClean and interior designer Kathryn Rotondi, who were enlisted by owner and developer Nile Niami to help it live up to its standard.
"This endeavor seemed both exhilarating and daunting," McClean says. However, the home's remarkable location and McClean's long-standing relationship with Niami persuaded him to "build something unique and extraordinary" rather than just take on the job.
And McClean has more than delivered.
The home's main entrance leads to a variety of meeting places with magnificent 360-degree views of the Pacific Ocean, downtown Los Angeles, and the San Gabriel Mountains, thanks to its 26-foot-high ceilings. There is water at the entrance area, as well as a sculpture and a bridge. "We often employ water in our design approach because it provides a sensory change that helps you acclimatize to your environment," McClean explains.
Niami wanted a neutral palette that would enable the environment and vistas to shine, so she used black, white, and gray throughout the house.
McClean has combined the home's inside with outside "to create that quintessential L.A. lifestyle but on a larger scale," he says, drawing influence from the local environment and history of Los Angeles modernism. "We separated the entertaining spaces from the living portions to make the house feel more livable. The former are on the lowest level, which serves as a plinth for the rest of the house and minimizes its apparent mass."
The home's statistics, in addition to its eye-catching style, are equally impressive. There are 42 bathrooms, 21 bedrooms, a 5,500-square-foot master suite, a 30-car garage gallery with two car-display turntables, a four-lane bowling alley, a spa level, a 30-seat movie theater, a "philanthropy wing (with a capacity of 200) for charity galas, a 10,000-square-foot sky deck, and five swimming pools.
Rotondi, the creator of KFR Design, collaborated with Niami on the interior design to create different spaces that flow into one another despite the house's grandeur. "I was especially driven to 'wow factor' components in the hospitality business," Rotondi says, citing top luxury hotel brands such as Aman, Bulgari, and Baccarat as sources of inspiration. Meanwhile, the home's color scheme, soft textures, and lighting are a nod to Niami and McClean's favorite Tom Ford boutique on Rodeo Drive.
The house boasts an extraordinary collection of art, including a butterfly work by Stephen Wilson on the lower level and a Niclas Castello bespoke panel in black and silver in the office, thanks to a cooperation between Creative Art Partners and Art Angels. There is also a sizable collection of bespoke furniture pieces from byShowroom.
A house of this size will never be erected again in Los Angeles, thanks to recently enacted city rules, so The One will truly be one of a kind. "For all of us, this project has been such a long and instructive trip," McClean says. "It was exciting to develop and approached with excitement, but I don't think any of us knew how much effort and time it would take to finish the project."
More on Lifestyle

Stephen Rivers
3 years ago
Because of regulations, the $3 million Mercedes-AMG ONE will not (officially) be available in the United States or Canada.
We asked Mercedes to clarify whether "customers" refers to people who have expressed interest in buying the AMG ONE but haven't made a down payment or paid in full for a production slot, and a company spokesperson told that it's the latter – "Actual customers for AMG ONE in the United States and Canada."
The Mercedes-AMG ONE has finally arrived in manufacturing form after numerous delays. This may be the most complicated and magnificent hypercar ever created, but according to Mercedes, those roads will not be found in the United States or Canada.
Despite all of the well-deserved excitement around the gorgeous AMG ONE, there was no word on when US customers could expect their cars. Our Editor-in-Chief became aware of this and contacted Mercedes to clarify the matter. Mercedes-hypercar AMG's with the F1-derived 1,049 HP 1.6-liter V6 engine will not be homologated for the US market, they've confirmed.
Mercedes has informed its customers in the United States and Canada that the ONE will not be arriving to North America after all, as of today, June 1, 2022. The whole text of the letter is included below, so sit back and wait for Mercedes to explain why we (or they) won't be getting (or seeing) the hypercar. Mercedes claims that all 275 cars it wants to produce have already been reserved, with net pricing in Europe starting at €2.75 million (about US$2.93 million at today's exchange rates), before country-specific taxes.
"The AMG-ONE was created with one purpose in mind: to provide a straight technology transfer of the World Championship-winning Mercedes-AMG Petronas Formula 1 E PERFORMANCE drive unit to the road." It's the first time a complete Formula 1 drive unit has been integrated into a road car.
Every component of the AMG ONE has been engineered to redefine high performance, with 1,000+ horsepower, four electric motors, and a blazing top speed of more than 217 mph. While the engine's beginnings are in competition, continuous research and refinement has left us with a difficult choice for the US market.
We determined that following US road requirements would considerably damage its performance and overall driving character in order to preserve the distinctive nature of its F1 powerplant. We've made the strategic choice to make the automobile available for road use in Europe, where it complies with all necessary rules."
If this is the first time US customers have heard about it, which it shouldn't be, we understand if it's a bit off-putting. The AMG ONE could very probably be Mercedes' final internal combustion hypercar of this type.
Nonetheless, we wouldn't be surprised if a few make their way to the United States via the federal government's "Show and Display" exemption provision. This legislation permits the importation of automobiles such as the AMG ONE, but only for a total of 2,500 miles per year.
The McLaren Speedtail, the Koenigsegg One:1, and the Bugatti EB110 are among the automobiles that have been imported under this special rule. We just hope we don't have to wait too long to see the ONE in the United States.

Will Lockett
2 years ago
There Is A New EV King in Town

McMurtry Spéirling outperforms Tesla in speed and efficiency.
EVs were ridiculously slow for decades. However, the 2008 Tesla Roadster revealed that EVs might go extraordinarily fast. The Tesla Model S Plaid and Rimac Nevera are the fastest-accelerating road vehicles, despite combustion-engined road cars dominating the course. A little-known firm beat Tesla and Rimac in the 0-60 race, beat F1 vehicles on a circuit, and boasts a 350-mile driving range. The McMurtry Spéirling is completely insane.
Mat Watson of CarWow, a YouTube megastar, was recently handed a Spéirling and access to Silverstone Circuit (view video above). Mat ran a quarter-mile on Silverstone straight with former F1 driver Max Chilton. The little pocket-rocket automobile touched 100 mph in 2.7 seconds, completed the quarter mile in 7.97 seconds, and hit 0-60 in 1.4 seconds. When looking at autos quickly, 0-60 times can seem near. The Tesla Model S Plaid does 0-60 in 1.99 seconds, which is comparable to the Spéirling. Despite the meager statistics, the Spéirling is nearly 30% faster than Plaid!
My vintage VW Golf 1.4s has an 8.8-second 0-60 time, whereas a BMW Z4 3.0i is 30% faster (with a 0-60 time of 6 seconds). I tried to beat a Z4 off the lights in my Golf, but the Beamer flew away. If they challenge the Spéirling in a Model S Plaid, they'll feel as I did. Fast!
Insane quarter-mile drag time. Its road car record is 7.97 seconds. A Dodge Demon, meant to run extremely fast quarter miles, finishes so in 9.65 seconds, approximately 20% slower. The Rimac Nevera's 8.582-second quarter-mile record was miles behind drag racing. This run hampered the Spéirling. Because it was employing gearing that limited its top speed to 150 mph, it reached there in a little over 5 seconds without accelerating for most of the quarter mile! McMurtry can easily change the gearing, making the Spéirling run quicker.
McMurtry did this how? First, the Spéirling is a tiny single-seater EV with a 60 kWh battery pack, making it one of the lightest EVs ever. The 1,000-hp Spéirling has more than one horsepower per kg. The Nevera has 0.84 horsepower per kg and the Plaid 0.44.
However, you cannot simply construct a car light and power it. Instead of accelerating, it would spin. This makes the Spéirling a fan car. Its huge fans create massive downforce. These fans provide the Spéirling 2 tonnes of downforce while stationary, so you could park it on the ceiling. Its fast 0-60 time comes from its downforce, which lets it deliver all that power without wheel spin.
It also possesses complete downforce at all speeds, allowing it to tackle turns faster than even race vehicles. Spéirlings overcame VW IDRs and F1 cars to set the Goodwood Hill Climb record (read more here). The Spéirling is a dragstrip winner and track dominator, unlike the Plaid and Nevera.
The Spéirling is astonishing for a single-seater. Fan-generated downforce is more efficient than wings and splitters. It also means the vehicle has very minimal drag without the fan. The Spéirling can go 350 miles per charge (WLTP) or 20-30 minutes at full speed on a track despite its 60 kWh battery pack. The G-forces would hurt your neck before the battery died if you drove around a track for longer. The Spéirling can charge at over 200 kW in about 30 minutes. Thus, driving to track days, having fun, and returning is possible. Unlike other high-performance EVs.
Tesla, Rimac, or Lucid will struggle to defeat the Spéirling. They would need to build a fan automobile because adding power to their current vehicle would make it uncontrollable. The EV and automobile industries now have a new, untouchable performance king.

Tech With Dom
3 years ago
6 Awesome Desk Accessories You Must Have!
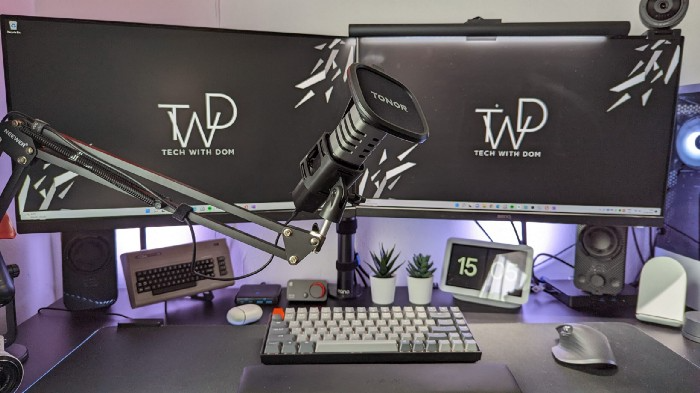
I'm gadget-obsessed. So I shared my top 6 desk gadgets.
These gadgets improve my workflow and are handy for working from home.
Without further ado...
Computer light bar Xiaomi Mi

I've previously recommended the Xiaomi Mi Light Bar, and I still do. It's stylish and convenient.
The Mi bar is a monitor-mounted desk lamp. The lamp's hue and brightness can be changed with a stylish wireless remote.
Changeable hue and brightness make it ideal for late-night work.
Desk Mat 2.

I wasn't planning to include a desk surface in this article, but I find it improves computer use.
The mouse feels smoother and is a better palm rest than wood or glass.
I'm currently using the overkill Razer Goliathus Extended Chroma RGB Gaming Surface, but I like RGB.
Using a desk surface or mat makes computer use more comfortable, and it's not expensive.
Third, the Logitech MX Master 3 Mouse

The Logitech MX Master 3 or any from the MX Master series is my favorite mouse.
The side scroll wheel on these mice is a feature I've never seen on another mouse.
Side scroll wheels are great for spreadsheets and video editing. It would be hard for me to switch from my Logitech MX Master 3 to another mouse. Only gaming is off-limits.
Google Nest 4.

Without a smart assistant, my desk is useless. I'm currently using the second-generation Google Nest Hub, but I've also used the Amazon Echo Dot, Echo Spot, and Apple HomePod Mini.
As a Pixel 6 Pro user, the Nest Hub works best with my phone.
My Nest Hub plays news, music, and calendar events. It also lets me control lights and switches with my smartphone. It plays YouTube videos.
Google Pixel Stand, No. 5

A wireless charger on my desk is convenient for charging my phone and other devices while I work. My desk has two wireless chargers. I have a Satechi aluminum fast charger and a second-generation Google Pixel Stand.
If I need to charge my phone and earbuds simultaneously, I use two wireless chargers. Satechi chargers are well-made and fast. Micro-USB is my only complaint.
The Pixel Stand converts compatible devices into a smart display for adjusting charging speeds and controlling other smart devices. My Pixel 6 Pro charges quickly. Here's my video review.
6. Anker Power Bank

Anker's 65W charger is my final recommendation. This online find was a must-have. This can charge my laptop and several non-wireless devices, perfect for any techie!
The charger has two USB-A ports and two USB-C ports, one with 45W and the other with 20W, so it can charge my iPad Pro and Pixel 6 Pro simultaneously.
Summary
These are some of my favorite office gadgets. My kit page has an updated list.
Links to the products mentioned in this article are in the appropriate sections. These are affiliate links.
You're up! Share the one desk gadget you can't live without and why.
You might also like

Entreprogrammer
3 years ago
The Steve Jobs Formula: A Guide to Everything
A must-read for everyone

Jobs is well-known. You probably know the tall, thin guy who wore the same clothing every day. His influence is unavoidable. In fewer than 40 years, Jobs' innovations have impacted computers, movies, cellphones, music, and communication.
Steve Jobs may be more imaginative than the typical person, but if we can use some of his ingenuity, ambition, and good traits, we'll be successful. This essay explains how to follow his guidance and success secrets.
1. Repetition is necessary for success.
Be patient and diligent to master something. Practice makes perfect. This is why older workers are often more skilled.
When should you repeat a task? When you're confident and excited to share your product. It's when to stop tweaking and repeating.
Jobs stated he'd make the crowd sh** their pants with an iChat demo.
Use this in your daily life.
Start with the end in mind. You can put it in writing and be as detailed as you like with your plan's schedule and metrics. For instance, you have a goal of selling three coffee makers in a week.
Break it down, break the goal down into particular tasks you must complete, and then repeat those tasks. To sell your coffee maker, you might need to make 50 phone calls.
Be mindful of the amount of work necessary to produce the desired results. Continue doing this until you are happy with your product.
2. Acquire the ability to add and subtract.
How did Picasso invent cubism? Pablo Picasso was influenced by stylised, non-naturalistic African masks that depict a human figure.
Artists create. Constantly seeking inspiration. They think creatively about random objects. Jobs said creativity is linking things. Creative people feel terrible when asked how they achieved something unique because they didn't do it all. They saw innovation. They had mastered connecting and synthesizing experiences.
Use this in your daily life.
On your phone, there is a note-taking app. Ideas for what you desire to learn should be written down. It may be learning a new language, calligraphy, or anything else that inspires or intrigues you.
Note any ideas you have, quotations, or any information that strikes you as important.
Spend time with smart individuals, that is the most important thing. Jim Rohn, a well-known motivational speaker, has observed that we are the average of the five people with whom we spend the most time.
Learning alone won't get you very far. You need to put what you've learnt into practice. If you don't use your knowledge and skills, they are useless.
3. Develop the ability to refuse.
Steve Jobs deleted thousands of items when he created Apple's design ethic. Saying no to distractions meant upsetting customers and partners.
John Sculley, the former CEO of Apple, said something like this. According to Sculley, Steve’s methodology differs from others as he always believed that the most critical decisions are things you choose not to do.
Use this in your daily life.
Never be afraid to say "no," "I won't," or "I don't want to." Keep it simple. This method works well in some situations.
Give a different option. For instance, X might be interested even if I won't be able to achieve it.
Control your top priority. Before saying yes to anything, make sure your work schedule and priority list are up to date.
4. Follow your passion
“Follow your passion” is the worst advice people can give you. Steve Jobs didn't start Apple because he suddenly loved computers. He wanted to help others attain their maximum potential.
Great things take a lot of work, so quitting makes sense if you're not passionate. Jobs learned from history that successful people were passionate about their work and persisted through challenges.
Use this in your daily life.
Stay away from your passion. Allow it to develop daily. Keep working at your 9-5-hour job while carefully gauging your level of desire and endurance. Less risk exists.
The truth is that if you decide to work on a project by yourself rather than in a group, it will take you years to complete it instead of a week. Instead, network with others who have interests in common.
Prepare a fallback strategy in case things go wrong.
Success, this small two-syllable word eventually gives your life meaning, a perspective. What is success? For most, it's achieving their ambitions. However, there's a catch. Successful people aren't always happy.
Furthermore, where do people’s goals and achievements end? It’s a never-ending process. Success is a journey, not a destination. We wish you not to lose your way on this journey.

Katrine Tjoelsen
2 years ago
8 Communication Hacks I Use as a Young Employee
Learn these subtle cues to gain influence.
Hate being ignored?
As a 24-year-old, I struggled at work. Attention-getting tips How to avoid being judged by my size, gender, and lack of wrinkles or gray hair?
I've learned seniority hacks. Influence. Within two years as a product manager, I led a team. I'm a Stanford MBA student.
These communication hacks can make you look senior and influential.
1. Slowly speak
We speak quickly because we're afraid of being interrupted.
When I doubt my ideas, I speak quickly. How can we slow down? Jamie Chapman says speaking slowly saps our energy.
Chapman suggests emphasizing certain words and pausing.
2. Interrupted? Stop the stopper
Someone interrupt your speech?
Don't wait. "May I finish?" No pause needed. Stop interrupting. I first tried this in Leadership Laboratory at Stanford. How quickly I gained influence amazed me.
Next time, try “May I finish?” If that’s not enough, try these other tips from Wendy R.S. O’Connor.
3. Context
Others don't always see what's obvious to you.
Through explanation, you help others see the big picture. If a senior knows it, you help them see where your work fits.
4. Don't ask questions in statements
“Your statement lost its effect when you ended it on a high pitch,” a group member told me. Upspeak, it’s called. I do it when I feel uncertain.
Upspeak loses influence and credibility. Unneeded. When unsure, we can say "I think." We can even ask a proper question.
Someone else's boasting is no reason to be dismissive. As leaders and colleagues, we should listen to our colleagues even if they use this speech pattern.
Give your words impact.
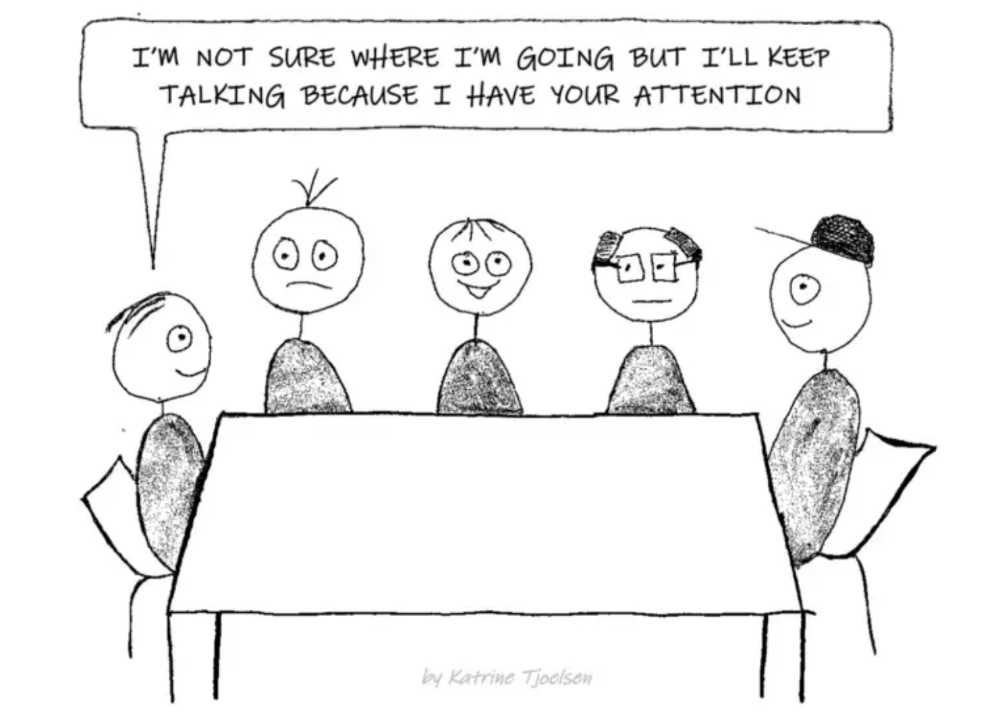
5. Signpost structure
Signposts improve clarity by providing structure and transitions.
Communication coach Alexander Lyon explains how to use "first," "second," and "third" He explains classic and summary transitions to help the listener switch topics.
Signs clarify. Clarity matters.
6. Eliminate email fluff
“Fine. When will the report be ready? — Jeff.”
Notice how senior leaders write short, direct emails? I often use formalities like "dear," "hope you're well," and "kind regards"
Formality is (usually) unnecessary.
7. Replace exclamation marks with periods
See how junior an exclamation-filled email looks:
Hi, all!
Hope you’re as excited as I am for tomorrow! We’re celebrating our accomplishments with cake! Join us tomorrow at 2 pm!
See you soon!
Why the exclamation points? Why not just one?
Hi, all.
Hope you’re as excited as I am for tomorrow. We’re celebrating our accomplishments with cake. Join us tomorrow at 2 pm!
See you soon.
8. Take space
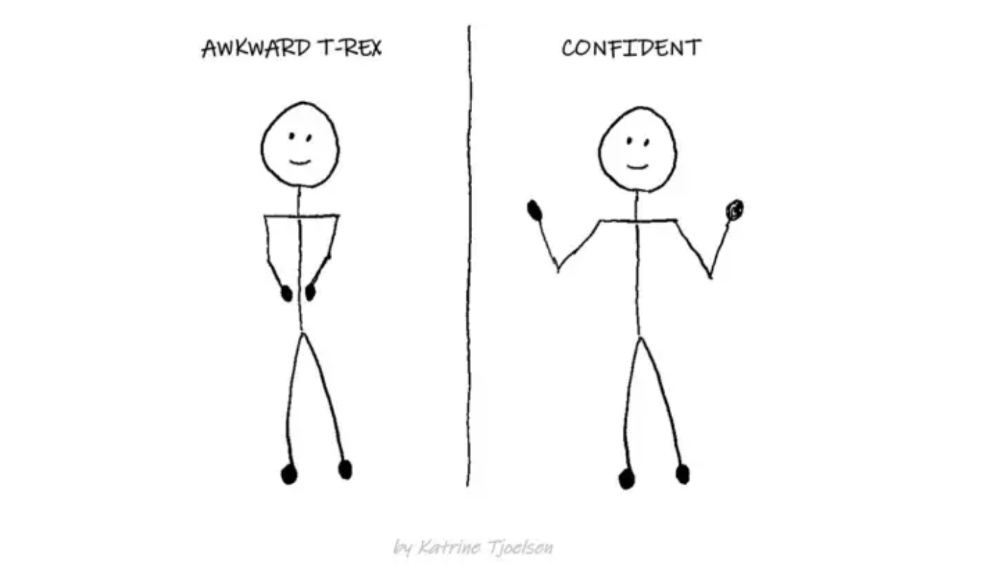
"Playing high" means having an open, relaxed body, says Stanford professor and author Deborah Gruenfield.
Crossed legs or looking small? Relax. Get bigger.


Thomas Huault
3 years ago
A Mean Reversion Trading Indicator Inspired by Classical Mechanics Is The Kinetic Detrender
DATA MINING WITH SUPERALGORES
Old pots produce the best soup.
Science has always inspired indicator design. From physics to signal processing, many indicators use concepts from mechanical engineering, electronics, and probability. In Superalgos' Data Mining section, we've explored using thermodynamics and information theory to construct indicators and using statistical and probabilistic techniques like reduced normal law to take advantage of low probability events.
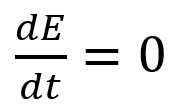
An asset's price is like a mechanical object revolving around its moving average. Using this approach, we could design an indicator using the oscillator's Total Energy. An oscillator's energy is finite and constant. Since we don't expect the price to follow the harmonic oscillator, this energy should deviate from the perfect situation, and the maximum of divergence may provide us valuable information on the price's moving average.
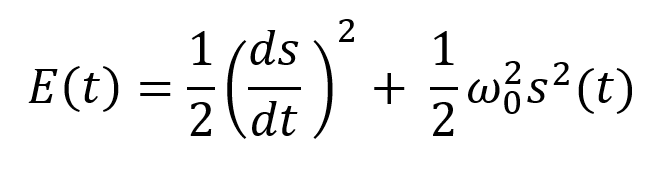
Definition of the Harmonic Oscillator in Few Words
Sinusoidal function describes a harmonic oscillator. The time-constant energy equation for a harmonic oscillator is:
With
Time saves energy.
In a mechanical harmonic oscillator, total energy equals kinetic energy plus potential energy. The formula for energy is the same for every kind of harmonic oscillator; only the terms of total energy must be adapted to fit the relevant units. Each oscillator has a velocity component (kinetic energy) and a position to equilibrium component (potential energy).
The Price Oscillator and the Energy Formula
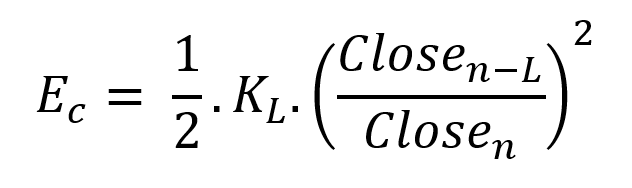
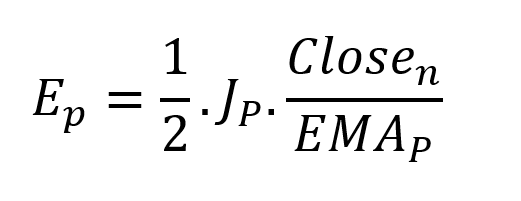
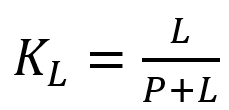
Considering the harmonic oscillator definition, we must specify kinetic and potential components for our price oscillator. We define oscillator velocity as the rate of change and equilibrium position as the price's distance from its moving average.
Price kinetic energy:
It's like:
With
and
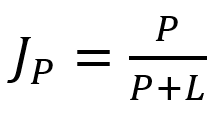
L is the number of periods for the rate of change calculation and P for the close price EMA calculation.
Total price oscillator energy =
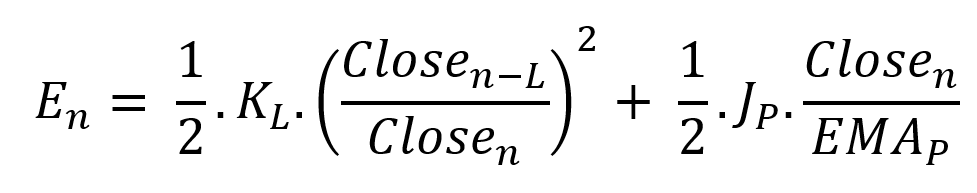
Given that an asset's price can theoretically vary at a limitless speed and be endlessly far from its moving average, we don't expect this formula's outcome to be constrained. We'll normalize it using Z-Score for convenience of usage and readability, which also allows probabilistic interpretation.
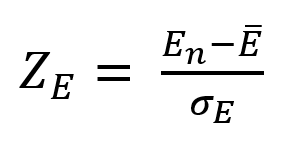
Over 20 periods, we'll calculate E's moving average and standard deviation.
We calculated Z on BTC/USDT with L = 10 and P = 21 using Knime Analytics.
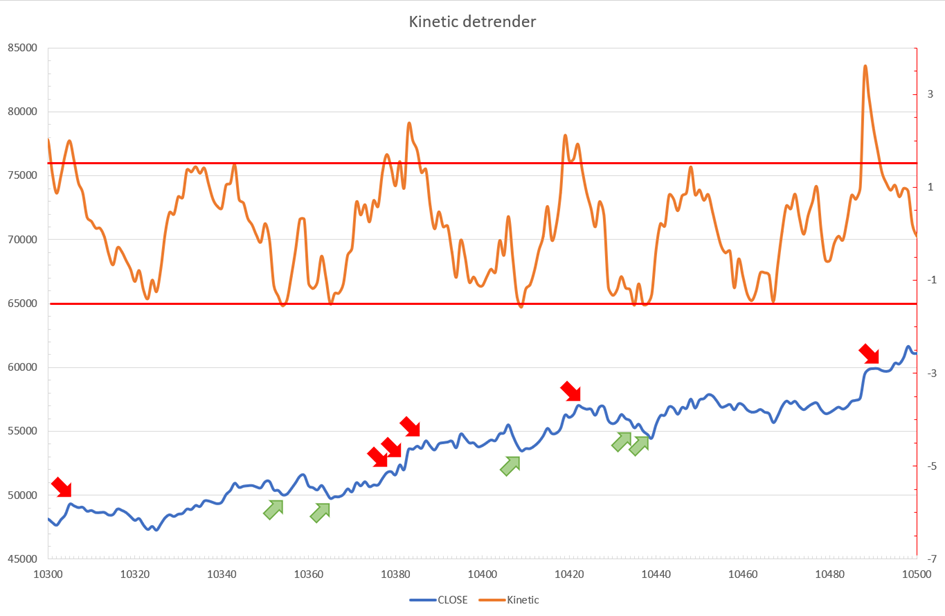
The graph is detrended. We added two horizontal lines at +/- 1.6 to construct a 94.5% probability zone based on reduced normal law tables. Price cycles to its moving average oscillate clearly. Red and green arrows illustrate where the oscillator crosses the top and lower limits, corresponding to the maximum/minimum price oscillation. Since the results seem noisy, we may apply a non-lagging low-pass or multipole filter like Butterworth or Laguerre filters and employ dynamic bands at a multiple of Z's standard deviation instead of fixed levels.
Kinetic Detrender Implementation in Superalgos
The Superalgos Kinetic detrender features fixed upper and lower levels and dynamic volatility bands.
The code is pretty basic and does not require a huge amount of code lines.
It starts with the standard definitions of the candle pointer and the constant declaration :
let candle = record.current
let len = 10
let P = 21
let T = 20
let up = 1.6
let low = 1.6
Upper and lower dynamic volatility band constants are up and low.
We proceed to the initialization of the previous value for EMA :
if (variable.prevEMA === undefined) {
    variable.prevEMA = candle.close
}
And the calculation of EMA with a function (it is worth noticing the function is declared at the end of the code snippet in Superalgos) :
variable.ema = calculateEMA(P, candle.close, variable.prevEMA)
//EMA calculation
function calculateEMA(periods, price, previousEMA) {
    let k = 2 / (periods + 1)
    return price * k + previousEMA * (1 - k)
}
The rate of change is calculated by first storing the right amount of close price values and proceeding to the calculation by dividing the current close price by the first member of the close price array:
variable.allClose.push(candle.close)
if (variable.allClose.length > len) {
    variable.allClose.splice(0, 1)
}
if (variable.allClose.length === len) {
    variable.roc = candle.close / variable.allClose[0]
} else {
    variable.roc = 1
}
Finally, we get energy with a single line:
variable.E = 1 / 2 * len * variable.roc + 1 / 2 * P * candle.close / variable.emaThe Z calculation reuses code from Z-Normalization-based indicators:
variable.allE.push(variable.E)
if (variable.allE.length > T) {
    variable.allE.splice(0, 1)
}
variable.sum = 0
variable.SQ = 0
if (variable.allE.length === T) {
    for (var i = 0; i < T; i++) {
        variable.sum += variable.allE[i]
    }
    variable.MA = variable.sum / T
for (var i = 0; i < T; i++) {
        variable.SQ += Math.pow(variable.allE[i] - variable.MA, 2)
    }
    variable.sigma = Math.sqrt(variable.SQ / T)
variable.Z = (variable.E - variable.MA) / variable.sigma
} else {
    variable.Z = 0
}
variable.allZ.push(variable.Z)
if (variable.allZ.length > T) {
    variable.allZ.splice(0, 1)
}
variable.sum = 0
variable.SQ = 0
if (variable.allZ.length === T) {
    for (var i = 0; i < T; i++) {
        variable.sum += variable.allZ[i]
    }
    variable.MAZ = variable.sum / T
for (var i = 0; i < T; i++) {
        variable.SQ += Math.pow(variable.allZ[i] - variable.MAZ, 2)
    }
    variable.sigZ = Math.sqrt(variable.SQ / T)
} else {
    variable.MAZ = variable.Z
    variable.sigZ = variable.MAZ * 0.02
}
variable.upper = variable.MAZ + up * variable.sigZ
variable.lower = variable.MAZ - low * variable.sigZ
We also update the EMA value.
variable.prevEMA = variable.EMA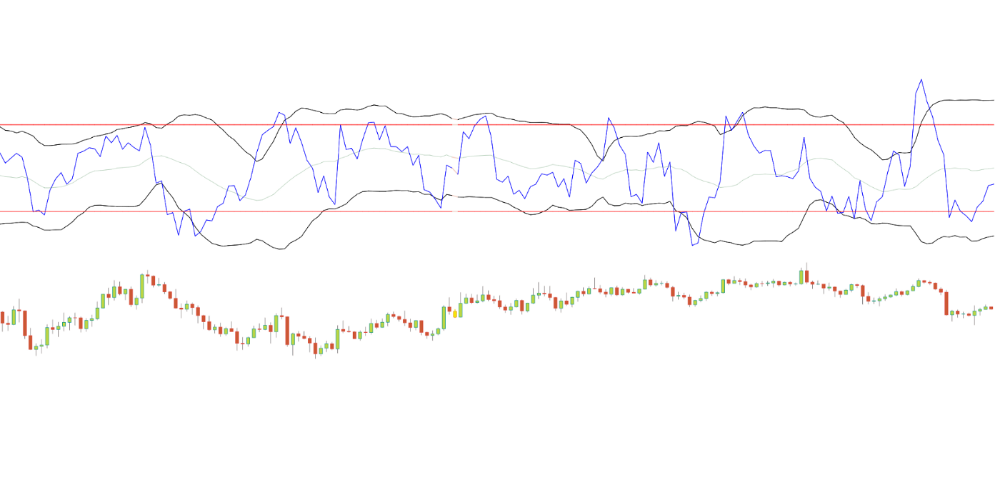
Conclusion
We showed how to build a detrended oscillator using simple harmonic oscillator theory. Kinetic detrender's main line oscillates between 2 fixed levels framing 95% of the values and 2 dynamic levels, leading to auto-adaptive mean reversion zones.
Superalgos' Normalized Momentum data mine has the Kinetic detrender indication.
All the material here can be reused and integrated freely by linking to this article and Superalgos.
This post is informative and not financial advice. Seek expert counsel before trading. Risk using this material.