


Take a look at The One, a Los Angeles estate with a whopping 105,000 square feet of living area.
The interiors of the 105,000-square-foot property, which sits on a five-acre parcel in the wealthy Los Angeles suburb of Bel Air and is suitably titled The One, have been a well guarded secret. We got an intimate look inside this world-record-breaking property, as well as the creative and aesthetic geniuses behind it.
The estate appears to float above the city, surrounded on three sides by a moat and a 400-foot-long running track. Completed over eight years—and requiring 600 workers to build—the home was designed by architect Paul McClean and interior designer Kathryn Rotondi, who were enlisted by owner and developer Nile Niami to help it live up to its standard.
"This endeavor seemed both exhilarating and daunting," McClean says. However, the home's remarkable location and McClean's long-standing relationship with Niami persuaded him to "build something unique and extraordinary" rather than just take on the job.
And McClean has more than delivered.
The home's main entrance leads to a variety of meeting places with magnificent 360-degree views of the Pacific Ocean, downtown Los Angeles, and the San Gabriel Mountains, thanks to its 26-foot-high ceilings. There is water at the entrance area, as well as a sculpture and a bridge. "We often employ water in our design approach because it provides a sensory change that helps you acclimatize to your environment," McClean explains.
Niami wanted a neutral palette that would enable the environment and vistas to shine, so she used black, white, and gray throughout the house.
McClean has combined the home's inside with outside "to create that quintessential L.A. lifestyle but on a larger scale," he says, drawing influence from the local environment and history of Los Angeles modernism. "We separated the entertaining spaces from the living portions to make the house feel more livable. The former are on the lowest level, which serves as a plinth for the rest of the house and minimizes its apparent mass."
The home's statistics, in addition to its eye-catching style, are equally impressive. There are 42 bathrooms, 21 bedrooms, a 5,500-square-foot master suite, a 30-car garage gallery with two car-display turntables, a four-lane bowling alley, a spa level, a 30-seat movie theater, a "philanthropy wing (with a capacity of 200) for charity galas, a 10,000-square-foot sky deck, and five swimming pools.
Rotondi, the creator of KFR Design, collaborated with Niami on the interior design to create different spaces that flow into one another despite the house's grandeur. "I was especially driven to 'wow factor' components in the hospitality business," Rotondi says, citing top luxury hotel brands such as Aman, Bulgari, and Baccarat as sources of inspiration. Meanwhile, the home's color scheme, soft textures, and lighting are a nod to Niami and McClean's favorite Tom Ford boutique on Rodeo Drive.
The house boasts an extraordinary collection of art, including a butterfly work by Stephen Wilson on the lower level and a Niclas Castello bespoke panel in black and silver in the office, thanks to a cooperation between Creative Art Partners and Art Angels. There is also a sizable collection of bespoke furniture pieces from byShowroom.
A house of this size will never be erected again in Los Angeles, thanks to recently enacted city rules, so The One will truly be one of a kind. "For all of us, this project has been such a long and instructive trip," McClean says. "It was exciting to develop and approached with excitement, but I don't think any of us knew how much effort and time it would take to finish the project."
More on Lifestyle

Will Lockett
3 years ago
There Is A New EV King in Town

McMurtry Spéirling outperforms Tesla in speed and efficiency.
EVs were ridiculously slow for decades. However, the 2008 Tesla Roadster revealed that EVs might go extraordinarily fast. The Tesla Model S Plaid and Rimac Nevera are the fastest-accelerating road vehicles, despite combustion-engined road cars dominating the course. A little-known firm beat Tesla and Rimac in the 0-60 race, beat F1 vehicles on a circuit, and boasts a 350-mile driving range. The McMurtry Spéirling is completely insane.
Mat Watson of CarWow, a YouTube megastar, was recently handed a Spéirling and access to Silverstone Circuit (view video above). Mat ran a quarter-mile on Silverstone straight with former F1 driver Max Chilton. The little pocket-rocket automobile touched 100 mph in 2.7 seconds, completed the quarter mile in 7.97 seconds, and hit 0-60 in 1.4 seconds. When looking at autos quickly, 0-60 times can seem near. The Tesla Model S Plaid does 0-60 in 1.99 seconds, which is comparable to the Spéirling. Despite the meager statistics, the Spéirling is nearly 30% faster than Plaid!
My vintage VW Golf 1.4s has an 8.8-second 0-60 time, whereas a BMW Z4 3.0i is 30% faster (with a 0-60 time of 6 seconds). I tried to beat a Z4 off the lights in my Golf, but the Beamer flew away. If they challenge the Spéirling in a Model S Plaid, they'll feel as I did. Fast!
Insane quarter-mile drag time. Its road car record is 7.97 seconds. A Dodge Demon, meant to run extremely fast quarter miles, finishes so in 9.65 seconds, approximately 20% slower. The Rimac Nevera's 8.582-second quarter-mile record was miles behind drag racing. This run hampered the Spéirling. Because it was employing gearing that limited its top speed to 150 mph, it reached there in a little over 5 seconds without accelerating for most of the quarter mile! McMurtry can easily change the gearing, making the Spéirling run quicker.
McMurtry did this how? First, the Spéirling is a tiny single-seater EV with a 60 kWh battery pack, making it one of the lightest EVs ever. The 1,000-hp Spéirling has more than one horsepower per kg. The Nevera has 0.84 horsepower per kg and the Plaid 0.44.
However, you cannot simply construct a car light and power it. Instead of accelerating, it would spin. This makes the Spéirling a fan car. Its huge fans create massive downforce. These fans provide the Spéirling 2 tonnes of downforce while stationary, so you could park it on the ceiling. Its fast 0-60 time comes from its downforce, which lets it deliver all that power without wheel spin.
It also possesses complete downforce at all speeds, allowing it to tackle turns faster than even race vehicles. Spéirlings overcame VW IDRs and F1 cars to set the Goodwood Hill Climb record (read more here). The Spéirling is a dragstrip winner and track dominator, unlike the Plaid and Nevera.
The Spéirling is astonishing for a single-seater. Fan-generated downforce is more efficient than wings and splitters. It also means the vehicle has very minimal drag without the fan. The Spéirling can go 350 miles per charge (WLTP) or 20-30 minutes at full speed on a track despite its 60 kWh battery pack. The G-forces would hurt your neck before the battery died if you drove around a track for longer. The Spéirling can charge at over 200 kW in about 30 minutes. Thus, driving to track days, having fun, and returning is possible. Unlike other high-performance EVs.
Tesla, Rimac, or Lucid will struggle to defeat the Spéirling. They would need to build a fan automobile because adding power to their current vehicle would make it uncontrollable. The EV and automobile industries now have a new, untouchable performance king.

Tech With Dom
3 years ago
6 Awesome Desk Accessories You Must Have!
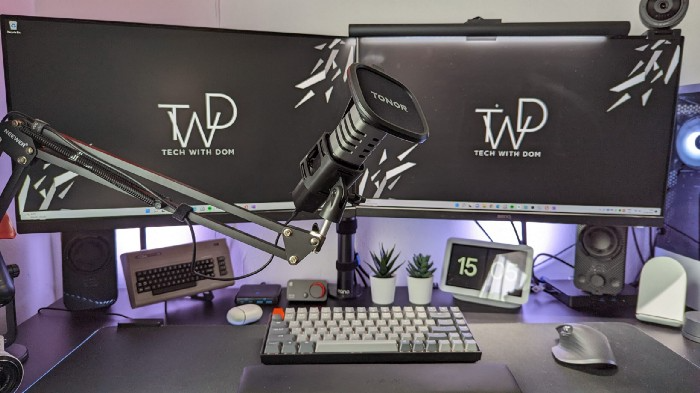
I'm gadget-obsessed. So I shared my top 6 desk gadgets.
These gadgets improve my workflow and are handy for working from home.
Without further ado...
Computer light bar Xiaomi Mi
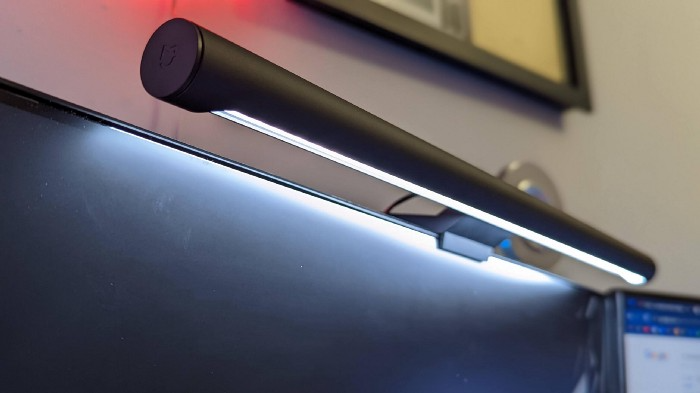
I've previously recommended the Xiaomi Mi Light Bar, and I still do. It's stylish and convenient.
The Mi bar is a monitor-mounted desk lamp. The lamp's hue and brightness can be changed with a stylish wireless remote.
Changeable hue and brightness make it ideal for late-night work.
Desk Mat 2.
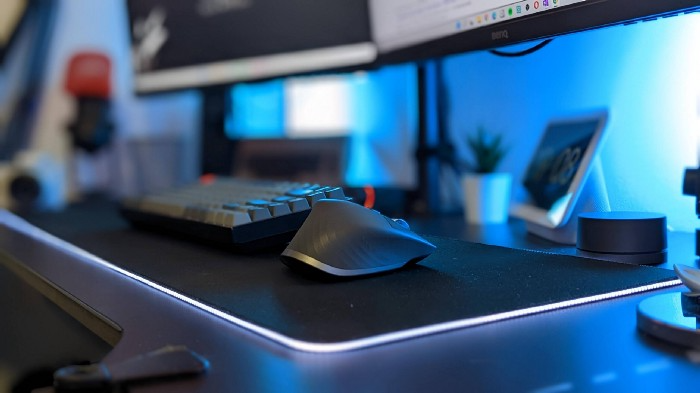
I wasn't planning to include a desk surface in this article, but I find it improves computer use.
The mouse feels smoother and is a better palm rest than wood or glass.
I'm currently using the overkill Razer Goliathus Extended Chroma RGB Gaming Surface, but I like RGB.
Using a desk surface or mat makes computer use more comfortable, and it's not expensive.
Third, the Logitech MX Master 3 Mouse
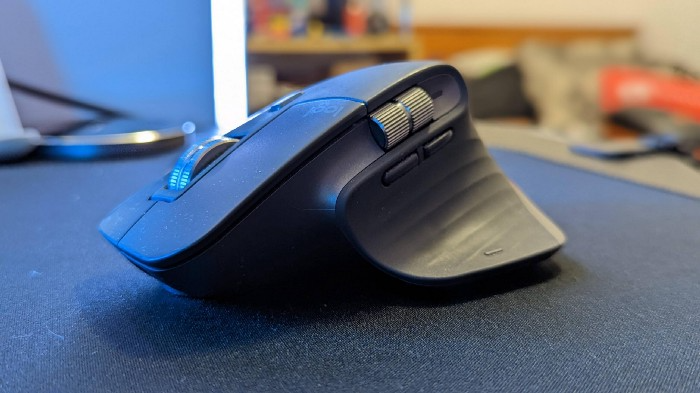
The Logitech MX Master 3 or any from the MX Master series is my favorite mouse.
The side scroll wheel on these mice is a feature I've never seen on another mouse.
Side scroll wheels are great for spreadsheets and video editing. It would be hard for me to switch from my Logitech MX Master 3 to another mouse. Only gaming is off-limits.
Google Nest 4.

Without a smart assistant, my desk is useless. I'm currently using the second-generation Google Nest Hub, but I've also used the Amazon Echo Dot, Echo Spot, and Apple HomePod Mini.
As a Pixel 6 Pro user, the Nest Hub works best with my phone.
My Nest Hub plays news, music, and calendar events. It also lets me control lights and switches with my smartphone. It plays YouTube videos.
Google Pixel Stand, No. 5

A wireless charger on my desk is convenient for charging my phone and other devices while I work. My desk has two wireless chargers. I have a Satechi aluminum fast charger and a second-generation Google Pixel Stand.
If I need to charge my phone and earbuds simultaneously, I use two wireless chargers. Satechi chargers are well-made and fast. Micro-USB is my only complaint.
The Pixel Stand converts compatible devices into a smart display for adjusting charging speeds and controlling other smart devices. My Pixel 6 Pro charges quickly. Here's my video review.
6. Anker Power Bank
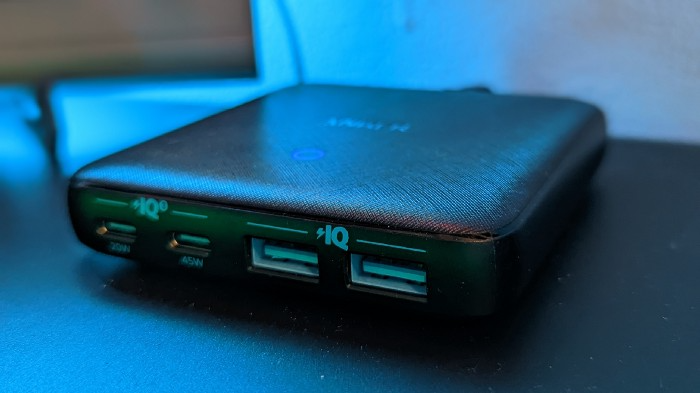
Anker's 65W charger is my final recommendation. This online find was a must-have. This can charge my laptop and several non-wireless devices, perfect for any techie!
The charger has two USB-A ports and two USB-C ports, one with 45W and the other with 20W, so it can charge my iPad Pro and Pixel 6 Pro simultaneously.
Summary
These are some of my favorite office gadgets. My kit page has an updated list.
Links to the products mentioned in this article are in the appropriate sections. These are affiliate links.
You're up! Share the one desk gadget you can't live without and why.
Josh Chesler
4 years ago
10 Sneaker Terms Every Beginner Should Know
So you want to get into sneakers? Buying a few sneakers and figuring it out seems simple. Then you miss out on the weekend's instant-sellout releases, so you head to eBay, Twitter, or your local sneaker group to see what's available, since you're probably not ready to pay Flight Club prices just yet.
That's when you're bombarded with new nicknames, abbreviations, and general sneaker slang. It would take months to explain every word and sneaker, so here's a starter kit of ten simple terms to get you started. (Yeah, mostly Jordan. Does anyone really start with Kith or Nike SB?)
10. Colorways
Colorways are a common term in fashion, design, and other visual fields. It's just the product's color scheme. In the case of sneakers, the colorway is often as important as the actual model. Are this year's "Chicago" Air Jordan 1s more durable than last year's "Black/Gum" colorway? Because of their colorway and rarity, the Chicagos are worth roughly three pairs of the Black/Gum kicks.
Pro Tip: A colorway with a well-known nickname is almost always worth more than one without, and the same goes for collaborations.
9. Beaters
A “beater” is a well-worn, likely older model of shoe that has significant wear and tear on it. Rarely sold with the original box or extra laces, beaters rarely sell for much. Unlike most “worn” sneakers, beaters are used for rainy days and the gym. It's exactly what it sounds like, a box full of beaters, and they're a good place to start if you're looking for some cheap old kicks.
Pro Tip: Know which shoes clean up nicely. The shape of lower top sneakers with wider profiles, like SB Dunk Lows and Air Jordan 3s, tends to hold better over time than their higher and narrower cousins.
8. Retro
In the world of Jordan Brand, a “Retro” release is simply a release (or re-release) of a colorway after the shoe model's initial release. For example, the original Air Jordan 7 was released in 1992, but the Bordeaux colorway was re-released in 2011 and recently (2015). An Air Jordan model is released every year, and while half of them are unpopular and unlikely to be Retroed soon, any of them could be re-released whenever Nike and Jordan felt like it.
Pro Tip: Now that the Air Jordan line has been around for so long, the model that tends to be heavily retroed in a year is whichever shoe came out 23 (Michael Jordan’s number during the prime of his career) years ago. The Air Jordan 6 (1991) got new colorways last year, the Air Jordan 7 this year, and more Air Jordan 8s will be released later this year and early next year (1993).
7. PP/Inv
In spite of the fact that eBay takes roughly 10% of the final price, many sneaker buyers and sellers prefer to work directly with PayPal. Selling sneakers for $100 via PayPal invoice or $100 via PayPal friends/family is common on social media. Because no one wants their eBay account suspended for promoting PayPal deals, many eBay sellers will simply state “Message me for a better price.”
Pro Tip: PayPal invoices protect buyers well, but gifting or using Google Wallet does not. Unless you're certain the seller is legitimate, only use invoiced goods/services payments.
6. Yeezy
Kanye West and his sneakers are known as Yeezys. The rapper's first two Yeezys were made by Nike before switching to Adidas. Everything Yeezy-related will be significantly more expensive (and therefore have significantly more fakes made). Not only is the Nike Air Yeezy 2 “Red October” one of the most sought-after sneakers, but the Yeezy influence can be seen everywhere.
Pro Tip: If you're going to buy Yeezys, make sure you buy them from a reputable retailer or reseller. With so many fakes out there, it's not worth spending a grand on something you're not 100% sure is real.
5. GR/Limited
Regardless of how visually repulsive, uncomfortable, and/or impractical a sneaker is, if it’s rare enough, people will still want it. GR stands for General Release, which means they're usually available at retail. Reselling a “Limited Edition” release is costly. Supply and demand, but in this case, the limited supply drives up demand. If you want to get some of the colorways made for rappers, NBA players (Player Exclusive or PE models), and other celebrities, be prepared to pay a premium.
Pro Tip: Limited edition sneakers, like the annual Doernbecher Freestyle sneakers Nike creates with kids from Portland's Doernbecher Children's Hospital, will always be more expensive and limited. Or, you can use automated sneaker-buying software.
4. Grails
A “grail” is a pair of sneakers that someone desires above all others. To obtain their personal grails, people are willing to pay significantly more than the retail price. There doesn't have to be any rhyme or reason why someone chose a specific pair as their grails.
Pro Tip: For those who don't have them, the OG "Bred" or "Royal" Air Jordan 1s, the "Concord" Air Jordan 11s, etc., are all grails.
3. Bred
Anything released in “Bred” (black and red) will sell out quickly. Most resale Air Jordans (and other sneakers) come in the Bred colorway, which is a fan favorite. Bred is a good choice for a first colorway, especially on a solid sneaker silhouette.
Pro Tip: Apart from satisfying the world's hypebeasts, Bred sneakers will probably match a lot of your closet.
2. DS
DS = Deadstock = New. That's it. If something has been worn or tried on, it is no longer DS. Very Near Deadstock (VNDS) Pass As Deadstock It's a cute way of saying your sneakers have been worn but are still in good shape. In the sneaker world, “worn” means they are no longer new, but not too old or beat up.
Pro Tip: Ask for photos of any marks or defects to see what you’re getting before you buy used shoes, also find out if they come with the original box and extra laces, because that can be a sign that they’re in better shape.
1. Fake/Unauthorized
The words “Unauthorized,” “Replica,” “B-grades,” and “Super Perfect” all mean the shoes are fake. It means they aren't made by the actual company, no matter how close or how good the quality. If that's what you want, go ahead and get them. Do not wear them if you do not want the rest of the sneaker world to mock them.
Pro Tip: If you’re not sure if shoes are real or not, do a “Legit Check” on Twitter or Facebook. You'll get dozens of responses in no time.
You might also like

Joseph Mavericks
3 years ago
Apples Top 100 Meeting: Steve Jobs's Secret Agenda's Lessons
Jobs' secret emails became public due to a litigation with Samsung.
Steve Jobs sent Phil Schiller an email at the end of 2010. Top 100 A was the codename for Apple's annual Top 100 executive meetings. The 2011 one was scheduled.
Everything about this gathering is secret, even attendance. The location is hidden, and attendees can't even drive themselves. Instead, buses transport them to a 2-3 day retreat.
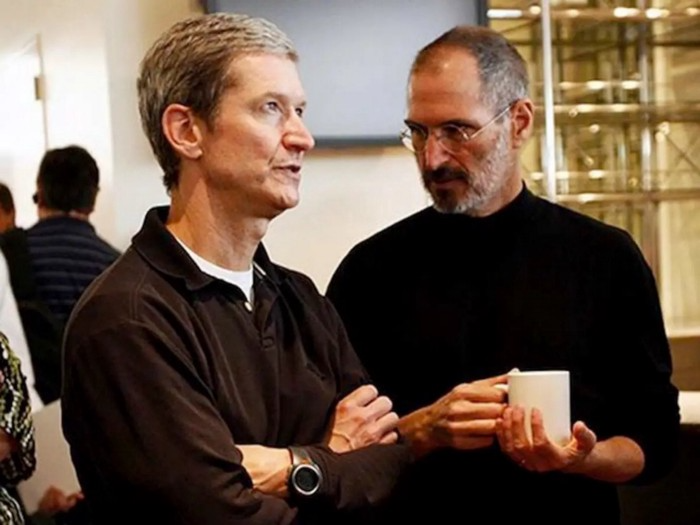
Due to a litigation with Samsung, this Top 100 meeting's agenda was made public in 2014. This was a critical milestone in Apple's history, not a Top 100 meeting. Apple had many obstacles in the 2010s to remain a technological leader. Apple made more money with non-PC goods than with its best-selling Macintosh series. This was the last Top 100 gathering Steve Jobs would attend before passing, and he wanted to make sure his messages carried on before handing over his firm to Tim Cook.
In this post, we'll discuss lessons from Jobs' meeting agenda. Two sorts of entrepreneurs can use these tips:
Those who manage a team in a business and must ensure that everyone is working toward the same goals, upholding the same principles, and being inspired by the same future.
Those who are sole proprietors or independent contractors and who must maintain strict self-discipline in order to stay innovative in their industry and adhere to their own growth strategy.
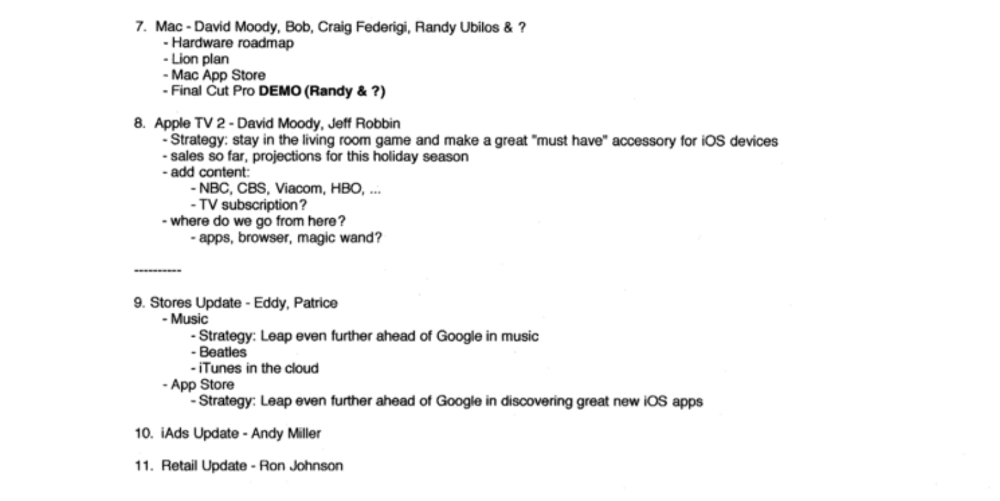
Here's Steve Jobs's email outlining the annual meeting agenda. It's an 11-part summary of the company's shape and strategy.
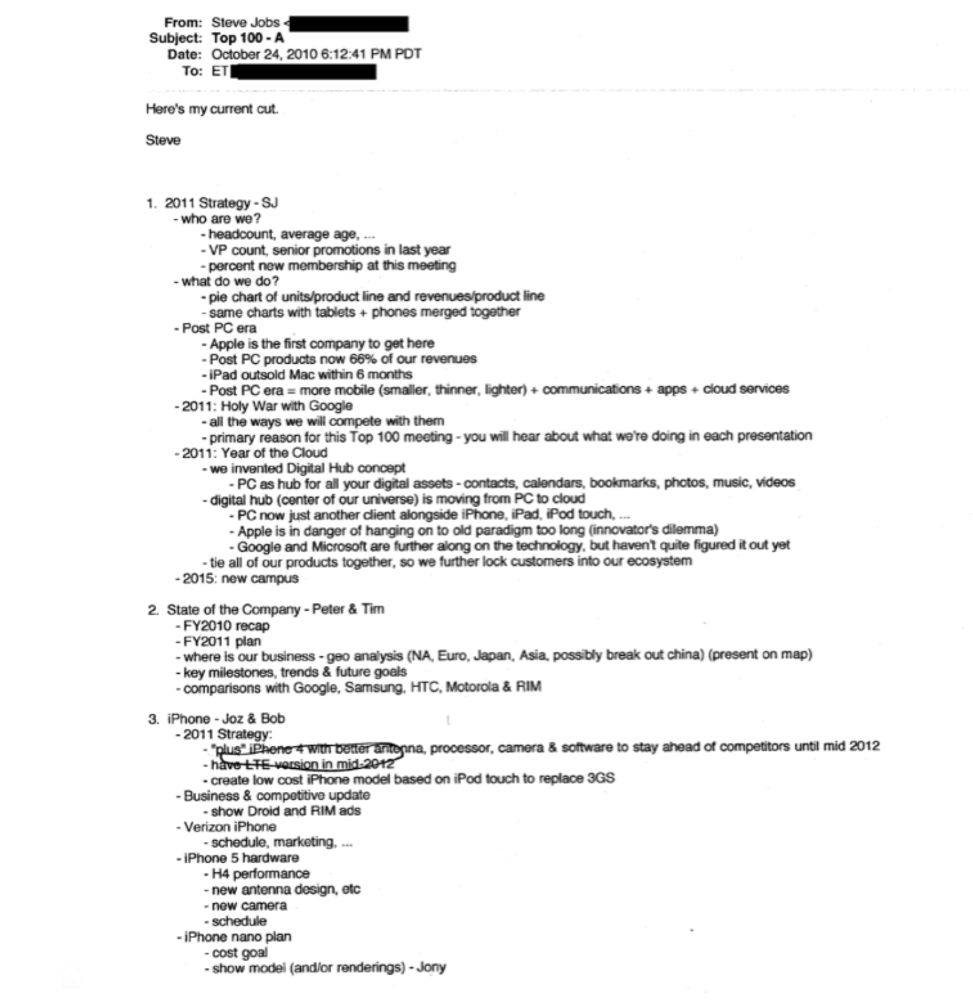

Steve Jobs outlines Apple's 2011 strategy, 10/24/10
1. Correct your data
Business leaders must comprehend their company's metrics. Jobs either mentions critical information he already knows or demands slides showing the numbers he wants. These numbers fall under 2 categories:
Metrics for growth and strategy
As we will see, this was a crucial statistic for Apple since it signaled the beginning of the Post PC era and required them to make significant strategic changes in order to stay ahead of the curve. Post PC products now account for 66% of our revenues.
Within six months, iPad outsold Mac, another sign of the Post-PC age. As we will see, Jobs thought the iPad would be the next big thing, and item number four on the agenda is one of the most thorough references to the iPad.
Geographical analysis: Here, Jobs emphasizes China, where the corporation has a slower start than anticipated. China was dominating Apple's sales growth with 16% of revenue one year after this meeting.
Metrics for people & culture
The individuals that make up a firm are more significant to its success than its headcount or average age. That holds true regardless of size, from a 5-person startup to a Fortune 500 firm. Jobs was aware of this, which is why his suggested agenda begins by emphasizing demographic data.
Along with the senior advancements in the previous year's requested statistic, it's crucial to demonstrate that if the business is growing, the employees who make it successful must also grow.
2. Recognize the vulnerabilities and strengths of your rivals
Steve Jobs was known for attacking his competition in interviews and in his strategies and roadmaps. This agenda mentions 18 competitors, including:
Google 7 times
Android 3 times
Samsung 2 times
Jobs' agenda email was issued 6 days after Apple's Q4 results call (2010). On the call, Jobs trashed Google and Android. His 5-minute intervention included:
Google has acknowledged that the present iteration of Android is not tablet-optimized.
Future Android tablets will not work (Dead On Arrival)
While Google Play only has 90,000 apps, the Apple App Store has 300,000.
Android is extremely fragmented and is continuing to do so.
The App Store for iPad contains over 35,000 applications. The market share of the latest generation of tablets (which debuted in 2011) will be close to nil.
Jobs' aim in blasting the competition on that call was to reassure investors about the upcoming flood of new tablets. Jobs often criticized Google, Samsung, and Microsoft, but he also acknowledged when they did a better job. He was great at detecting his competitors' advantages and devising ways to catch up.
Jobs doesn't hold back when he says in bullet 1 of his agenda: "We further lock customers into our ecosystem while Google and Microsoft are further along on the technology, but haven't quite figured it out yet tie all of our goods together."
The plan outlined in bullet point 5 is immediately clear: catch up to Android where we are falling behind (notifications, tethering, and speech), and surpass them (Siri,). It's important to note that Siri frequently let users down and never quite lived up to expectations.
Regarding MobileMe, see Bullet 6 Jobs admits that when it comes to cloud services like contacts, calendars, and mail, Google is far ahead of Apple.
3. Adapt or perish
Steve Jobs was a visionary businessman. He knew personal computers were the future when he worked on the first Macintosh in the 1980s.
Jobs acknowledged the Post-PC age in his 2010 D8 interview.
Will the tablet replace the laptop, Walt Mossberg questioned Jobs? Jobs' response:
“You know, when we were an agrarian nation, all cars were trucks, because that’s what you needed on the farm. As vehicles started to be used in the urban centers and America started to move into those urban and suburban centers, cars got more popular and innovations like automatic transmission and things that you didn’t care about in a truck as much started to become paramount in cars. And now, maybe 1 out of every 25 vehicles is a truck, where it used to be 100%. PCs are going to be like trucks. They’re still going to be around, still going to have a lot of value, but they’re going to be used by one out of X people.”
Imagine how forward-thinking that was in 2010, especially for the Macintosh creator. You have to be willing to recognize that things were changing and that it was time to start over and focus on the next big thing.
Post-PC is priority number 8 in his 2010 agenda's 2011 Strategy section. Jobs says Apple is the first firm to get here and that Post PC items account about 66% of our income. The iPad outsold the Mac in 6 months, and the Post-PC age means increased mobility (smaller, thinner, lighter). Samsung had just introduced its first tablet, while Apple was working on the iPad 3. (as mentioned in bullet 4).
4. Plan ahead (and different)
Jobs' agenda warns that Apple risks clinging to outmoded paradigms. Clayton Christensen explains in The Innovators Dilemma that huge firms neglect disruptive technologies until they become profitable. Samsung's Galaxy tab, released too late, never caught up to Apple.
Apple faces a similar dilemma with the iPhone, its cash cow for over a decade. It doesn't sell as much because consumers aren't as excited about new iPhone launches and because technology is developing and cell phones may need to be upgraded.
Large companies' established consumer base typically hinders innovation. Clayton Christensen emphasizes that loyal customers from established brands anticipate better versions of current products rather than something altogether fresh and new technologies.
Apple's marketing is smart. Apple's ecosystem is trusted by customers, and its products integrate smoothly. So much so that Apple can afford to be a disruptor by doing something no one has ever done before, something the world's largest corporation shouldn't be the first to try. Apple can test the waters and produce a tremendous innovation tsunami, something few corporations can do.
In March 2011, Jobs appeared at an Apple event. During his address, Steve reminded us about Apple's brand:
“It’s in Apple’s DNA, that technology alone is not enough. That it’s technology married with liberal arts, married with the humanities that yields us the results that make our hearts sink. And nowhere is that more true that in these Post-PC devices.“
More than a decade later, Apple remains one of the most innovative and trailblazing companies in the Post-PC world (industry-disrupting products like Airpods or the Apple Watch came out after that 2011 strategy meeting), and it has reinvented how we use laptops with its M1-powered line of laptops offering unprecedented performance.
A decade after Jobs' death, Apple remains the world's largest firm, and its former CEO had a crucial part in its expansion. If you can do 1% of what Jobs did, you may be 1% as successful.
Not bad.
David Z. Morris
3 years ago
FTX's crash was no accident, it was a crime

Sam Bankman Fried (SDBF) is a legendary con man. But the NYT might not tell you that...
Since SBF's empire was revealed to be a lie, mainstream news organizations and commentators have failed to give readers a straightforward assessment. The New York Times and Wall Street Journal have uncovered many key facts about the scandal, but they have also soft-peddled Bankman-Fried's intent and culpability.
It's clear that the FTX crypto exchange and Alameda Research committed fraud to steal money from users and investors. That’s why a recent New York Times interview was widely derided for seeming to frame FTX’s collapse as the result of mismanagement rather than malfeasance. A Wall Street Journal article lamented FTX's loss of charitable donations, bolstering Bankman's philanthropic pose. Matthew Yglesias, court chronicler of the neoliberal status quo, seemed to whitewash his own entanglements by crediting SBF's money with helping Democrats in 2020 – sidestepping the likelihood that the money was embezzled.
Many outlets have called what happened to FTX a "bank run" or a "run on deposits," but Bankman-Fried insists the company was overleveraged and disorganized. Both attempts to frame the fallout obscure the core issue: customer funds misused.
Because banks lend customer funds to generate returns, they can experience "bank runs." If everyone withdraws at once, they can experience a short-term cash crunch but there won't be a long-term problem.
Crypto exchanges like FTX aren't banks. They don't do bank-style lending, so a withdrawal surge shouldn't strain liquidity. FTX promised customers it wouldn't lend or use their crypto.
Alameda's balance sheet blurs SBF's crypto empire.
The funds were sent to Alameda Research, where they were apparently gambled away. This is massive theft. According to a bankruptcy document, up to 1 million customers could be affected.
In less than a month, reporting and the bankruptcy process have uncovered a laundry list of decisions and practices that would constitute financial fraud if FTX had been a U.S.-regulated entity, even without crypto-specific rules. These ploys may be litigated in U.S. courts if they enabled the theft of American property.
The list is very, very long.
The many crimes of Sam Bankman-Fried and FTX
At the heart of SBF's fraud are the deep and (literally) intimate ties between FTX and Alameda Research, a hedge fund he co-founded. An exchange makes money from transaction fees on user assets, but Alameda trades and invests its own funds.
Bankman-Fried called FTX and Alameda "wholly separate" and resigned as Alameda's CEO in 2019. The two operations were closely linked. Bankman-Fried and Alameda CEO Caroline Ellison were romantically linked.
These circumstances enabled SBF's sin. Within days of FTX's first signs of weakness, it was clear the exchange was funneling customer assets to Alameda for trading, lending, and investing. Reuters reported on Nov. 12 that FTX sent $10 billion to Alameda. As much as $2 billion was believed to have disappeared after being sent to Alameda. Now the losses look worse.
It's unclear why those funds were sent to Alameda or when Bankman-Fried betrayed his depositors. On-chain analysis shows most FTX to Alameda transfers occurred in late 2021, and bankruptcy filings show both lost $3.7 billion in 2021.
SBF's companies lost millions before the 2022 crypto bear market. They may have stolen funds before Terra and Three Arrows Capital, which killed many leveraged crypto players.
FTT loans and prints
CoinDesk's report on Alameda's FTT holdings ignited FTX and Alameda Research. FTX created this instrument, but only a small portion was traded publicly; FTX and Alameda held the rest. These holdings were illiquid, meaning they couldn't be sold at market price. Bankman-Fried valued its stock at the fictitious price.
FTT tokens were reportedly used as collateral for loans, including FTX loans to Alameda. Close ties between FTX and Alameda made the FTT token harder or more expensive to use as collateral, reducing the risk to customer funds.
This use of an internal asset as collateral for loans between clandestinely related entities is similar to Enron's 1990s accounting fraud. These executives served 12 years in prison.
Alameda's margin liquidation exemption
Alameda Research had a "secret exemption" from FTX's liquidation and margin trading rules, according to legal filings by FTX's new CEO.
FTX, like other crypto platforms and some equity or commodity services, offered "margin" or loans for trades. These loans are usually collateralized, meaning borrowers put up other funds or assets. If a margin trade loses enough money, the exchange will sell the user's collateral to pay off the initial loan.
Keeping asset markets solvent requires liquidating bad margin positions. Exempting Alameda would give it huge advantages while exposing other FTX users to hidden risks. Alameda could have kept losing positions open while closing out competitors. Alameda could lose more on FTX than it could pay back, leaving a hole in customer funds.
The exemption is criminal in multiple ways. FTX was fraudulently marketed overall. Instead of a level playing field, there were many customers.
Above them all, with shotgun poised, was Alameda Research.
Alameda front-running FTX listings
Argus says there's circumstantial evidence that Alameda Research had insider knowledge of FTX's token listing plans. Alameda was able to buy large amounts of tokens before the listing and sell them after the price bump.
If true, these claims would be the most brazenly illegal of Alameda and FTX's alleged shenanigans. Even if the tokens aren't formally classified as securities, insider trading laws may apply.
In a similar case this year, an OpenSea employee was charged with wire fraud for allegedly insider trading. This employee faces 20 years in prison for front-running monkey JPEGs.
Huge loans to executives
Alameda Research reportedly lent FTX executives $4.1 billion, including massive personal loans. Bankman-Fried received $1 billion in personal loans and $2.3 billion for an entity he controlled, Paper Bird. Nishad Singh, director of engineering, was given $543 million, and FTX Digital Markets co-CEO Ryan Salame received $55 million.
FTX has more smoking guns than a Texas shooting range, but this one is the smoking bazooka – a sign of criminal intent. It's unclear how most of the personal loans were used, but liquidators will have to recoup the money.
The loans to Paper Bird were even more worrisome because they created another related third party to shuffle assets. Forbes speculates that some Paper Bird funds went to buy Binance's FTX stake, and Paper Bird committed hundreds of millions to outside investments.
FTX Inner Circle: Who's Who
That included many FTX-backed VC funds. Time will tell if this financial incest was criminal fraud. It fits Bankman-pattern Fried's of using secret flows, leverage, and funny money to inflate asset prices.
FTT or loan 'bailouts'
Also. As the crypto bear market continued in 2022, Bankman-Fried proposed bailouts for bankrupt crypto lenders BlockFi and Voyager Digital. CoinDesk was among those deceived, welcoming SBF as a J.P. Morgan-style sector backstop.
In a now-infamous interview with CNBC's "Squawk Box," Bankman-Fried referred to these decisions as bets that may or may not pay off.
But maybe not. Bloomberg's Matt Levine speculated that FTX backed BlockFi with FTT money. This Monopoly bailout may have been intended to hide FTX and Alameda liabilities that would have been exposed if BlockFi went bankrupt sooner. This ploy has no name, but it echoes other corporate frauds.
Secret bank purchase
Alameda Research invested $11.5 million in the tiny Farmington State Bank, doubling its net worth. As a non-U.S. entity and an investment firm, Alameda should have cleared regulatory hurdles before acquiring a U.S. bank.
In the context of FTX, the bank's stake becomes "ominous." Alameda and FTX could have done more shenanigans with bank control. Compare this to the Bank for Credit and Commerce International's failed attempts to buy U.S. banks. BCCI was even nefarious than FTX and wanted to buy U.S. banks to expand its money-laundering empire.
The mainstream's mistakes
These are complex and nuanced forms of fraud that echo traditional finance models. This obscurity helped Bankman-Fried masquerade as an honest player and likely kept coverage soft after the collapse.
Bankman-Fried had a scruffy, nerdy image, like Mark Zuckerberg and Adam Neumann. In interviews, he spoke nonsense about an industry full of jargon and complicated tech. Strategic donations and insincere ideological statements helped him gain political and social influence.
SBF' s'Effective' Altruism Blew Up FTX
Bankman-Fried has continued to muddy the waters with disingenuous letters, statements, interviews, and tweets since his con collapsed. He's tried to portray himself as a well-intentioned but naive kid who made some mistakes. This is a softer, more pernicious version of what Trump learned from mob lawyer Roy Cohn. Bankman-Fried doesn't "deny, deny, deny" but "confuse, evade, distort."
It's mostly worked. Kevin O'Leary, who plays an investor on "Shark Tank," repeats Bankman-SBF's counterfactuals. O'Leary called Bankman-Fried a "savant" and "probably one of the most accomplished crypto traders in the world" in a Nov. 27 interview with Business Insider, despite recent data indicating immense trading losses even when times were good.
O'Leary's status as an FTX investor and former paid spokesperson explains his continued affection for Bankman-Fried despite contradictory evidence. He's not the only one promoting Bankman-Fried. The disgraced son of two Stanford law professors will defend himself at Wednesday's DealBook Summit.
SBF's fraud and theft rival those of Bernie Madoff and Jho Low. Whether intentionally or through malign ineptitude, the fraud echoes Worldcom and Enron.
The Perverse Impacts of Anti-Money-Laundering
The principals in all of those scandals wound up either sentenced to prison or on the run from the law. Sam Bankman-Fried clearly deserves to share their fate.
Read the full article here.

The woman
3 years ago
Because he worked on his side projects during working hours, my junior was fired and sued.
Many developers do it, but I don't approve.

Aren't many programmers part-time? Many work full-time but also freelance. If the job agreement allows it, I see no problem.
Tech businesses' policies vary. I have a friend in Google, Germany. According to his contract, he couldn't do an outside job. Google owns any code he writes while employed.
I was shocked. Later, I found that different Google regions have different policies.
A corporation can normally establish any agreement before hiring you. They're negotiable. When there's no agreement, state law may apply. In court, law isn't so simple.
I won't delve into legal details. Instead, let’s talk about the incident.
How he was discovered
In one month, he missed two deadlines. His boss was frustrated because the assignment wasn't difficult to miss twice. When a team can't finish work on time, they all earn bad grades.
He annoyed the whole team. One team member (anonymous) told the project manager he worked on side projects during office hours. He may have missed deadlines because of this.
The project manager was furious. He needed evidence. The manager caught him within a week. The manager told higher-ups immediately.
The company wanted to set an example
Management could terminate him and settle the problem. But the company wanted to set an example for those developers who breached the regulation.
Because dismissal isn't enough. Every organization invests heavily in developer hiring. If developers depart or are fired after a few months, the company suffers.
The developer spent 10 months there. The employer sacked him and demanded ten months' pay. Or they'd sue him.
It was illegal and unethical. The youngster paid the fine and left the company quietly to protect his career.
Right or wrong?
Is the developer's behavior acceptable? Let's discuss developer malpractice.
During office hours, may developers work on other projects? If they're bored during office hours, they might not. Check the employment contract or state law.
If there's no employment clause, check country/state law. Because you can't justify breaking the law. Always. Most employers own their employees' work hours unless it's a contractual position.
If the company agrees, it's fine.
I also oppose companies that force developers to work overtime without pay.
Most states and countries have laws that help companies and workers. Law supports employers in this case. If any of the following are true, the company/employer owns the IP under California law.
using the business's resources
any equipment, including a laptop used for business.
company's mobile device.
offices of the company.
business time as well. This is crucial. Because this occurred in the instance of my junior.
Company resources are dangerous. Because your company may own the product's IP. If you have seen the TV show Silicon Valley, you have seen a similar situation there, right?
Conclusion
Simple rule. I avoid big side projects. I work on my laptop on weekends for side projects. I'm safe. But I also know that my company might not be happy with that.
As an employee, I suppose I can. I can make side money. I won't promote it, but I'll respect their time, resources, and task. I also sometimes work extra time to finish my company’s deadlines.