


More on Science

Katrina Paulson
2 months ago
Dehumanization Against Anthropomorphization
We've fought for humanity's sake. We need equilibrium.

We live in a world of opposites (black/white, up/down, love/hate), thus life is a game of achieving equilibrium. We have a universe of paradoxes within ourselves, not just in physics.
Individually, you balance your intellect and heart, but as a species, we're full of polarities. They might be gentle and compassionate, then ruthless and unsympathetic.
We desire for connection so much that we personify non-human beings and objects while turning to violence and hatred toward others. These contrasts baffle me. Will we find balance?
Anthropomorphization
Assigning human-like features or bonding with objects is common throughout childhood. Cartoons often give non-humans human traits. Adults still anthropomorphize this trait. Researchers agree we start doing it as infants and continue throughout life.
Humans of all ages are good at humanizing stuff. We build emotional attachments to weather events, inanimate objects, animals, plants, and locales. Gods, goddesses, and fictitious figures are anthropomorphized.
Cast Away, starring Tom Hanks, features anthropization. Hanks is left on an island, where he builds an emotional bond with a volleyball he calls Wilson.
We became emotionally invested in Wilson, including myself.
Why do we do it, though?
Our instincts and traits helped us survive and thrive. Our brain is alert to other people's thoughts, feelings, and intentions to assist us to determine who is safe or hazardous. We can think about others and our own mental states, or about thinking. This is the Theory of Mind.
Neurologically, specialists believe the Theory of Mind has to do with our mirror neurons, which exhibit the same activity while executing or witnessing an action.
Mirror neurons may contribute to anthropization, but they're not the only ones. In 2021, Harvard Medical School researchers at MGH and MIT colleagues published a study on the brain's notion of mind.
“Our study provides evidence to support theory of mind by individual neurons. Until now, it wasn’t clear whether or how neurons were able to perform these social cognitive computations.”
Neurons have particular functions, researchers found. Others encode information that differentiates one person's beliefs from another's. Some neurons reflect tale pieces, whereas others aren't directly involved in social reasoning but may multitask contributing factors.
Combining neuronal data gives a precise portrait of another's beliefs and comprehension. The theory of mind describes how we judge and understand each other in our species, and it likely led to anthropomorphism. Neuroscience indicates identical brain regions react to human or non-human behavior, like mirror neurons.
Some academics believe we're wired for connection, which explains why we anthropomorphize. When we're alone, we may anthropomorphize non-humans.
Humanizing non-human entities may make them deserving of moral care, according to another theory. Animamorphizing something makes it responsible for its actions and deserves punishments or rewards. This mental shift is typically apparent in our connections with pets and leads to deanthropomorphization.
Dehumanization
Dehumanizing involves denying someone or anything ethical regard, the opposite of anthropomorphizing.
Dehumanization occurs throughout history. We do it to everything in nature, including ourselves. We experiment on and torture animals. We enslave, hate, and harm other groups of people.
Race, immigrant status, dress choices, sexual orientation, social class, religion, gender, politics, need I go on? Our degrading behavior is promoting fascism and division everywhere.
Dehumanizing someone or anything reduces their agency and value. Many assume they're immune to this feature, but tests disagree.
It's inevitable. Humans are wired to have knee-jerk reactions to differences. We are programmed to dehumanize others, and it's easier than we'd like to admit.
Why do we do it, though?
Dehumanizing others is simpler than humanizing things for several reasons. First, we consider everything unusual as harmful, which has helped our species survive for hundreds of millions of years. Our propensity to be distrustful of others, like our fear of the unknown, promotes an us-vs.-them mentality.
Since WWII, various studies have been done to explain how or why the holocaust happened. How did so many individuals become radicalized to commit such awful actions and feel morally justified? Researchers quickly showed how easily the mind can turn gloomy.
Stanley Milgram's 1960s electroshock experiment highlighted how quickly people bow to authority to injure others. Philip Zimbardo's 1971 Stanford Prison Experiment revealed how power may be abused.
The us-versus-them attitude is natural and even young toddlers act on it. Without a relationship, empathy is more difficult.
It's terrifying how quickly dehumanizing behavior becomes commonplace. The current pandemic is an example. Most countries no longer count deaths. Long Covid is a major issue, with predictions of a handicapped tsunami in the future years. Mostly, we shrug.
In 2020, we panicked. Remember everyone's caution? Now Long Covid is ruining more lives, threatening to disable an insane amount of our population for months or their entire lives.
There's little research. Experts can't even classify or cure it. The people should be outraged, but most have ceased caring. They're over covid.
We're encouraged to find a method to live with a terrible pandemic that will cause years of damage. People aren't worried about infection anymore. They shrug and say, "We'll all get it eventually," then hope they're not one of the 30% who develops Long Covid.
We can correct course before further damage. Because we can recognize our urges and biases, we're not captives to them. We can think critically about our thoughts and behaviors, then attempt to improve. We can recognize our deficiencies and work to attain balance.
Changing perspectives
We're currently attempting to find equilibrium between opposites. It's superficial to defend extremes by stating we're only human or wired this way because both imply we have no control.
Being human involves having self-awareness, and by being careful of our thoughts and acts, we can find balance and recognize opposites' purpose.
Extreme anthropomorphizing and dehumanizing isolate and imperil us. We anthropomorphize because we desire connection and dehumanize because we're terrified, frequently of the connection we crave. Will we find balance?
Katrina Paulson ponders humanity, unanswered questions, and discoveries. Please check out her newsletters, Curious Adventure and Curious Life.

Adam Frank
3 months ago
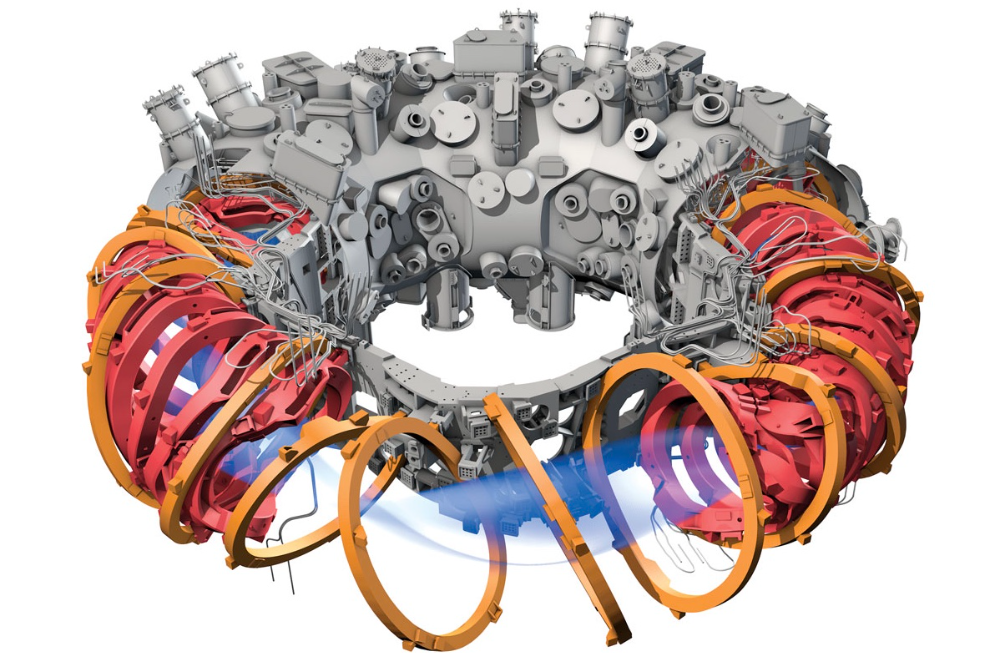
Humanity is not even a Type 1 civilization. What might a Type 3 be capable of?
The Kardashev scale grades civilizations from Type 1 to Type 3 based on energy harvesting.
How do technologically proficient civilizations emerge across timescales measuring in the tens of thousands or even millions of years? This is a question that worries me as a researcher in the search for “technosignatures” from other civilizations on other worlds. Since it is already established that longer-lived civilizations are the ones we are most likely to detect, knowing something about their prospective evolutionary trajectories could be translated into improved search tactics. But even more than knowing what to seek for, what I really want to know is what happens to a society after so long time. What are they capable of? What do they become?
This was the question Russian SETI pioneer Nikolai Kardashev asked himself back in 1964. His answer was the now-famous “Kardashev Scale.” Kardashev was the first, although not the last, scientist to try and define the processes (or stages) of the evolution of civilizations. Today, I want to launch a series on this question. It is crucial to technosignature studies (of which our NASA team is hard at work), and it is also important for comprehending what might lay ahead for mankind if we manage to get through the bottlenecks we have now.
The Kardashev scale
Kardashev’s question can be expressed another way. What milestones in a civilization’s advancement up the ladder of technical complexity will be universal? The main notion here is that all (or at least most) civilizations will pass through some kind of definable stages as they progress, and some of these steps might be mirrored in how we could identify them. But, while Kardashev’s major focus was identifying signals from exo-civilizations, his scale gave us a clear way to think about their evolution.
The classification scheme Kardashev employed was not based on social systems of ethics because they are something that we can probably never predict about alien cultures. Instead, it was built on energy, which is something near and dear to the heart of everybody trained in physics. Energy use might offer the basis for universal stages of civilisation progression because you cannot do the work of establishing a civilization without consuming energy. So, Kardashev looked at what energy sources were accessible to civilizations as they evolved technologically and used those to build his scale.
From Kardashev’s perspective, there are three primary levels or “types” of advancement in terms of harvesting energy through which a civilization should progress.
Type 1: Civilizations that can capture all the energy resources of their native planet constitute the first stage. This would imply capturing all the light energy that falls on a world from its host star. This makes it reasonable, given solar energy will be the largest source available on most planets where life could form. For example, Earth absorbs hundreds of atomic bombs’ worth of energy from the Sun every second. That is a rather formidable energy source, and a Type 1 race would have all this power at their disposal for civilization construction.
Type 2: These civilizations can extract the whole energy resources of their home star. Nobel Prize-winning scientist Freeman Dyson famously anticipated Kardashev’s thinking on this when he imagined an advanced civilization erecting a large sphere around its star. This “Dyson Sphere” would be a machine the size of the complete solar system for gathering stellar photons and their energy.
Type 3: These super-civilizations could use all the energy produced by all the stars in their home galaxy. A normal galaxy has a few hundred billion stars, so that is a whole lot of energy. One way this may be done is if the civilization covered every star in their galaxy with Dyson spheres, but there could also be more inventive approaches.
Implications of the Kardashev scale
Climbing from Type 1 upward, we travel from the imaginable to the god-like. For example, it is not hard to envisage utilizing lots of big satellites in space to gather solar energy and then beaming that energy down to Earth via microwaves. That would get us to a Type 1 civilization. But creating a Dyson sphere would require chewing up whole planets. How long until we obtain that level of power? How would we have to change to get there? And once we get to Type 3 civilizations, we are virtually thinking about gods with the potential to engineer the entire cosmos.
For me, this is part of the point of the Kardashev scale. Its application for thinking about identifying technosignatures is crucial, but even more strong is its capacity to help us shape our imaginations. The mind might become blank staring across hundreds or thousands of millennia, and so we need tools and guides to focus our attention. That may be the only way to see what life might become — what we might become — once it arises to start out beyond the boundaries of space and time and potential.
This is a summary. Read the full article here.

Sara_Mednick
2 months ago
Since I'm a scientist, I oppose biohacking
Understanding your own energy depletion and restoration is how to truly optimize
Hack has meant many bad things for centuries. In the 1800s, a hack was a meager horse used to transport goods.
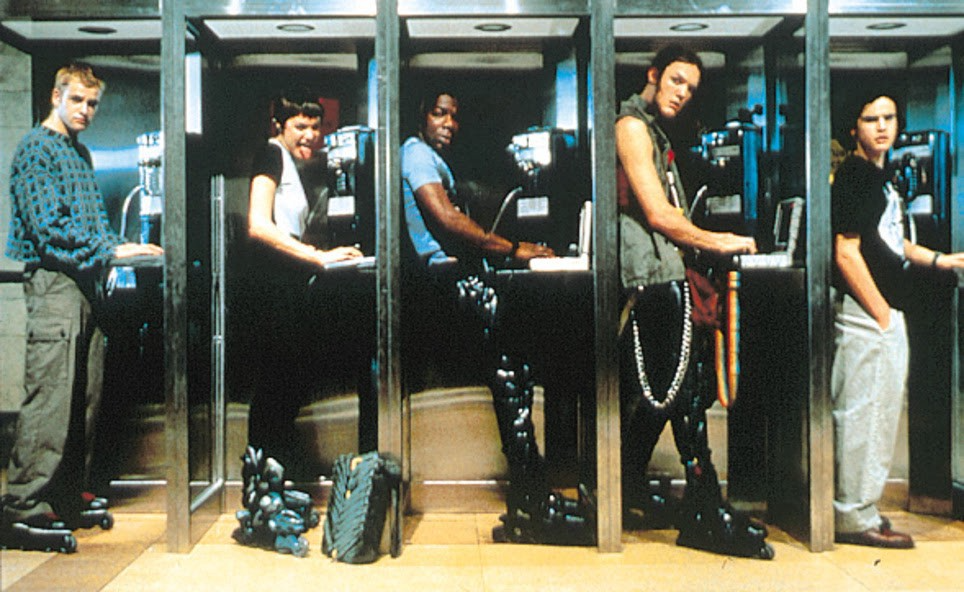
Modern usage describes a butcher or ax murderer's cleaver chop. The 1980s programming boom distinguished elegant code from "hacks". Both got you to your goal, but the latter made any programmer cringe and mutter about changing the code. From this emerged the hacker trope, the friendless anti-villain living in a murky hovel lit by the computer monitor, eating junk food and breaking into databases to highlight security system failures or steal hotdog money.
Now, start-a-billion-dollar-business-from-your-garage types have shifted their sights from app development to DIY biology, coining the term "bio-hack". This is a required keyword and meta tag for every fitness-related podcast, book, conference, app, or device.
Bio-hacking involves bypassing your body and mind's security systems to achieve a goal. Many biohackers' initial goals were reasonable, like lowering blood pressure and weight. Encouraged by their own progress, self-determination, and seemingly exquisite control of their biology, they aimed to outsmart aging and death to live 180 to 1000 years (summarized well in this vox.com article).
With this grandiose north star, the hunt for novel supplements and genetic engineering began.
Companies selling do-it-yourself biological manipulations cite lab studies in mice as proof of their safety and success in reversing age-related diseases or promoting longevity in humans (the goal changes depending on whether a company is talking to the federal government or private donors).
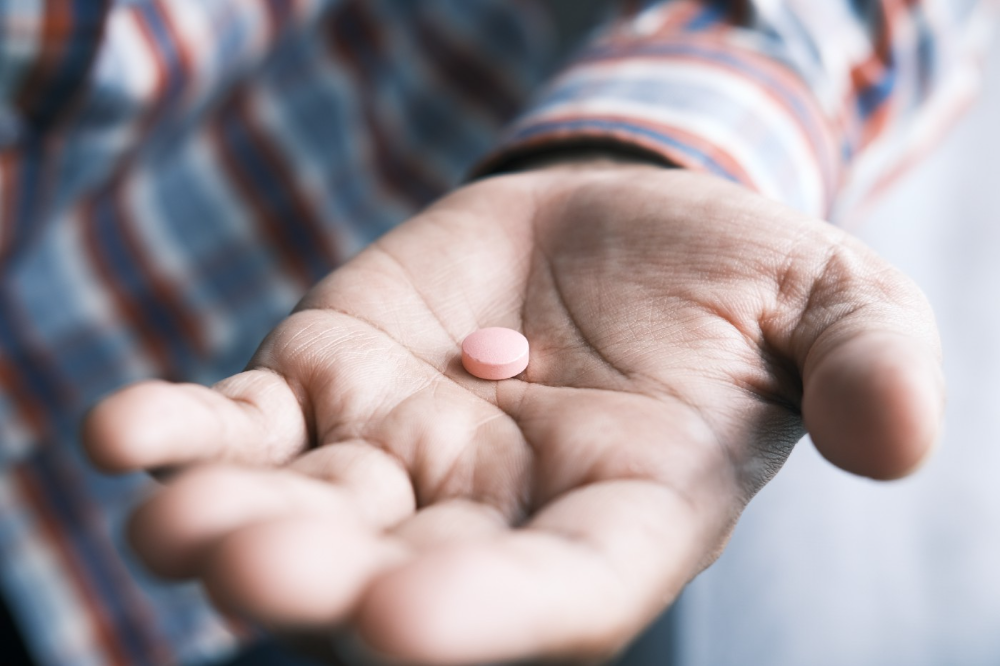
The FDA is slower than science, they say. Why not alter your biochemistry by buying pills online, editing your DNA with a CRISPR kit, or using a sauna delivered to your home? How about a microchip or electrical stimulator?
What could go wrong?
I'm not the neo-police, making citizen's arrests every time someone introduces a new plumbing gadget or extrapolates from animal research on resveratrol or catechins that we should drink more red wine or eat more chocolate. As a scientist who's spent her career asking, "Can we get better?" I've come to view bio-hacking as misguided, profit-driven, and counterproductive to its followers' goals.
We're creatures of nature. Despite all the new gadgets and bio-hacks, we still use Roman plumbing technology, and the best way to stay fit, sharp, and happy is to follow a recipe passed down since the beginning of time. Bacteria, plants, and all natural beings are rhythmic, with alternating periods of high activity and dormancy, whether measured in seconds, hours, days, or seasons. Nature repeats successful patterns.
During the Upstate, every cell in your body is naturally primed and pumped full of glycogen and ATP (your cells' energy currencies), as well as cortisol, which supports your muscles, heart, metabolism, cognitive prowess, emotional regulation, and general "get 'er done" attitude. This big energy release depletes your batteries and requires the Downstate, when your subsystems recharge at the cellular level.
Downstates are when you give your heart a break from pumping nutrient-rich blood through your body; when you give your metabolism a break from inflammation, oxidative stress, and sympathetic arousal caused by eating fast food — or just eating too fast; or when you give your mind a chance to wander, think bigger thoughts, and come up with new creative solutions. When you're responding to notifications, emails, and fires, you can't relax.
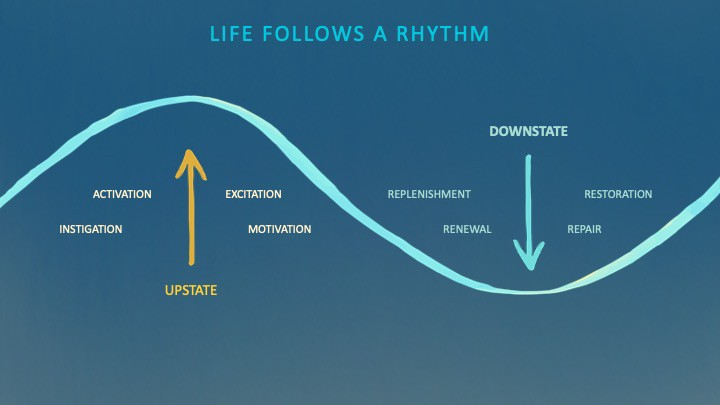
Downstates aren't just for consistently recharging your battery. By spending time in the Downstate, your body and brain get extra energy and nutrients, allowing you to grow smarter, faster, stronger, and more self-regulated. This state supports half-marathon training, exam prep, and mediation. As we age, spending more time in the Downstate is key to mental and physical health, well-being, and longevity.
When you prioritize energy-demanding activities during Upstate periods and energy-replenishing activities during Downstate periods, all your subsystems, including cardiovascular, metabolic, muscular, cognitive, and emotional, hum along at their optimal settings. When you synchronize the Upstates and Downstates of these individual rhythms, their functioning improves. A hard workout causes autonomic stress, which triggers Downstate recovery.
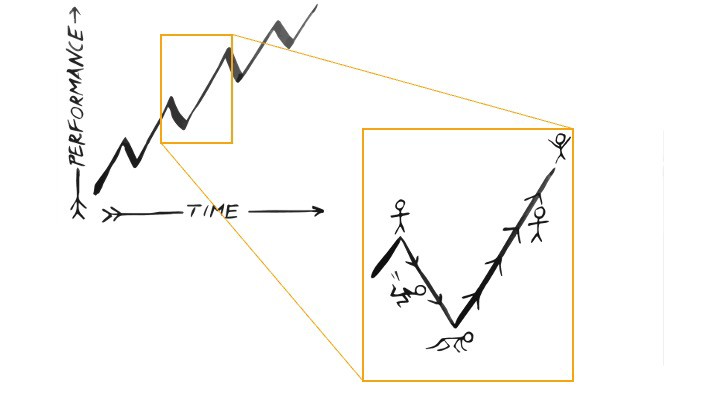
By choosing the right timing and type of exercise during the day, you can ensure a deeper recovery and greater readiness for the next workout by working with your natural rhythms and strengthening your autonomic and sleep Downstates.
Morning cardio workouts increase deep sleep compared to afternoon workouts. Timing and type of meals determine when your sleep hormone melatonin is released, ushering in sleep.
Rhythm isn't a hack. It's not a way to cheat the system or the boss. Nature has honed its optimization wisdom over trillions of days and nights. Stop looking for quick fixes. You're a whole system made of smaller subsystems that must work together to function well. No one pill or subsystem will make it all work. Understanding and coordinating your rhythms is free, easy, and only benefits you.
Dr. Sara C. Mednick is a cognitive neuroscientist at UC Irvine and author of The Power of the Downstate (HachetteGO)
You might also like

obimy.app
1 month ago
How TikTok helped us grow to 6 million users
This resulted to obimy's new audience.
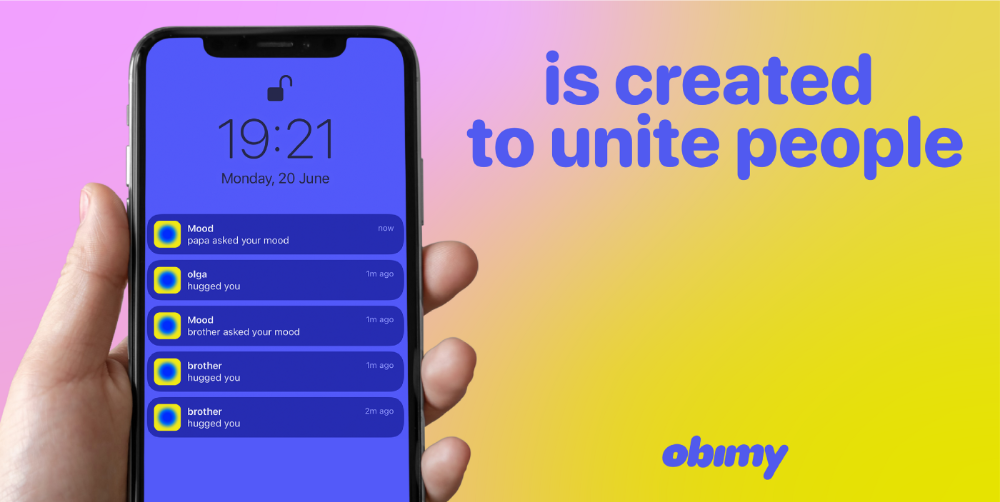
Hi! obimy's official account. Here, we'll teach app developers and marketers. In 2022, our downloads increased dramatically, so we'll share what we learned.
obimy is what we call a ‘senseger’. It's a new method to communicate digitally. Instead of text, obimy users connect through senses and moods. Feeling playful? Flirt with your partner, pat a pal, or dump water on a classmate. Each feeling is an interactive animation with vibration. It's a wordless app. App Store and Google Play have obimy.
We had 20,000 users in 2022. Two to five thousand of them opened the app monthly. Our DAU metric was 500.
We have 6 million users after 6 months. 500,000 individuals use obimy daily. obimy was the top lifestyle app this week in the U.S.
And TikTok helped.
TikTok fuels obimys' growth. It's why our app exploded. How and what did we learn? Our Head of Marketing, Anastasia Avramenko, knows.
our actions prior to TikTok
We wanted to achieve product-market fit through organic expansion. Quora, Reddit, Facebook Groups, Facebook Ads, Google Ads, Apple Search Ads, and social media activity were tested. Nothing worked. Our CPI was sometimes $4, so unit economics didn't work.
We studied our markets and made audience hypotheses. We promoted our goods and studied our audience through social media quizzes. Our target demographic was Americans in long-distance relationships. I designed quizzes like Test the Strength of Your Relationship to better understand the user base. After each quiz, we encouraged users to download the app to enhance their connection and bridge the distance.
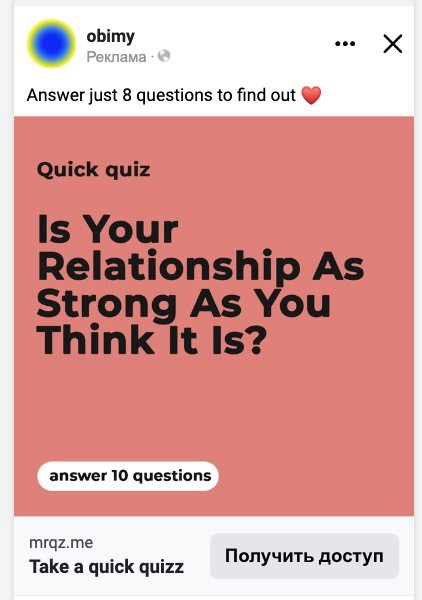
We got 1,000 responses for $50. This helped us comprehend the audience's grief and coping strategies (aka our rivals). I based action items on answers given. If you can't embrace a loved one, use obimy.
We also tried Facebook and Google ads. From the start, we knew it wouldn't work.
We were desperate to discover a free way to get more users.
Our journey to TikTok
TikTok is a great venue for emerging creators. It also helped reach people. Before obimy, my TikTok videos garnered 12 million views without sponsored promotion.
We had to act. TikTok was required.
I wasn't a TikTok user before obimy. Initially, I uploaded promotional content. Call-to-actions appear strange next to dancing challenges and my money don't jiggle jiggle. I learned TikTok. Watch TikTok for an hour was on my to-do list. What a dream job!
Our most popular movies presented the app alongside text outlining what it does. We started promoting them in Europe and the U.S. and got a 16% CTR and $1 CPI, an improvement over our previous efforts.
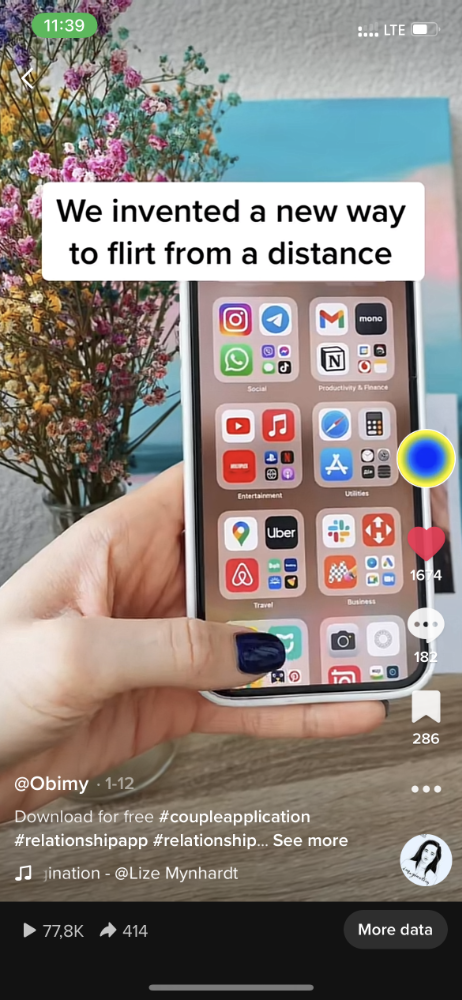
Somehow, we were expanding. So we came up with new hypotheses, calls to action, and content.
Four months passed, yet we saw no organic growth.
Russia attacked Ukraine.
Our app aimed to be helpful. For now, we're focusing on our Ukrainian audience. I posted sloppy TikToks illustrating how obimy can help during shelling or air raids.
In two hours, Kostia sent me our visitor count. Our servers crashed.
Initially, we had several thousand daily users. Over 200,000 users joined obimy in a week. They posted obimy videos on TikTok, drawing additional users. We've also resumed U.S. video promotion.
We gained 2,000,000 new members with less than $100 in ads, primarily in the U.S. and U.K.
TikTok helped.
The figures
We were confident we'd chosen the ideal tool for organic growth.
Over 45 million people have viewed our own videos plus a ton of user-generated content with the hashtag #obimy.
About 375 thousand people have liked all of our individual videos.
The number of downloads and the virality of videos are directly correlated.
Where are we now?
TikTok fuels our organic growth. We post 56 videos every week and pay to promote viral content.
We use UGC and influencers. We worked with Universal Music Italy on Eurovision. They offered to promote us through their million-follower TikTok influencers. We thought their followers would improve our audience, but it didn't matter. Integration didn't help us. Users that share obimy videos with their followers can reach several million views, which affects our download rate.
After the dust settled, we determined our key audience was 13-18-year-olds. They want to express themselves, but it's sometimes difficult. We're searching for methods to better engage with our users. We opened a Discord server to discuss anime and video games and gather app and content feedback.
TikTok helps us test product updates and hypotheses. Example: I once thought we might raise MAU by prompting users to add strangers as friends. Instead of asking our team to construct it, I made a TikTok urging users to share invite URLs. Users share links under every video we upload, embracing people worldwide.
Key lessons
Don't direct-sell. TikTok isn't for Instagram, Facebook, or YouTube promo videos. Conventional advertisements don't fit. Most users will swipe up and watch humorous doggos.
More product videos are better. Finally. So what?
Encourage interaction. Tagging friends in comments or making videos with the app promotes it more than any marketing spend.
Be odd and risqué. A user mistakenly sent a French kiss to their mom in one of our most popular videos.
TikTok helps test hypotheses and build your user base. It also helps develop apps. In our upcoming blog, we'll guide you through obimy's design revisions based on TikTok. Follow us on Twitter, Instagram, and TikTok.

Alexander Nguyen
2 months ago
How can you bargain for $300,000 at Google?
Don’t give a number

Google pays its software engineers generously. While many of their employees are competent, they disregard a critical skill to maximize their pay.
Negotiation.
If Google employees have never negotiated, they're as helpless as anyone else.
In this piece, I'll reveal a compensation negotiation tip that will set you apart.
The Fallacy of Negotiating
How do you negotiate your salary? “Just give them a number twice the amount you really want”. - Someplace on the internet
Above is typical negotiation advice. If you ask for more than you want, the recruiter may meet you halfway.
It seems logical and great, but here's why you shouldn't follow that advice.
Haitian hostage rescue
In 1977, an official's aunt was kidnapped in Haiti. The kidnappers demanded $150,000 for the aunt's life. It seems reasonable until you realize why kidnappers want $150,000.
FBI detective and negotiator Chris Voss researched why they demanded so much.
“So they could party through the weekend”
When he realized their ransom was for partying, he offered $4,751 and a CD stereo. Criminals freed the aunt.
These thieves gave 31.57x their estimated amount and got a fraction. You shouldn't trust these thieves to negotiate your compensation.
What happened?
Negotiating your offer and Haiti
This narrative teaches you how to negotiate with a large number.
You can and will be talked down.
If a recruiter asks your wage expectation and you offer double, be ready to explain why.
If you can't justify your request, you may be offered less. The recruiter will notice and talk you down.
Reasonably,
a tiny bit more than the present amount you earn
a small premium over an alternative offer
a little less than the role's allotted amount
Real-World Illustration

Recruiter: What’s your expected salary? Candidate: (I know the role is usually $100,000) $200,000 Recruiter: How much are you compensated in your current role? Candidate: $90,000 Recruiter: We’d be excited to offer you $95,000 for your experiences for the role.
So Why Do They Even Ask?
Recruiters ask for a number to negotiate a lower one. Asking yourself limits you.
You'll rarely get more than you asked for, and your request can be lowered.
The takeaway from all of this is to never give an expected compensation.
Tell them you haven't thought about it when you applied.

Sammy Abdullah
1 month ago
R&D, S&M, and G&A expense ratios for SaaS
SaaS spending is 40/40/20. 40% of operating expenses should be R&D, 40% sales and marketing, and 20% G&A. We wanted to see the statistics behind the rules of thumb. Since October 2017, 73 SaaS startups have gone public. Perhaps the rule of thumb should be 30/50/20. The data is below.
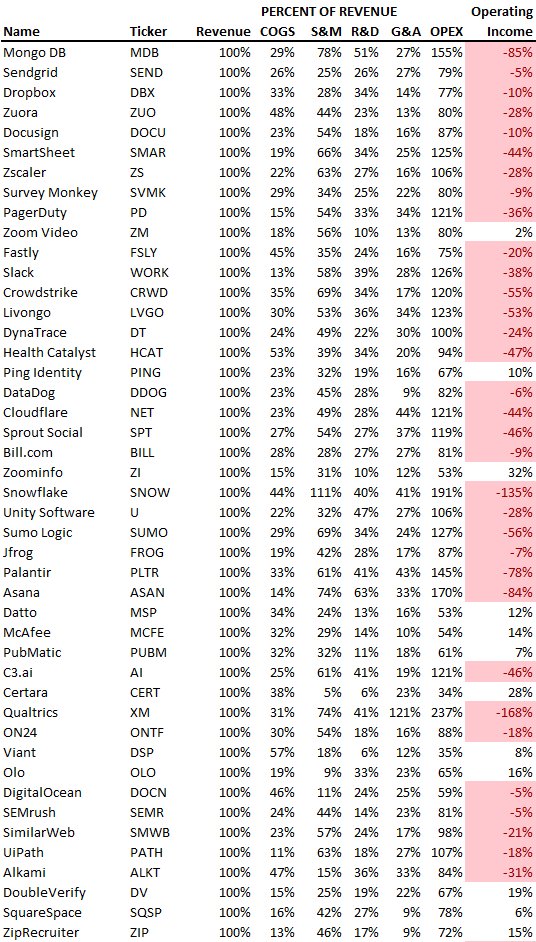
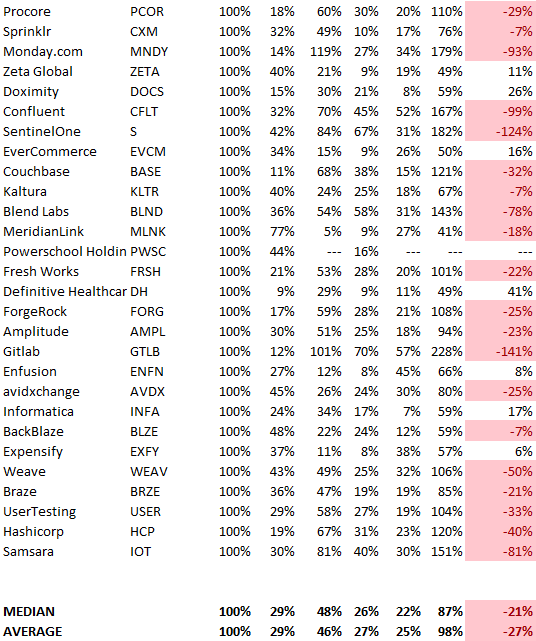
30/50/20. R&D accounts for 26% of opex, sales and marketing 48%, and G&A 22%. We think R&D/S&M/G&A should be 30/50/20.
There are outliers. There are exceptions to rules of thumb. Dropbox spent 45% on R&D whereas Zoom spent 13%. Zoom spent 73% on S&M, Dropbox 37%, and Bill.com 28%. Snowflake spent 130% of revenue on S&M, while their EBITDA margin is -192%.
G&A shouldn't stand out. Minimize G&A spending. Priorities should be product development and sales. Cloudflare, Sendgrid, Snowflake, and Palantir spend 36%, 34%, 37%, and 43% on G&A.
Another myth is that COGS is 20% of revenue. Median and averages are 29%.
Where is the profitability? Data-driven operating income calculations were simplified (Revenue COGS R&D S&M G&A). 20 of 73 IPO businesses reported operational income. Median and average operating income margins are -21% and -27%.
As long as you're growing fast, have outstanding retention, and marquee clients, you can burn cash since recurring income that doesn't churn is a valuable annuity.
The data was compelling overall. 30/50/20 is the new 40/40/20 for more established SaaS enterprises, unprofitability is alright as long as your business is expanding, and COGS can be somewhat more than 20% of revenue.